Jan 022014
 

The total number of people living in poverty in Mexico continues to rise, though the poverty rate (as a percentage) remains roughly the same. According to Mexico’s National Political and Social Development Commission (Spanish language acronym: Coneval), the number of people in poverty has risen steadily for several years, much in line with Mexico’s rising total population. Coneval’s figures are based on a simple multidimensional poverty index, which considers the following criteria:

  • household income
  • access to education
  • access to food
  • access to health care
  • access to social services
  • housing quality
  • access to basic household services (electricity, water, drainage)

According to Coneval, 53.3 million Mexicans (45.5% of the total population) were living in poverty in 2012, compared to 52.8 million (46.1% of the then population) in 2010 and 48.8 million Mexicans (44.5%of the population) in 2008.

Note that poverty statistics prior to 2008 in Mexico were generally based purely on income levels. From 2008, this method was replaced by a multidimensional index. The precise details of the index have been modified slightly since that time, making exact comparisons between 2012 and 2008 more problematic.

While the precise numbers are subject to debate, mainly due to differing definitions of what constitutes “poverty” and how it can be measured, the trend revealed by the Coneval numbers is supported by the Economic Commission for Latin America and the Caribbean (ECLAC) in its “Social Panorama of Latin America 2013“, published in December 2013. The ECLAC report found that Mexico is one of a very few countries where poverty levels rose between 2011 and 2012, from 36.3% of the population to 37.1%, according to its definition.

The dire situation in Mexico compares to a slight decrease in poverty in most larger Latin American countries, including Venezuela, Ecuador, Brazil, Peru, Argentina and Colombia.

In absolute terms, according to ECLAC, 164 million people were found to be living in poverty in Latin America, about 57.4 million (35%) of them in Mexico.

Change in poverty rates in Mexico, 2010-2012.

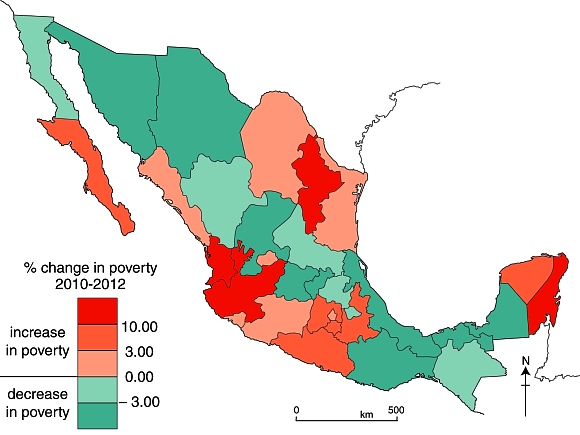
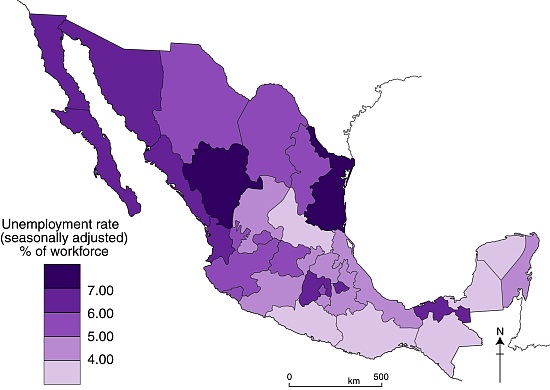
Change in poverty rates in Mexico, 2010-2012. Credit: Geo-Mexico; all rights reserved. Data: Coneval

The map shows the Coneval data for changes in the poverty rate between 2010 and 2012 by state. It appears that poverty levels increased in many of Mexico’s more prosperous areas and in the longer established industrial areas, as well as in almost all areas where tourism is important. Poverty decreased in some of Mexico’s more rural, and generally poorer, states.

Related posts:

Dec 122013
 

Today is 12 December, the feast day of Our Lady of Guadalupe, the beloved indigenous patron saint of Mexico and much of the Americas. This seems like a good excuse, if ever one was needed, to revisit the “Gender Gap” in Mexico. The gender gap assesses the “gap” between females and males for a number of variables, but should not be taken as reflecting the quality of life of females in different countries.  For example, the gender gap between women in Japan and Japanese men is very large, even though Japanese women enjoy a relatively high quality of life.

In “The Global Gender Gap Report 2013″, the World Economic Forum (WEF), based in Geneva, Switzerland, placed Mexico 68th of the 136 nations included in the study. Between them, the 136 nations house 93% of the world population. Mexico has risen 16 places in the rankings since 2012, meaning that the gender gap in Mexico is narrowing, even if there is still a long way to go to reach gender equality. (It is worth noting that Mexico has been climbing steadily up the rankings for several years, from #98 in 2009, to #91 in 201, #89 in 2011 and #84 in 2012).

Of the 136 countries studied for the 2013 report, Iceland had the smallest gender gap, for the 5th year running, followed by Finland, Norway and Sweden.

Among Latin American nations, Nicaragua had the smallest gender gap (placing 10th in the world), with Cuba, which has the highest female participation in government, coming in 15th and Brazil remaining 62nd. Other notable placings were Germany 14th, and South Africa 17th.

gender gap graph for Mexico

How Mexico (country score) compares to other countries (sample average). Source: Gender Gap Report 2013

The Gender Gap Index is a composite index comprised of a number of variables grouped into four key areas:

  • health and survival
  • educational attainment
  • political empowerment
  • economic participation

As noted in our summary of the 2012 Gender Gap Report, Mexico ranks #1 in the world, tying with several other countries, for the health and survival subindex. This means that Mexican females are unsurpassed with respect to sex ratio at birth (female/male) combined with female life expectancy (female/male).

For the other subindexes, in 2013 Mexico ranked #36 for political empowerment and #70 for educational attainment, but a lowly #111 for economic participation.

Geo-Mexico agrees wholeheartedly with Klaus Schwab, founder and executive chairman of the World Economic Forum, who called for renewed efforts to ensure gender equality, saying that, “Countries will need to start thinking of human capital very differently – including how they integrate women into leadership roles. This shift in mindset and practice is not a goal for the future, it is an imperative today.”

Related posts:

Mexico City explores deep water aquifer

 Mexico's geography in the Press, Updates to Geo-Mexico  Comments Off on Mexico City explores deep water aquifer
Dec 092013
 

Background: The Valley of Mexico is an interior basin about 9000 square km in area. The basin floor sits at an elevation of 2200 meters above sea level and is surrounded by mountains that rise up to more than 5000 meters above sea level. It receives around 700 mm of rainfall a year, with a rainy season from late May to September.

The basin was originally the site of several lakes and marshes, and much of it is underlain by lacustrine sediments up to 100 m thick, beneath which are alluvial sediments up to 500 m thick (see geological cross-section below). These sediments are interstratified with layers of volcanic basalt. Beneath the alluvial sediments are 100 m to 600 m of volcanic deposits, which form the principal Mexico City aquifer (found about 500 m to 1000 m below Mexico City).

As Mexico City has grown, and water demands have increased, this main aquifer has been greatly overexploited, leading to a drop in the level of the water table underground, accompanied by ground subsidence that has had serious consequences for Mexico City:

Feasibility study of a deep aquifer

The National Water Commission (CNA) and Mexico City Water System (SACM) are undertaking a 3-year, 23-million-dollar feasibility study to assess the potential of an aquifer that lies more than 2000 meters below Mexico City. (Our earlier, initial report about this aquifer is here).  The project includes experts from Pemex, CFE and UNAM’s Institute of Geophysics.

Schematic stratigraphy of the southern portion of the Basin of Mexico.

Schematic stratigraphy of the southern portion of the Basin of Mexico.
Source: Adapted from Mooser, 1990.

Initial exploratory wells have shown that the deep aquifer’s water quality is superior to that currently derived from the overexploited shallower wells that extend to depths of around 800m.

It is hoped that the feasibility study will confirm that water from the deep aquifer could be an additional viable source of freshwater for the city. Assuming the deep aquifer is hydrologically independent of the shallower aquifers, this  would not only reduce the need to pump water from the shallower aquifers, but would also avoid the ground subsidence resulting from continued shallow-water extraction. The feasibility study will assess whether or not the deep water aquifer is “fossil” water or is still being recharged from precipitation and underground throughflow. If it is being recharged, the experts will calculate its recharge rate to determine the aquifer’s maximum sustainable yield. (The maximum sustainable yield is the “additional groundwater output from the system which will cause minimal and acceptable levels of stress to the ecosystem with maximum benefits to the society and to the economy”).

The first test well is likely to be sunk in the Magdalena Mixhuca Sports City area, in the eastern part of Mexico City.

This potential deep aquifer source of freshwater could play a vital part in ensuring that future generations of Mexico City residents have a dependable and sustainable water supply.

Mexico’s consideration of utilizing deep water aquifers runs counter to the prevailing wisdom in the US where it has long been argued that deep water aquifers will be too costly to utilize for fresh water, will never be used, and are therefore more useful as a repository for waste and can be intentionally polluted.

As a result, as this Huffington Post article explains, “policy-makers often exempt these deep aquifers from clean water protections and allow energy and mining companies to inject pollutants directly into them.”  The article adds that, “the U.S. Environmental Protection Agency has issued more than 1,500 permits for companies to pollute such aquifers in some of the driest regions. Frequently, the reason was that the water lies too deep to be worth protecting.”

References:

Mooser, F. 1990. “Estratigrafía y estructura del Valle de México en el subseulo de la cuenca del Valle de México y su relacíon con la Ingeniería de cimentaciones, a cinco anos del sismo”, in Revista de la Sociedad Mexicana de Mecánica de Suelos. Mexico, D.F.

For a detailed description of Mexico City’s shallower aquifer and its exploitation, see Mexico City’s Water Supply: Improving the Outlook for Sustainability (1995) (viewable online or register for a free download)

Related posts:

Mexico’s Pemex is one of the most competitive oil firms in the world

 Updates to Geo-Mexico  Comments Off on Mexico’s Pemex is one of the most competitive oil firms in the world
Dec 022013
 

Despite the criticisms regularly leveled at it, Mexico’s oil giant Pemex is actually one of the most competitive oil firms in the world.

First, its costs of exploration and production are much lower than those of most other major oil companies. Pemex’s production costs in 2012 averaged 6.84 dollars/barrel (d/b) of oil equivalent, well below the costs incurred by international rivals Exxon (9.91 d/b), Chevron (15.16), Total (8.17), Shell (12.47) and British Petroleum (12.50).

pemexPemex’s exploration and development costs are also among the world’s lowest. They fell from 16.13 d/b in 2011 to 13.77 d/b in 2012, mainly due to the discovery of several new reserves. Among major players, only Shell had lower costs (11.75 d/b), with Pemex well ahead of British Petroleum (17.37 d/b), Exxon (19.31), Total (22.68) and Chevron (28.81).

Thirdly, as new fields are fully explored, Mexico’s proven oil reserves are expected to continue to rise for a number of years, from the current level of 13.87 billion barrels to 14.92 billion barrels by 2018. (During this period, Pemex will extract an estimated 6.64 billion barrels, but they will be more than replaced by anticipated new discoveries)

How important is Pemex to the Mexican economy?

One third of Mexico’s national budget comes from the petro industry, which accounted for 7.6% of GDP in 2012.

In 2012, Pemex invested 23.9 billion dollars in Mexico, appreciably more than the 19.2 billion dollars invested that year by América Móvil, Femsa, Walmart, Frisco, Cemex, Liverpool, Alfa and Mexichem, combined.

In terms of revenues, Pemex had revenues in 2012 of 142.4 billion dollars, greater than the 139.1 billion dollars in revenues of América Móvil, WalMart, Femsa, Alfa and Cemex combined.

According to a Bloomberg analysis, between 1973 and 2012, Pemex generated a cash flow (before tax and depreciation) that was 63% higher than the total cash flow of all the firms listed on the Mexican Stock Market. In 2012, the Ebitda (Earnings before Interest, Tax, Depreciation and Amortization) of Pemex was 88.2 billion dolalrs, compared to the combined 54.2 billion dolalrs of Ebitda for América Móvil, Banorte, Femsa, Walmart de México, Grupo Modelo, Cemex, Kof, Televisa, Peñoles and Alfa.

How important is Pemex in the worldwide picture?

According to Petroleum Intelligence Weekly, U.S. Energy Information Administration and U.S. Crude Oil Imports by Country, Pemex is one of the world’s five most important crude oil producers, after Aramco (Sauid Arabia), NIOC (Iran), CNPC (China) and KPC (Kuwait).

Pemex is the third largest oil exporter to the USA, after Canada and Saudi Arabia, but ahead of Venezuela and Nigeria.

Pemex installations in Mexico. (Adapted from Fig 15.5 of Geo-Mexico). All rights reserved.

Pemex installations in Mexico. (Adapted from Fig 15.5 of Geo-Mexico). All rights reserved.

Mexico has the world’s 13th largest crude oil reserves and Pemex has the world’s 15th highest oil company revenues.

Mexico’s proposed energy reforms, which will allow private sector firms more access to some parts of the oil and gas sector, will only serve to boost the competitiveness of Mexico’s oil industry. The major problems facing Pemex are not directly related to revenues or to competitiveness, but are the persistence of corruption and a lack of transparency.

Related posts:


Many Mexican Bracero workers still trying to claim their pay

 Excerpts from Geo-Mexico, Updates to Geo-Mexico  Comments Off on Many Mexican Bracero workers still trying to claim their pay
Nov 302013
 

In response to severe labor needs during the second world war, the governments of Mexico and the USA initiated the Bracero guest worker program in 1942. The program enabled Mexico to contribute to the war effort by sending temporary agricultural workers to the USA. Mexicans were granted renewable six month visas to work on selected farms. Most migrants under the Bracero program came from the same three states, Michoacán, Jalisco and Guanajuato. They worked mostly in California and other states along the Mexican border.

Los BracerosAs a result of the Bracero program, some farmers in the USA became very dependent on relatively cheap Mexican labor. The program was considered a great success by farmers. Unfortunately mistreatment of Bracero laborers was widespread. In protest, the Mexican Government threatened to stop the flow of migrants. During the war many Mexicans who were not recruited under the Bracero program entered the USA illegally looking for work. Tolerance for unauthorized migration developed on both sides of the border. With a large dependency in the USA on Mexican farm workers and a large supply in Mexico, there was virtually no way to put a halt to this migration stream.

Labor unions, churches and Latino groups in the USA opposed the Bracero program on the grounds that it held down farm wages and impeded the upward mobility of US Hispanics. They convinced the US Congress to halt the Bracero program in 1964. Between 1942 and 1964 an estimated 4.5 million Mexican Bracero workers entered the USA. At its height in the late 1950s more than 500,000 workers migrated each year. Most were temporary migrants who returned to Mexico within a year, often settling in larger cities, exacerbating the flow of migrants from rural areas to the growing cities. The Bracero program set the stage for the continued high volume of Mexican labor migration to the USA.

In an effort to ensure that the Bracero workers were only temporary migrants to the USA, the US government withheld 10% of all their earnings. The US government then remitted this amount to the Mexican government for payment to the workers on their return home. More than 70 years after the Bracero program started, many braceros are still trying to claim money that they earned legitimately years ago and that is still owed to them by the Mexican government.

The struggles of temporary bracero workers who were never repaid the 10% that had been withheld, are detailed in a short October 2013 article entitled “Bracero Guestworkers, Unpaid”, written by Adam Goodman and Verónica Zapata Rivera (history doctorate students at, respectively, the University of Pennsylvania and Mexico’s National Autonomous University).

The article also describes some of the other injustices faced by Bracero workers, including forced whole-body fumigation with DDT as they crossed the US border.

For more information about the Bracero program, see The Bracero Archive

Related posts:

Remittances to Mexico from USA decline slightly in 2013

 Updates to Geo-Mexico  Comments Off on Remittances to Mexico from USA decline slightly in 2013
Nov 232013
 

Using recent World Bank data, the Pew Research Center conducted an in-depth analysis of remittances sent from the USA to Latin American countries.

Remittances to Mexico peaked at over $30 billion in 2006, but as a result of the Great Recession, have declined by roughly 29% to an estimated $22 billion in 2013. (The analysis is based on constant 2013 US dollars).

Figure 1 of Pew Report

Figure 1 of Pew Report. Shaded area is period of recession.

On the other hand, remittances to all other Latin American countries reached almost $31 billion in 2008, declined slightly but were up to almost $32 billion in 2013 (see graph).

Note that the data are for remittances sent through formal channels such as banks and formal money transfer businesses. The average cost of sending these formal remittances is significant, an estimated 7.3% in late 2013. If all informal remittances were included, the remittances to Mexico would be an estimated 50% higher, or over $30 billion.

The study focuses particular attention on Mexico because it receives more than 40% of all remittances from the USA to Latin America. Mexico ranks 4th worldwide in total remittances, behind India ($71 billion), China ($60 billion) and the Philippines ($26 billion). These three other countries get remittances from many countries throughout the developed world while 98% of Mexico’s remittances come from the USA. The remaining 2% come mostly from Spain and Canada. No other country in Latin America receives more than 90% of their remittances from the USA. Spain is a bigger source of remittances than the USA for Argentina, Bolivia, Paraguay and Uruguay. This is a bit surprising given the horrible current economic situation in Spain. Many Spaniards are now migrating to Mexico in search of work.

The USA is by far the largest source of all worldwide remittances with $123 billion, followed by Saudi Arabia $28 billion and Canada $24 billion. However, on a per capita basis or percentage of GDP basis, Saudi Arabia, Canada and many other countries send significantly more in remittances than the USA.

The main reason why remittances to Mexico declined after 2006 is that the Great Recession very seriously hurt the construction industry, a main source of jobs for Mexican immigrants. Related to this, the overall loss of jobs in the USA meant that many immigrants returned to Mexico. In recent years it appears that more have returned to Mexico than have migrated to the USA. Thus the number of Mexican-born residents in the USA is declining very slightly for the first time since the Great Depression in the 1930s.

While remittances are extremely important to specific Mexican households, particularly rural households in western Mexico, remittances are not as important to the overall Mexican economy as they are to some other countries. Remittances account for about 2% of the overall Mexican GDP compared to 17% in El Salvador, 16% in Honduras and 10% in both Guatemala and Nicaragua.

The average amount of remittances sent by Mexican immigrants is rather low compared to immigrants from other countries. On average immigrants from Mexico over age 18 sent $2,115 in remittances per year, compared to $5,558 for immigrants from Guatemala, $5,231 for Honduras, $3,076 for Dominican Republic and $2,939 for El Salvador. We do not know if immigrants from these other countries had higher paying jobs than those from Mexico.

Source:

D’Vera Cohn, Ana Gonzalez-Barrera and Danielle Cuddington, “Remittances to Latin America Recover – but Not to Mexico”, Pew Research Center, November 15, 2013.

For more detail about remittances in Mexico, see:


The pattern of unemployment in Mexico in 2013

 Updates to Geo-Mexico  Comments Off on The pattern of unemployment in Mexico in 2013
Nov 182013
 

The accuracy of Mexico’s unemployment statistics is frequently questioned in the media but INEGI, Mexico’s National Geography, Statistics and Information Institute, uses internationally accepted methods to compute various different unemployment indices. As in most countries, INEGI surveys are based on samples in urban areas, involving 80,000 interviews in more than 30 towns and cities.

The International Labour Organization defines “unemployed workers” as those members of the workforce currently not working but willing and able to work, who have actively sought work in the past four weeks. Note that the mere act of looking at newspaper or online ads is not considered sufficient evidence of “actively seeking work”.

Mexico’s economically active population in the third quarter of 2013 was 52.3 million people, a very slight (0.01%) increase on the comparable figure for 2012.  The figure represents 59% of the total population aged 14 and over.

INEGI statistics show that the under-employed population was 8.5% of all those with jobs. The unemployed population was 2.7 million, 5.2% of the workforce.

Mexico’s workforce is not gender-independent. 77 out of every 100 men are economically active, compared to only 43 of every 100 women. The workforce can be subdivided between primary occupations (6.8 million, 13.8% of the total workforce); secondary occupations (11.9 million, 24%) and the tertiary or services sector (30.6 million, 61.6% of  workforce), with the remaining 0.6% undeclared.

Map of unemployment rates

Unemployment in Mexico, third quarter of 2013. Cartography: Tony Burton; all rights reserved

Out-migration from several southern and western states has significantly reduced unemployment. Several southern states are among those with the lowest unemployment rates in the entire country.

The highest rates of unemployment are mainly in northern Mexico, parts of which have seen on-going violence in the war against drugs. Workers flocked to these areas during the boom times of Mexico’s maquiladora program when firms were encouraged to set up “in-bond” factories in these states, enjoying the freedom to import components and export finished products. However, the slow recovery of the US economy has reduced demand for consumer products and many maquiladora factories have reduced their workforce, leading to intense competition for available jobs and a higher rate of unemployment.

What other factors influence unemployment and help explain the patterns shown by the map?

This post describes the spatial pattern of unemployment in the third quarter of 2013. By way of comparison with 2010, see

Mexico’s economy and workforce are analyzed in chapters 14 to 20 of Geo-Mexico: the geography and dynamics of modern Mexico. Ask your library to buy a copy of this handy reference guide to all aspects of Mexico’s geography today! Better yet, order your own copy…

Record avocado production and exports, 2012-2013

 Updates to Geo-Mexico  Comments Off on Record avocado production and exports, 2012-2013
Nov 112013
 

Mexico is the world’s largest producer and exporter of avocados. In the 2012/13 season, Mexico’s avocado orchards produced a record 1.3 million metric tons of avocados. More than 90% of Mexico’s avocados are grown in the state of Michoacán, where about 12% of all agricultural land is currently under avocado orchards.

Avocado-growing states in Mexico.

Avocado-growing states in Mexico

Avocado exports rose 33% to 643,000 metric tons, worth 1.2 billion dollars, also a new record. The main export market remains the USA which imported 518,000 metric tons between July 2012 and June 2013, to help satisfy a demand that has risen rapidly.

Total USA avocado imports in 2012-2013 from all countries were 40% higher than the previous year, and have risen over the past 15 years from 200,000 metric tons to 750,000 metric tons.

In 2012-2013, Mexico also exported 125,000 metric tons of avocados to Canada, Japan, Central America and Europe, a 32% increase over the year before.

The Federal Farming Secretariat has introduced a new national certification system for growers to help ensure consistent quality and reduce spoilage during transport. Many avocado growers are working towards increasing the number of orchards certified by Global Gap, a worldwide certification organization.

avocado-marketingRelated posts:

Geo-Mexico has many other agriculture-related posts (easily found via our tag system). They include posts about the geography of growing/producing Christmas trees, cacao, honey, sugarcane, coffee, chiles, floriculture, tomatoes, tequila, horticultural crops and oranges. Enjoy!

Nov 062013
 

Mexico City and its surrounding areas have a strict “Hoy no circula” (“Today you can’t drive” or “Day without a Car”) program. The program is intended to reduce air pollution from vehicle emissions.

Day without a car table

The graphic shows the major rules for most vehicles. With few exceptions, these rules apply to all tourist vehicles as well as Mexican-plated vehicles.

Click here for a Wikipedia article with more details of the rules, including Saturday rules and exceptions

Area subject to “Day without a Car” rules, November-2013. All rights reserved.

As of November 2013, the “Hoy no circula” program applies to the Federal District and the following 18 adjoining municipalities in the State of Mexico (see map):

  • Atizapán de Zaragoza
  • Coacalco de Berriozabal
  • Cuautitlán
  • Cuautitlán Izcalli
  • Chalco
  • Chimalhuacan
  • Chicoloapan
  • Ecatepec de Morelos
  • Huixquilucan
  • Ixtapaluca
  • La Paz
  • Naucalpan de Juárez
  • Nezahualcóyotl
  • Nicolás Romero
  • Tecámac
  • Tlalnepantla de Baz
  • Tultitlán
  • Valle de Chalco Solidaridad

No responsibility or liability is assumed for any situation arising from the information contained within this post, which is believed to be accurate at the time of writing. For more details about the growth of Mexico City, and its urban issues and management strategies, consider buying a copy of Geo-Mexico: the geography and dynamics of modern Mexico, available from all good bookstores, as well as via amazon.com or this webpage.

The urban regeneration of Barrio Antiguo in Monterrey

 Updates to Geo-Mexico  Comments Off on The urban regeneration of Barrio Antiguo in Monterrey
Oct 142013
 

The city of Monterrey in Nuevo León has begun an urban regeneration scheme to rejuvenate one of its oldest sections, Barrio Antiguo (see map below).

Location of Barrio Antiguo, Monterrey.

Location of Barrio Antiguo, Monterrey. (Base: Google maps)

Barrio Antiguo is the area to the east of the Macroplaza. It is bounded to the south and east by Avenida Constitución, to the west by Calle Doctor Coss and to the north by Calle Padre Mier.

Earlier this year, city authorities, with assistance from the Nuevo León state government, published an online Catalog of Buildings of Historic and Artistic Importance in Barro Antiguo, which will form a basis for future planning decisions about any changes of land use in the area. [To view the entire catalog, scroll down in the center frame on that page.]

The Catalog includes a series of historic maps, from 1765, 1791, 1846, 1865, 1922, 1933 and 1947 respectively, as well as modern maps showing the location of all individual properties in Barrio Antiguo, color-coded to show their importance in terms of conservation and restoration efforts.

Conservation value of buildings in Barrio Antiguo, Monterrey

Conservation value of buildings in Barrio Antiguo, Monterrey (green=high, yellow=medium; red=low; white=no value)

The first phase of the urban regeneration scheme (called “Nuevo Barrio Antiguo”) includes a “paint job” in which all the buildings in the Barrio’s 16 blocks (manzanas) will be repainted in pastel colors. Owners can choose from a palette of pastel colors that has been predetermined as being in keeping with the historic and architectural characteristics of the area. Click here for the approved colors, complete with color swatches, and the matching paint names for different manufacturers.

During the first phase, new street signs will be installed, as well as tiles highlighting associations to famous people who lived or worked in the Barrio Antiguo. A second phase will restore sidewalks, add new street lighting, and involve public consultation about creating cultural and recreational space. Some streets would also be pedestrianized. Planners would seek to ensure that a wide mix of land uses is retained in the area, including residential, and that the area becomes attractive to visitors and tourists. The accessibility of Barrio Antiguo would be boosted if (or when) Line 3 of the city’s Metro system is built, since its proposed route would start near Barrio Antiguo and run 7.5 kilometers to the Metropolitan Hospital.

Barrio Antiguo, Monterrey

Barrio Antiguo, Monterrey

The Catalog identifies 193 buildings from the 18th, 19th and 20th centuries as being worth preserving, and the catalog entries for individual buildings provide a cross-reference to other listings of historic buildings such as those previously compiled by the National Anthropology and History Institute (INAH) and state-level agencies. The oldest building in Barrio Antiguo apparently dates back to 1765, while La Casa del Campesino incorporates parts of an even earlier building (from 1728). The listed buildings cover a range of architectural styles ranging from what is described as “vernacular north-eastern architecture” to neoclassic and art deco.

As Monterrey has grown, the condition of Barrio Antiguo’s building stock has deteriorated significantly. During the 1990s and 2000s, many buildings were turned into twilight zone businesses such as cafes, bars and nightclubs. La Casa del Campesino has been repeatedly re-purposed over the years, serving at different times as a government building, charity, hospital, and even a short-term emergency shelter following severe floods in 1909.

Not everyone is happy about the regeneration plans. Critics are vocal about the potential interruption to commerce and small businesses, and fear that it will attract land speculators.

In addition, this is not the first time that plans have been hatched to regenerate Barrio Antiguo. Grandiose plans have been announced on several previous occasions but have never come to fruition.

Housing policy in Monterrey

This 2008 paper by Dr. Peter Ward provides an excellent introduction to housing policy in Monterrey Metropolitan Area:

Related posts:

The geography of gold mining in Mexico

 Updates to Geo-Mexico  Comments Off on The geography of gold mining in Mexico
Sep 122013
 

Production of gold has more than tripled from the 23.5 metric tons recorded in 2000 to 88.6 metric tons in 2012, 3.2% of world production, 5.3% more than the previous year, and the ninth consecutive year-on-year increase. Analysts believe that gold production will double again between now and 2020.

Mexico is the world’s 11th largest producer of gold, well behind China (13% of world total), Australia (10%)  the USA (9%) and Russia (7%). Mexico exports gold, mainly to the USA and Switzerland.

The vast majority of gold and silver production in Mexico comes from a handful of major corporations, led by Canadian mining firm Goldcorp, whose main mines are at Los Filos (Guerrero) and Peñasquito (Zacatecas).

Gold production in Mexico, 2011. Data: INEGI. Credit: Tony Burton/Geo-Mexico

Gold production in Mexico, 2011. Data: INEGI. Credit: Tony Burton/Geo-Mexico

The map shows the six main gold mining states in Mexico. Production in Sonora has grown rapidly in the past decade and that state is now responsible for 32% of national production, ahead of Zacatecas (20%), Chihuahua (15%), Guerrero (13%), Durango (9%) and San Luis Potosí (7%).

The main gold-mining municipalities in each of these six states are:

  • Sonora: Caborca, Sahuaripa, Santa Ana, Álamos, Altar and Trincheras
  • Zacatecas: Mazapil, Luis Moya, Ojocaliente, Fresnillo and Concepción del Oro
  • Chihuahua: Urique, Chinipas, Ocampo, Madera
  • Guerrero: Eduardo Neri and Coyuca de Catalán
  • Durango: Santiago Papasquiaro and San Dimas
  • San Luis Potosí: Villa de la Paz

We will explore the controversy surrounding Goldcorp’s Los Filos opencast mine in Guerrero, billed as Latin America’s largest gold mine development, and some other mining controversies in Mexico, in a future post.

Mining towns described briefly previously on Geo-Mexico.com include:

Related posts:

The impact of immigrants on U.S. public budgets

 Updates to Geo-Mexico  Comments Off on The impact of immigrants on U.S. public budgets
Sep 052013
 

As the US Congress debates new immigration reform legislation there is considerable confusion concerning the fiscal impact of immigrants. One side argues that immigrants pay relatively little in taxes and absorb costly benefits in terms of public health, education, welfare, etc. Others note that immigrants often pay significant amounts in taxes and get little back in terms of benefits. Obviously, it depends on the immigrant and perhaps on their legal status.

OECD-migrationIn June 2013, the OECD published “International Migration Outlook,” a study on the budgetary impacts of immigrants to OECD countries. (OECD countries Mexico and 29 other mostly rich and mainly European countries). The study compares native-born with foreign-born residents, some of whom may have already become citizens. The study suggests that immigrants may have a slightly positive impact on fiscal budgets. The average for all OECD countries was 0.3% of GDP; the comparable figure for the USA was 0.03%.

Immigrants tend to have lower incomes, pay a bit less in taxes, but receive less in benefits. They tend to be younger and thus receive less in public health benefits. If they have children, they receive considerable education benefits. Obviously these are gross generalizations as some immigrants are highly paid executives and scientists, who pay significant taxes, while others may work as domestics or laborers, paying far less in taxes. Given that many public costs, including defense and debt service, are very hard to allocate to migrants versus native-born, the study suggests that immigration appears to be neither a drain nor a gain on fiscal budgets.

A big issue in the USA is the specific impact of Mexican immigrants on the fiscal budget, particularly the impacts of undocumented immigrants. Many legal immigrants from Mexico are family members joining their relatives. They may or may not be employed and thus may not pay income taxes. On the other hand, virtually all illegal immigrants seek employment. Furthermore, many obtain formal sector jobs by using fake Social Security cards or “Individual Tax Identification Numbers.” Their employers deduct federal and state income tax from their paychecks and forward these funds to government tax agencies.

Undocumented immigrants rarely file tax returns and thus very rarely receive the tax refunds to which they might otherwise be entitled. All immigrants pay considerable amounts in gasoline and sales taxes as well as property taxes, either directly or indirectly as part of their rent. Given that most illegal immigrants are rather young, relatively healthy and without children, they may have only a small impact on public education and health expenses. Their children are often born in the US, are US citizens, and should not be considered immigrants. It appears that undocumented immigrants might be paying more into the public coffers than they receive in benefits. A closer look at the data may provide some answers.

A 2007 study by the US Congressional Budget Office (CBO) entitled “The Impact of Unauthorized Immigrants on the Budgets of State and Local Governments” directly addressed this issue. The study notes that at the Federal level roughly 50% of illegal immigrants pay income or payroll taxes, which include Medicare taxes. But they generally are excluded from such Federal benefits as Social Security pensions, Medicare and Medicaid (other than emergency services), Food Stamps, and Assistance to Needy Families. The data suggest that in general illegal immigrants usually pay more in federal taxes than they receive in benefits. On the other hand, a number of court cases mandate that state and local governments cannot withhold from illegal immigrants certain services such as education, selected health care, or law enforcement. Many illegal immigrant children do not speak English; therefore their education may be more costly.

In assessing the fiscal impact on state and local government budget, the CBO analyzed 29 reports published since 1990. The study noted that undertaking such an analysis is very challenging and involves many big assumptions. Still the CBO analysis concluded that the relatively small amount spent by state and local governments on services for illegal immigrants is not fully offset by the even smaller amount of tax revenues collected from them including federal revenues they may receive for this purpose.

In conclusion, available research suggests that the impact of immigrants on public budgets is not very clear. With respect to all immigrants, there appears to a slight positive fiscal impact according to a recent OECD study. The older CBO analysis indicates that undocumented immigrants appear to have a positive impact of the federal budget, but a negative fiscal impact for state and local governments. Of course, the impact varies enormously among migrants depending on their incomes, tax brackets, consumption patterns and needs.

Related posts:

Mexico’s position among the most populous countries to 2100

 Updates to Geo-Mexico  Comments Off on Mexico’s position among the most populous countries to 2100
Aug 122013
 

How does Mexico compare with the world’s most populous countries? Available information suggests that in 1500, before the Spaniards arrived, the population of the area that is now Mexico was roughly 15 to 20 million (McCaa 1997). At that time Mexico may have been the third most populous country behind only China and India. However, by 1600 the population had crashed to about 1.6 million, one of the most dramatic population collapses in human history. Mexico did not regain its pre-Columbian population level until about 1900. But the population declined by about 6% during the Mexican Revolution, 1910-1920.

Children in Zitácuaro, Michoacán. Photo: Tony Burton. All rights reserved.

Photo: Tony Burton. All rights reserved.

A recently published UN study, World Population Prospects, The 2012 Revision, enables us to compare Mexico’s population with that of other countries for 1950, 2013, 2050 and 2100. Slow but steady growth brought Mexico’s population up to 28 million by 1950, ranking Mexico 16th just ahead of Spain and right behind the Ukraine. Very rapid growth peaking in the 1970s increased Mexico’s population to about 120 million by 2013. [The UN report quotes Mexico’s 2013 population as 122 million, whereas Mexico’s CONAPO (National Population Commission) estimates the current population is 118.4 million, the difference perhaps due to differing assumptions about international migration.]

This ranked Mexico 11th in the world just behind Japan, but ahead of the Philippines. [The 15 most populous countries in 2013 are China (1,386m), India (1,252m), USA (320m), Indonesia (250m), Brazil (200m), Pakistan (182m), Nigeria (174m), Russia (143m), Japan (127m), Mexico (122m), Philippines (98m), Ethiopia 94m), Vietnam (92m) and Germany (83m)]

By 2020, Mexico will pass Japan to become 10th, the highest it will ever rank except for during the pre-Columbian era.

The UN study forecasts that the Mexican population will grow to 156 million by 2050. This is considerably higher that the Mexico’s National Population Commission (CONAPO) forecast, which uses higher rates of out-migration. In 2050 Mexico will be back in 11th place, having jumped ahead of Russia, but having been passed by Ethiopia and the Philippines. According to the UN study by 2050 India will have passed China, and Nigeria will have replaced the USA as the 3rd most populous.

By 2100 Mexico’s population will be down to 140 million, putting it in 16th place behind Nigeria and five other very rapidly growing African countries: Tanzania, Congo, Uganda, Niger and Kenya. Interestingly, between 2050 and 2100 all of the 31 largest countries are expected to lose population except the USA, the Philippines, and 12 African countries. The world’s total population will have essentially leveled off by 2100 at about 10.9 billion with African countries continuing to grow while European and Asian countries experience population declines. Of course many unexpected demographic changes may occur between now and 2100.

According to the study, Mexico’s life expectancy at birth will be 90.0 years in 2100, above the USA’s level of 88.8 years, but behind Canada at 91.2 years. Mexico’s total fertility rate is forecast by the UN at 1.99 children per women in 2100 which is considerably higher than rates forecast by Mexico’s CONAPO and other demographers.

Reference:

Robert McCaa, Robert. 1997. “The Peopling of Mexico from Origins to Revolution”, preliminary draft for Richard Steckel & Michael Haines (eds.), The Population History of North America, Cambridge University Press, 1997.

Related posts:

Has the homicide rate in Mexico begun to fall?

 Mexico's geography in the Press, Updates to Geo-Mexico  Comments Off on Has the homicide rate in Mexico begun to fall?
Aug 102013
 

The National Statistics Institute (INEGI) recently published state-by-state intentional homicide (murder) statistics for 2012. The values calculated by INEGI for rates/100,000 population rely on CONAPO’s estimates for the population each year. The INEGI report includes homicide trends from 1990 to 2012.

From 1992 to about 2007, homicide rates in Mexico declined (see graphic) to 8/100,000 in 2007. However, during former President Felipe Calderón’s “War on Drugs”, the homicide rate almost tripled. In 2010 and 2011, the national rate averaged 23/100,0000. These national averages mask a huge difference between males and females. For example, the 2011 rate for males was 43/100,000, about eight times higher than the 5/100,000 recorded for females. As the graphic shows, there is some slight evidence that the homicide rate for males is beginning to fall again.

Trends in homicide rate, 1990-2012 (Data: INEGI)

Trends in homicide rate, 1990-2012 (Data: INEGI)

Mexico’s intentional homicide rate is about the same as that in Brazil (21/100,000). Both countries have rates that are very high compared to Peru (10), the USA (5), Canada (1.6) or the UK (1.2). On the other hand, the intentional homicide rates in Mexico and Brazil are quite low compared to Honduras (92), El Salvador (69) Venezuela (45) and South Africa (32). [Figures for other countries from wikipedia]

In a later post we will look at the pattern of homicides in 2012, and compare a map of homicide rates in 2012 to our previous analysis of the homicide pattern in 2010:

Aug 052013
 

A recent study published by the Clean Air Institute analyzed air pollution in 22 Latin American cities:

  • Air Quality in Latin America: An Overview (May 2013; pdf file)

Six Mexican cities were included in the study: Mexico City, Guadalajara, Monterrey, Puebla, Ciudad Juárez and León. However, only limited data were available for Puebla, Cd. Juárez and León. One of the main conclusions of the study is that Mexico has about the worst urban air pollution in Latin America. It is believed to be responsible for about 15,000 deaths in Mexico each year.

The focus was on the following air pollutants:

  1. Particulate matter is divided into two measures; particles less 2.5 microns in diameter (PM2.5) and those less than 10 microns (PM10). PM2.5 pollution is extremely harmful because it penetrates deep into lungs causing inflammation and worsening heart and lung diseases. This can be fatal.
  2. Ozone is formed in the air when oxides of nitrogen and volatile organic compounds mix with intense sunlight. The very intense sunlight in Mexican cities makes them particularly prone to ozone pollution.
  3. Nitrogen dioxide (NO2) is caused by high temperature combustion of fossil fuels in vehicles, factories and power plants. It can aggravate lung diseases as well as contribute to ozone and fine particle pollution.
  4. Sulfur dioxide (SO2), which also comes from burning fossil fuels, contributes to heart and respiratory disease. Unfortunately, not all of the 22 cities had data on all four pollutants. Consequently comparisons among cities are a bit limited.

According to the study, Mexican cities had some of the worst urban particulate pollution in Latin America, significantly above WHO standards. Of the 16 cities with data, Monterrey had by far the worst PM10 pollution with 85.9 micrograms per cubic meter (ug/m3); considerably worse than the perennially dusty Lima with 62.2 ug/m3. Guadalajara came second with 70.1 ug/m3, Mexico City was 6th with 57.0 ug/m3, and León placed 11th with 39.0 ug/m3, even worse than Sao Paulo at 36.5 ug/m3. Though not in the study, Mexicali has worse PM10 pollution than Monterrey. Also Monterrey’s PM10 levels are much better than many major world cities including Cairo, Delhi, Kolkata, Beijing, Chengdu, Bangalore, Shanghai, Dacca, Jakarta, and Karachi.

Mexico City air quality in 1980 (Photo: Tony Burton)

Mexico City air quality in 1980 (Photo: Tony Burton)

Mexico did a bit better with respect to the more serious PM2.5. Of the 11 cities with data, Bogota was worst with 35.1 ug/m3 followed by Lima at 31.5ug/m3 and San Salvador and Montevideo at 28.0 ug/m3. The two Mexican cities with data, Mexico City (26.2 ug/m3) and Monterrey (25.9 ug/m3) were 6th and 8th.

Mexican cities also have some of the highest levels of ozone pollution. Of the ten cities with data, five of the six worst were Mexican cities. Guadalajara had the highest ozone pollution with 69.3 25.9 ug/m3 followed closely by León 68.9 at ug/m3. Mexico City was 4th (59.4 ug/m3); Monterrey was 5th (55.2 ug/m3); and Cd. Juárez came 6th (46.3 ug/m3), just ahead of Quito (44.1). Much better ozone levels were recorded by Sao Paulo (36.0 ug/m3), Santiago (28.8 ug/m3) and Bogota (21.1 ug/m3).

Cities in Mexico also had high levels of nitrogen dioxide. The highest levels were in Montevideo (70.0 ug/m3), but Guadalajara (57.2ug/m3), Mexico City (54.2 ug/m3) and León (45.5 ug/m3) placed 2nd, 3rd and 4th worst among the 14 cities with data. Monterrey was much better with the third lowest nitrogen oxide level (29.0 ug/m3), trailing only Lima (12.8 ug/m3) and Quito (23.3 ug/m3).

Mexican cities were also among the worst in terms of sulfur dioxide pollution. Of the 13 cities with data, León had by far the highest level with (23.4 ug/m3), followed by Medellin (16.0 ug/m3). Mexico City was 3rd worst (15.3 ug/m3); Monterrey was 4th (13.1 ug/m3); and Guadalajara was 6th (8.6 ug/m3).

In summary, the study indicates that Mexico has about the worst urban air pollution in Latin America. Fortunately, Mexico City, which used to be considered one of the most polluted cities in the world, has significantly improved its air quality in the last few decades. (see Rhoda and Burton, Geo-Mexico: The geography and dynamics of modern Mexico, p 177)

On the other hand, other major cities in Mexico have not had the same experience. The data in this study appear to suggest that among Mexico’s three biggest cities, Guadalajara has the worst air pollution followed by Mexico City and then Monterrey. (This study found insufficient data for comparisons with Puebla, Cd. Juárez and León.)

Other posts on urban air pollution:

Jul 152013
 

More than a year ago, the World Trade Organization (WTO) sided with Mexico and appeared to finally bring to an end a long-running dispute between Mexico and the USA over “dolphin-safe” tuna. The WTO decision confirmed that the methods used by Mexico’s tuna fishing fleet met the highest international standards, not only for protecting dolphins but also for conserving other marine species.

Dolphin-safe-logoThe USA has now responded by strengthening the rules governing the use of “dolphin safe”, a label first established in 1990. According to Mexican officials, the changes effectively circumvent the WTO decision by establishing two distinct regulatory regimes, one for the Tropical Eastern Pacific Ocean area (where the Mexican tuna fleet operates) and another, much less restrictive, for all other regions.

Mexican officials argue that the second regime, which does not include independent observers, has been unilaterally established by the USA in order to protect its own tuna fleet which uses methods that are not environmentally sound.

Part of the conflict over “dolphin safe” tuna revolved around the very different methods of fishing employed in the two countries. Mexican tuna fishermen use the encirclement method which involves locating tuna by chasing dolphins that swim with the tuna schools. Large purse seine nets are then employed to scoop up the fish. Decades ago, this method did indeed result in many dolphins being caught as bycatch. This led to justifiable outrage from environmentalists and the “dolphin safe” system. It quickly led to Mexico’s fleets employing specially-adapted nets and changes in procedure to ensure that any dolphins accidentally trapped can escape or are released and returned (alive) back to the ocean. According to the best available data, these improvements quickly reduced dolphin bycatch to close to zero.

Most US tuna fishermen, on the other hand, rely on either long-line fishing, in which every species hooked is killed, or employ fish aggregating devices to encourage the tuna to school. Both methods used by US tuna fisherman kill many immature tuna as well as numerous other species, including sharks and marine turtles (especially the critically endangered Pacific leatherback turtles), as well as seabirds (especially albatrosses and petrels).

The WTO agrees with Mexico that the method used by its tuna fleet is the most sustainable of those permitted by the International Dolphin Protection Program, and protects not only dolphins but also avoids the bycatch of juvenile tuna, ensuring the long-term viability of the tuna fishing industry.

The WTO resolution appeared to finally end this acrimonious dispute which had begun thirty years ago and included a US embargo against Mexican tuna which lasted for more than a decade. It meant that Mexico’s tuna fishermen could legally stamp “dolphin-safe” on their exports to the USA, the world’s largest tuna importer, certifying that the tuna had been caught in full compliance with the International Dolphin Protection Program. The revised US rules mean that most Mexican-caught tuna will still not qualify for the “dolphin safe” label.

Mexico’s tuna catch (mainly yellowfin tuna) peaked at 166,000 tons in 2003 when more than 20,000 tons were exported, mainly to Spain, and has since declined to around 115,000 tons. About 20,000 families in Mexico depend on tuna fishing for their livelihood. This figure includes not only fishermen but also those working in associated processing and packing plants. Mexico’s 130-vessel tuna fleet is the largest in Latin America.

The USA-Mexico tuna war is a classic example of a cross-border fishing/trade dispute. The new US regulations mean that the ball is now firmly back in Mexico’s court. Mexican fishing officials were quick to criticize the new rules, but have not yet announced their next move in this long-running saga which looks set to rumble on for quite some time.

Want to find out more?

Related posts:

Recent trends for Mexicans living in the USA

 Updates to Geo-Mexico  Comments Off on Recent trends for Mexicans living in the USA
Jul 152013
 

The population of Mexican origin in the USA now totals more than 33.7 million, including 11.2 million born in Mexico and 22.3 million who identify themselves as being of Mexican origin. Mexicans account for 64% of all Hispanics in the USA and 11% of the country’s total population.The changing profile of Mexicans living in the USA.

A Pew Research Hispanic Center analysis of US Census data shows that the portion of the US population that is of Mexican origin is undergoing a gradual transformation. The average age of residents of Mexican origin is becoming younger and average education levels are on the rise. In 1990, only 25% of the Mexican migrants had a high school diploma, compared to 41% today. Even so, among Hispanics, Mexicans have the lowest rate of university education and the highest percentage of people without any health insurance.

Currently, 71% of the Mexicans who live in the USA have lived in the country from more than 10 years, compared to around 50% in 1990. The proportion of migrants that is male fell slightly from 55% in 1990 to 53% in 2010.

The average household income of households with at least one member of Mexican origin was $38,884, compared to a USA-wide average of $50,502. About 49% of families of Mexican origin own their own homes, compared to a 64.6% rate for the USA as a whole.

In terms of jobs, 26.7% of people of Mexican origin living in the USA work in services, 21.1% in sales positions or offices, 18% in transportation, 17.8% in construction, and 16.4% in administration, business, science and the arts

Related posts:

Mexico and the Happy Planet Index

 Excerpts from Geo-Mexico, Updates to Geo-Mexico  Comments Off on Mexico and the Happy Planet Index
Jun 202013
 

Chapter 30 of Geo-Mexico, the geography and dynamics of modern Mexico includes a look at the Happy Planet Index (HPI). The HPI is a compound index that combines three measures:

  • life expectancy
  • life satisfaction
  • ecological footprint

In essence, the HPI shows how successfully people are achieving the good life without having to consume a disproportionate share of the Earth’s resources. The unbridled global pursuit of economic growth over the past fifty years has left more than a billion people in dire poverty. Far from bringing economic stability, it has encouraged the rampant abuse of resources while increasing the very real risks of unpredictable global climate change.

The HPI attempts to quantify an alternative vision of progress where people strive for happy and healthy lives alongside ecological efficiency in how they use resources. A high HPI score is only possible if a country is close to meeting the targets for all three components.

Environmental Sustainability Index and Happy Planet Index for selected countries. (Geo-Mexico. Figure 30.4) All rights reserved.

Environmental Sustainability Index and Happy Planet Index for selected countries. (Geo-Mexico. Figure 30.4) All rights reserved.

HPI scores (see graph) paint a very different picture to that suggested by either the ecological footprint or the Environmental Sustainability Index (ESI). While happy and healthy lives often go hand in hand, many countries with high values for those components (such as the USA and Canada) have disappointingly high ecological footprints, and end up with low HPI scores. The lowest HPI scores of all are found in sub-Saharan Africa where several countries do badly on all three components.

At the other end of the scale, nine of the top ten HPI scores are for countries in Latin America and the Caribbean where relatively high life expectancy and high personal lifestyle satisfaction is combined with modest footprints. Mexico ranks 22nd of the 151 countries studied, behind Argentina and Guatemala but well ahead of the UK, Canada and the USA.

Life expectancy

The life expectancy figure for each country was taken from the 2011 UNDP Human Development Report and reflects the number of years an infant born in that country could expect to live if prevailing patterns of age-specific mortality rates at the time of birth in the country stay the same throughout the infant’s life.

Mexico’s life expectancy is 77.0 and ranks #36 among the 151 countries analyzed. This is below the USA, which has a life expectancy of 78.4, but higher than Malaysia, which has a life expectancy of 74.2.

Life satisfaction

The data for life satisfaction (experienced well-being) draws on responses to the ladder of life question in the Gallup World Poll, which was asked to samples of around 1000 individuals aged 15 or over in each of the countries included in the Happy Planet Index.

Mexico’s experienced well-being score is 6.8 out of a possible 10. This is lower than the average level of experienced well-being in the USA (7.16), but higher than that of Germany (6.72).

Ecological footprint

Ecological Footprint is a metric of human demand on nature, used widely by NGOs, the UN and several national governments. It measures the amount of land required to sustain a country’s consumption patterns. For a majority of the countries (142 of the 151), Ecological Footprint data were obtained from the 2011 Edition of Global Footprint Network National Footprints Accounts. For the nine other countries, Ecological Footprint figures were estimated using predictive econometric models.

Mexico’s Ecological Footprint is 3.30 global hectares per capita. If everyone in the world had the same Ecological Footprint as the average citizen of Mexico, the world’s Ecological Footprint would be 20% larger and we would need to reduce our Ecological Footprints by around 80% in order to stay within sustainable environmental limits.

Summary

In summary, countries often considered to be ‘developed’ are some of the worst-performing in terms of sustainable well-being.

Unfortunately, given that the HPI scores for the world’s three largest countries (China, India, and the USA) all declined between 1990 and 2005, it does not seem that the situation is improving or will improve any time soon. Business as usual is literally costing us the Earth.

Related posts:

How can Mexico City find sufficient water?

 Updates to Geo-Mexico  Comments Off on How can Mexico City find sufficient water?
May 202013
 

What happens if or when Mexico City needs more water than it is using at present? There are several options, depending on whether authorities choose to modify demand, supply, or both in order to improve the future situation.

In terms of managing (reducing) demand, conservation measures are one possibility. Changing consumer habits may require not only educational programs, but also usage tariffs that reflect the true costs of supply, and that encourage consumers to install water-saving devices and introduce water-saving practices in their daily lives. Demand would also be reduced if less water was lost through leakage. As mentioned in a previous post, in 2009, the National Water Commission (Conagua) estimated that a staggering 40% of potable water nationwide was being lost through leaks in city and municipal systems, with a further 20% not properly accounted for due to billing errors and clandestine connections.

Managing demand may be easier to achieve than managing supply, given that recent efforts to increase supply have met with concerted opposition from environmentalists and the people living in the areas from which water would be transferred to the city. In the last half of the twentieth century, while one political party (PRI) held power, it was possible for politicians to largely ignore the conflicts resulting from inter-basin transfers, arguing that their “solutions” served a national need. Now that local, state and federal politics are more contested, that approach is potential political suicide.

From a political perspective, the most acceptable source of additional water for Mexico City would probably be the recently identified deep aquifer described in Mexico’s major cities confront serious water supply issues. However, that discovery requires further research before its maximum sustainable yield can be determined or it can be brought into service.

Less politically acceptable are the various proposals to bring water from elsewhere to satisfy the thirst of Mexico City. One of the most frequently voiced suggestions is to add a fourth phase to the Cutzamala scheme (see Where does Mexico City get its water from?) to increase the amount of water it supplies by more than 25% to 24 m³/s. In addition, the plan would provide treatment for 42 m3/s of wastewater. This fourth phase, known as the Temascaltepec project (see map), would require the construction of a 120-meter-high, 740-meter-long dam on the Temascaltepec River to create a reservoir with a capacity of 65 million m³.

Map of the Cutzamala project

Map of the Cutzamala project. Click to enlarge.

Aqueducts and a 19-km-long tunnel would carry the water to the Valle de Bravo reservoir. The estimated cost would be $500 million. The Temascaltepec project is opposed by environmentalists and locals and is not likely to get under way any time soon. The residents of the villages near the proposed dam site are afraid that the project would cause their local springs to dry up and would adversely impact their farming of maize, sugar cane, banana, tomato, melon and peas.

To the south of Mexico City, an entirely different proposal is to bring water from the Amacuzac, Tecolutla and Atoyac Rivers, by damming the Amacuzac River, creating a 67 km2 reservoir (between the states of Morelos, Guerrero and Puebla) capable of storing 4,000 million cubic meters. Supplying Mexico City would require a 160 km long aqueduct, and would involve pumping water to a height of 1825 meters, requiring up to 5% of Mexico’s annual national electricity production. On the plus side, this could reduce the future abstraction of groundwater by as much as 50 m³/s.

Related posts:

May 172013
 

Each year the United National Development Program (UNDP) publishes Human Development Index (HDI) scores and ranks for all countries with available data. The 2013 report, which is based on 2012 data, was just published. (Summary HDI 2013 Report: Rise of the South: Human Progress in a Diverse World)

The index takes account of three key development indicators:

  • Life expectancy at birth,
  • Literacy and school enrollment,
  • Gross National Income (GNI) per person (on a Purchasing Power Parity basis, which uses the total amount of goods and services produced in an economy, independent of exchange rates).

The HDI theoretically varies from 1.0 for the highest and 0.0 for the lowest. In the 2013 report, Norway is highest with a score of 0.955 while Congo and Niger are tied at rank 186 for lowest with scores of 0.304.

hdi-report-2013The latest report identifies Mexico along with 17 other countries that have made outstanding progress since 1990. This group of 18 includes none of the traditional industrialized countries. Those at the top of the progress list include South Korea, Chile, Mexico and Malaysia followed by such major countries as Brazil, Turkey, Thailand, China, Indonesia, India and Bangladesh. The HDI scores of all the world’s countries have improved significantly in the last 30 years; but the scores of non-western countries have increased spectacularly over this period.

While HDI scores receive considerable attention, the UNDP’s Inequality-Adjusted HDI or IHDI is a better overall measure because it is far less skewed by the extremely wealthy whose very high incomes push up the GNI per person values but do not adequately represent the development of the society as a whole. For example, the USA ranks third in HDI with a score of 0.937, due in part to the extreme wealth of its highest 1%. On the IHDI scale, the USA scores only 0.821 and ranks 16th.

Mexico’s HDI score is 0.775, but its IHDI score is of 0.593 is much lower because of the great inequality between the rich and poor in Mexico. In terms of IHDI, Mexico ranks 55th. This places Mexico well behind Chile (41st, 0.664), Argentina (43rd, 0.653) and Russia. (2012 data are not available for Russia, but 2011 data places it well ahead of Mexico.) On the other hand, Mexico’s IHDI score is ahead of Peru (62nd, 0.561), Turkey (63rd, 0.560), China (67th, 0.543), Brazil (70th, 0.531), Indonesia (79th, 0.514) and Egypt (0.503). Major countries that seriously trail this group include: India (91st, 0.392), Bangladesh (95th, 0.374), Pakistan (98th, 0.356), Kenya (102nd, 0.344), Nigeria (119th, 0.276) and Ethiopia (121st, 0.269).

The main conclusion is that the overall quality of life continues to improve rapidly in Mexico as well as in many other so-called developing countries. Current trends suggest these improvements will continue in the years ahead. The Congo, ranked 134, is last with a score of 0.172. IHDI scores are not available for many countries because they lack appropriate income distribution data.

Related posts:

Where does Mexico City get its water?

 Other, Updates to Geo-Mexico  Comments Off on Where does Mexico City get its water?
May 092013
 

Mexico City is one of the world’s largest cities, and the metropolitan area of Greater Mexico City (map) extends well beyond the borders of the Federal District (Mexico City proper) into neighboring states, especially the State of Mexico.  The total population of Greater Mexico City is about 22 million, all of whom need safe access to water.

An old joke relates how engineers initially rejoiced at successfully draining the former lake on which Mexico City was built (something the Aztecs had tried, but failed to achieve), only to discover that the city now lacked any reliable source of fresh water for its inhabitants (something the Aztecs had successfully managed by building a system of aqueducts). Water has been a major issue for Mexico City ever since it was founded almost 700 years ago.

The Mexico City Metropolitan Area’s water supply is currently calculated to be around 82 m³/s. (The precise figure is unclear because many wells are reportedly unregistered). The main sources of water (and their approximate contributions to total water supply) are:

  • Abstraction of groundwater (73%)
  • Cutzamala system (18%)
  • Lerma system (6%)
  • Rivers and springs (3%)

In several previous posts we have looked at several issues arising from groundwater abstraction:

In this post we focus on the Cutzamala system (see graphic), one of Mexico’s most ambitious engineering feats of its time.

Cutzamala scheme

Cutzamala scheme (click to enlarge). Source: IMTA (1987)

The Cutzamala system supplies potable water to 11 boroughs (delegaciones) of the Federal District and 11 municipalities in the State of Mexico. The Cutzamala system is one of the largest water supply systems in the world, in terms of both the total quantity of water supplied (about 485 million cubic meters/yr) and in terms of the 1100 meters (3600 feet) difference in elevation that has to be overcome. The system cost about $1.3 billion, and was undertaken in three successive phases of construction, completed in 1982 (Villa Victoria dam), 1985 (incorporation of the Valle de Bravo and El Bosque dams, originally built in the 1940s and 1950s) and 1993 respectively.

As Cecillia Tortajada points out in Who Has Access to Water? Case Study of Mexico City Metropolitan Area, the investment of $1.3 billion was, at the time (1996), “higher than the national investment in the entire public sector in Mexico… in the areas of education ($700 million), health and social security ($400 million), agriculture, livestock and rural development ($105 million), tourism ($50 million), and marine sector ($60 million).”

The system includes 7 dams and reservoirs for storage, 6 major pumping stations (P.P. on the graphic) and a water purification plant. The volumes stored in the system are dependent on previous years’ rainfall. Water is transferred to the Valley of Mexico from more than 150 km away via reservoirs, pumping stations, open channels, tunnels, pipelines and aqueducts.

The Cutzamala system incorporates the Valle de Bravo and El Bosque dams, built originally as part of the “Miguel Alemán” project that generated hydro-electric power from the headwaters of the Cutzamala River (hence the name for the whole system). The reservoir at Valle de Bravo is an important resource for tourism and watersports. The hydro-electric power scheme is no longer functioning. The Cutzamala system has the capacity to supply up to 19 m³/s of water to the Valley of Mexico. In practice, it supplies almost 20% of the Valley of Mexico’s total water supply (usually quoted as being 82 m³/s).

The pumping required to lift water 1100 meters from the lowest storage point to the system’s highest point (from where gravity flow takes over) consumes a significant amount of energy, variously estimated at between 1.3 and 1.8 terawatt hours a year, equivalent to about 0.6% of Mexico’s total energy consumption, and representing a cost of about 65 million dollars/yr. This amount of electricity is claimed to be roughly equivalent to the annual energy consumption of the metropolitan area of Puebla (population 2.7 million).

The total operational costs for running the Cutzamala System are estimated at $130 million/yr. [all figures in US dollars]. Even operating at full capacity (19 m³/s or 600 million m³/yr), the approximate average cost of water would be $0.214/m³. The true costs are higher given that these calculations do not include the costs of treatment or distribution within the metropolitan area. The price charged to consumers averages about $0.20/m³.

The completion of the Cutzamala system involved resettling some villages. The plans included the construction of some 200 “social” projects to improve living conditions for the people most affected, including local potable water distribution systems, schools and roads. However, more than a decade after completion, there were still some unresolved conflicts concerning people forced to move, with many of them still claiming that they had received insufficient compensation.

Maintaining the Cutzamala system has been an on-going challenge. Most maintenance is scheduled for the Easter holiday period, when factories and offices close down and many Mexico City residents head for the beach, reducing demand for water. Since 1993, a parallel system of canals and pipelines has been built alongside the original system, allowing for sections of the old system to be shut down for maintenance, obviating the need to close the entire system whenever work is carried out.

Main sources:

Related posts:

Apr 262013
 

An amendment to Mexico’s constitution in 2011 made access to potable water a basic human right, but Mexico’s major cities face unprecedented challenges in meeting future demands for drinking water. In this post we look at some of the water supply issues relating to Mexico City and Guadalajara.

In 2009, the National Water Commission (Conagua) estimated that a staggering 40% of potable water nationwide was being lost through leaks in city and municipal systems, with a further 20% not properly accounted for due to billing errors and clandestine connections. Conagua recently announced a new plan for Mexico City, that it hopes will safeguard that city’s water supply for the next 25 years. (OOSKAnews 18 April 2013)

The plan creates a new metropolitan decision-making body, which will be empowered to choose which sources of water will be used, set timelines and commitments, and monitor all activities carried out under the plan. Conagua head David Korenfeld said that establishing a single water management body for the entire metropolitan zone in the Valley of Mexico means that, “there exists no possibility of misinterpretation in collaboration”. At present, several different water management bodies have responsibility for different parts of the Metropolitan Area, which extends well beyond the boundaries of the Federal District (México D.F.) into the neighboring State of México (Estado de México).

Korenfeld argues that potable water prices must be related to the real costs of water production, system maintenance and service delivery, and that subsidies must be cut in order to achieve efficient, sustainable and equitable water management. According to Conagua data, water tariffs in the Valley of Mexico cover only  51% of the true costs of service provision.The new plan calls for the existing Cutzamala water system to be completely restructured, with an alternative channel created to bring water to the city.

sacm officeRamón Aguirre Díaz, the director of the Mexico City Water System (SACM) which would come under the new decision-making body, says that one of the main challenges is to ensure adequate water supply to the municipality of Iztapalapa. Iztapalapa is the most populous and fastest growing of the city districts, with over 90% of its territory urbanized. The SACM is suggesting a six-year, 150-million-dollar plan to resolve the situation, which would include waiving water charges for some areas where service has been poor and sporadic. Aguirre stressed the need for the government and society “to succeed in reducing water consumption and improve their habits”, saying that consumption needs to be cut by at least 30%.

Coincidentally, it is in Iztapalapa where the findings from several deep wells allowed Mexico City engineers and geologists to announce earlier this year that a 40-million-dollar study conducted over 18 months had identified a major new aquifer under Mexico City. The city has an average elevation of 2240 meters above sea level; the new aquifer, which could become a major new source of potable water, is located 2000 meters beneath the surface. The initial announcement claimed that the aquifer could supply as much as 80,000 liters of water a second.

Conagua officials cautioned that the potential usable flow of this aquifer still has to be confirmed and that it may take a further three years of research to establish the maximum sustainable yield.  The aquifer might indeed relieve Mexico City’s physical water scarcity (volumes of supply) at some point in the future, but it would not necessarily overcome the economic water scarcity (cost of supply) faced by many of its residents. (For more about economic water scarcity, see How fast is the ground sinking in Mexico City and what can be done about it?).

Frederick Mooser, arguably Mexico’s most distinguished geologist, was quoted in the press as saying that the indication of very large reserves of water below a depth of 1500 meters might well alleviate the continued need to extract water from aquifers closer to the surface, extraction that has caused so many problems for the city’s infrastructure. The major aquifer used currently lies at a depth of between 60 and 400 meters. There are about 630 wells in the Federal District alone; all are overexploited and have an average life expectancy of 30 years.

Mooser also pointed out that the results from the wells used to locate the new aquifer show that the area has considerable potential for geothermal power generation in the future.

Mexico’s second city, Guadalajara, also faces sever water management issues. According to a recent press report (OOSKAnews, 11 April 2013), Metropolitan Guadalajara loses 18% of its water through leaks in the supply system (a loss of around 41 million dollars in economic terms)

siapaAccording to an official from the city’s water utility, SIAPA, repairing ailing parts of the network (154 locations have been identified as “vulnerable”) could save most of the 4 million dollars a year currently being spent dealing with emergency repairs. However, the precise location of leaks is difficult to pinpoint because of a lack of metering equipment. In addition to the 18% lost through leaks, SIAPA believes another 12% goes unaccounted for as a result of clandestine connections and incorrect billing.

The biggest reason for leaks is the age of the system. Parts of the water supply networks in Mexico’s major cities are now over 70 years old. For example, in Guadalajara, more than 70% of the city’s 3458 km of main water supply lines is over 70 years old. Replacing the 2544 km of pipes older than 70 years would require investing around 300 million dollars, with a further 500 million dollars needed to upgrade the drainage system. SIAPA’s total investment in renewing and expanding systems is currently about 45 million dollars a year. The water firm is already said to be the most indebted decentralized public agency in the country, with debts of 240 million dollars.

Related posts:

Several major Mexican companies among the “Global Challengers”

 Updates to Geo-Mexico  Comments Off on Several major Mexican companies among the “Global Challengers”
Apr 192013
 

The Boston Consulting Group (BCG) periodically identifies 100 companies from rapidly developing economies as “global challengers.” (Bcgperspectives, “Introducing the 2013 BCG Global Challengers“).

BCG has identified 100 companies for this list in 2006, 2008, 2009, 2011 and 2013. They focus on companies in developing Asia (excluding Japan, South Korea, Taiwan, Hong Kong and Singapore), Eastern Europe, the Commonwealth of Independent States, the Middle East, Latin America, and Africa. Companies considered for the list must have annual revenues of at least $1 billion, overseas revenues at least 10% of total revenues or $500 million, and be focused on building a truly global footprint.

The biggest emerging economies have dominated. In 2006 the list included 44 Chinese companies, 21 Indian companies and 12 from Brazil. Russia was next with seven followed by Mexico with six. The dominance of the big three declined from 77 in 2006 to 63 in 2013. One reason for this is that some of the countries on the list “graduated” from the challengers list to become full global competitors.

In 2013, China led with 30 companies, followed by India with 20 and Brazil with 13. Mexico was 4th with seven companies, followed by Russia with six, South Africa with five, Thailand with four and Turkey with three. Countries with two companies on the list are Chile, Malaysia, and Saudi Arabia. Those with one company on the list are Argentina, Colombia, Egypt, Qatar and United Arab Emirates.

The seven Mexican companies in the group are Alfa, American Movil, FEMSA, Gruma, Grupo Bimbo, Mabe, and Mexichem. One Mexican company, Cemex, has “graduated” from the “challengers” list. It is the world’s largest building materials supplier and 3rd largest cement maker. Cemex now operates in 50 countries on six continents and is the leading cement seller in the USA. Revenues in 2012 were $15 billion.

ALFA is the world’s leading manufacturer of high-tech aluminum engine heads and blocks through its subsidiary Nemak. Its other major subsidiaries are Alpek (petrochemicals), Sigma Alimntos (foods) and Alestra (electronics and telecommunications). Revenues in 2012 were $15 billion.

América Móvil. operates Telmex and Telcel, the world’s fourth largest cell phone operator with 160,000 employees and over 250 million subscribers mostly in Latin America and the USA. Its revenues in 2012 were $59 billion. It is a candidate to graduate from this “challengers” group in the near future.

Gruma is the world’s largest producer of corn flour and tortillas. It has subsidiaries in the USA, China, UK, and Latin America. Revenues in 2012 were $5 billion.

FEMSA, based in Monterrey, is the world’s largest bottler of Coca-Cola. FEMSA also operates OXXO, the largest convenience store chain in Latin America. Revenues in 2012 were $18 billion.

Grupo Bimbo is the world’s largest bread maker and the biggest bread seller in the USA. Among its 100 brands are Arnold’s, Entenmann’s, Thomas’s English Muffins, and Sara Lee fresh baked products. Bimbo is the world’s 4th largest food company behind only Nestle, Kraft, and Unilever. Revenues in 2012 were $13 billion.

Mabe. is a leader in the production of large household appliances such as stoves, refrigerators, washers, dryers, etc. These are sold in 70 countries under the General Electric and Mabe brand names. It controls 70% of the market in Latin America. Revenues in 2012 were $4 billion.

Mexichem is a chemical company that operates throughout the Americas as well as in Europe and Asia. It exports to more than 50 countries, has over 10,000 employees, and earns over $4 billion annually.

Related posts

Mexico has the world’s highest level of energy security among large economies

 Mexico's geography in the Press, Updates to Geo-Mexico  Comments Off on Mexico has the world’s highest level of energy security among large economies
Apr 042013
 

According to a recently published U.S. Chamber of Commerce study of the largest energy-consuming nations, Mexico is the most energy secure country of the 25 countries in the large energy user group with a score 14% below the OECD average (see graph).

energy security graph (US Congress)

The study compiled an “International Index of Energy Security Risk”, taking into account 28 metrics including fossil-fuel imports, power generation and carbon-dioxide emissions, using data from sources such as the U.S. Energy Information Administration and the Paris-based International Energy Administration.

Other countries with high levels of energy security included the U.K., Norway, New Zealand, Denmark, Australia and the U.S. (Which tanked 7th overall. Energy security was lowest in the Ukraine, followed by Thailand, South Korea, the Netherlands, Brazil, Italy, Turkey and Japan.

Mexico’s energy security has ranked as first or second among the large energy user group of countries every year since 1980. The metrics where Mexico has a significant comparative advantage over other OECD members include:

  • low amount it spends on fuel imports per dollar of GDP generated
  • low energy expenditures per dollar of GDP and per capita are also lower
  • low costs to produce electricity.
  • low amount of energy each person uses, both overall and in the transport sector
  • low amount of carbon dioxide each person emits

As the graph shows, however, Mexico’s energy security is edging closer to that of OECD countries, meaning that Mexico’s comparative advantage in energy security is slowly shrinking.

Mexico is the world’s seventh largest oil producer, and also a major oil exporter. While production levels had been declining, they have begun to rise again in recent months. Mexico also has large reserves of natural gas, but these have not been developed quickly enough to prevent imports of natural gas from rising sharply in recent years as demand for natural gas outstrips domestic supply.

Related posts:

Popocatapetl Volcano and Colima Volcano continue to erupt

 Mexico's geography in the Press, Updates to Geo-Mexico  Comments Off on Popocatapetl Volcano and Colima Volcano continue to erupt
Mar 302013
 

In our series of brief updates on topics featured in previous Geo-Mexico posts, we look this week at the continuing eruption of two major volcanoes: Popocatapetl Volcano (between Mexico City and Puebla) and Colima Volcano (on the Jalisco-Colima state border in western Mexico).

Popocatepetl, 30 July 2012

Popocatepetl, 30 July 2012

Since our previous post, about a year ago, entitled Alert level rises as Popocatepetl volcano starts to erupt, Popocatapetl Volcano (photo) has continued to be active, with up to 250 activity events a day. The alert level has been reduced slightly to Yellow Phase 2, the fourth highest level. This level indicates intermediate scale explosive activity and possible expulsion of lava, explosions of increasing intensity and wind-blown ash falling on nearby villages. The volcano is monitored daily, and updates from CENAPRED  (in Spanish and English) are issued every 24 hours.

The report issued on 27 March is typical of recent months. In the previous 24 hours, there were 83 low intensity events with emissions of gas, water vapor and ash. The two largest events sent material rising 1000 meters and 600 meters into the atmosphere respectively, before the wind blew the material north eastwards (away from Mexico City).

Colima Volcano

In January 2013, we reported how Colima Volcano erupts, destroying lava dome first created in 2007. The volcano has continued to erupt in the ten weeks since then. The experts monitoring the volcano have reported up to 200 eruptive events a day, with numerous minor emissions of lava. Local villagers have been asked to remain on alert, though the experts are not yet calling for any villages to be evacuated.

The image below (source: Nasa Earth Observatory) shows Colima Volcano in 2010, part way into its current eruptive phase which is expected to last several years. The image shows the evidence at that time of four different types of volcanic activity:

  • lava dome growth
  • explosive eruptions
  • flank collapse
  • lava flows.

(Note that the 2013 eruptions have significantly altered the top of the volcano since this image was taken).

Nasa Earth Observatory)

Colima Volcano in 2010 (Nasa Earth Observatory)

Related posts:

The world’s richest man is one of 15 Mexican billionaires on 2013 Forbes list

 Updates to Geo-Mexico  Comments Off on The world’s richest man is one of 15 Mexican billionaires on 2013 Forbes list
Mar 072013
 

The 2013 Forbes list of the world’s billionaires shows that the world’s 1,426 billionaires (an all-time high) share a record net worth of $5.4 trillion. The four countries with most billionaires are the USA (442), China (122), Russia (110) and Germany (58).

Fifteen Mexican individuals or families make the 2013 list, also a record number. The fifteen super-rich Mexicans are:

World rank / Name / Estimated wealth according to Forbes / Main business interests

#1 Carlos Slim Helú and family, $73.0 billion, making him the richest man in the world. Fixed line telephone provider Telmex, cell phone provider América Móvil, Grupo Carso, Inbursa. [Slim Helú remains the world’s richest man for the fourth consecutive year]

#32 Alberto Bailleres González and family, $18.2 billion. Mining giant Peñoles, department store El Palacio de Hierro and Grupo Profuturo.

#40 Germán Larrea Mota Velasco and family, $16.7 billion. Grupo México –mining for copper and other minerals, railways.

#111 Ricardo Salinas Pliego and family, $9.9 billion. Television company Televisón Azteca, domestic appliance store Elektra, bank Banco Azteca, and cell phone company Iusacell.

#179 Eva Gonda Rivera and family, $6.6 billion, soft drinks (FEMSA)

#248 Maria Asunción Aramburuzabala and family, $5 billion, beer (Grupo Modelo)

#329 Jerónimo Arango and family, 4 billion dollars. Founder of Aurrerá supermarket chain and Grupo Cifra which controlled VIPS and El Portón restaurant chains, Suburbia department stores and tourist developments in Baja California Peninsula and Acapulco

#589 Emilio Azcárraga, $2.5 billion. Television and media conglomerate Televisa, and Nextel cell phones

#613 Rufino Vigil González, $2.4 billion; steel (Industrias CH)

#641 José and Francisco Calderón Rojas (brothers), $2.3 billion, beverages (Coca-Cola Femsa)

#792 Carlos Hank Rhon and family, $1.9 billion, banking

#831 Roberto Hernández, $1.8 billion. Banker, one of main shareholders of Citigroup, and tourist developments in the Yucatán Peninsula

#974 Alfredo Harp Helú and family, $1.5 billion. Shareholder in Citibank, telecommunications firm Avantel

#1031 Max Michel Suberville, $1.4 billion, retail (Coca-Cola Femsa)

#1107 Juan Gallardo Thurlow, $1.3 billion, beverages (organización Cultiba)

Conspicuous by his absence from the list (for the first time in several years) is Joaquín Guzmán Loera (aka “El Chapo”) who Forbes has consistently claimed has a net worth of about $1 billion, but whose assets the magazine now declares “impossible to verify”. Guzmán Loera is Mexico’s most wanted man, head of the Sinaloa drugs cartel, the main supplier of cocaine to the US market.

The combined total wealth of these fifteen individuals is a staggering $148.5 billion (compared to an equivalent total of $125.1 billion in 2012). The 2013 figure is equivalent to more than 6% of Mexico’s GDP.

The average earnings of Mexican workers registered in IMSS (Mexico’s Social Security Institute) in 2012 was about 260 pesos ($20 dollars) a day. The combined wealth of Mexico’s fifteen richest individuals/families is therefore equivalent to the total annual salaries of more than 20 million Mexicans earning this average salary! Note that this equivalence has risen steadily over recent years. For example, in 2010 the combined wealth of Mexican billionaires was equivalent to “only” 14.3 million Mexicans earning the then average salary.

Clearly, there are a handful of extremely wealthy individuals living in Mexico, alongside millions of Mexicans who are living at or below the poverty line. These income disparities have existed for a very long time, and are examined in detail in chapter 14 of Geo-Mexico: the geography and dynamics of modern Mexico. That chapter also analyzes the spatial patterns of wealth in Mexico, and discusses whether the gap between rich and poor has widened or narrowed in recent years.

Chapter 29 discusses Gender inequities in Mexico and  Oportunidades, a poverty reduction program (links are to excerpts from that chapter).

Related articles:

Mexico’s population: now over 117 million and expected to peak at about 138 million

 Updates to Geo-Mexico  Comments Off on Mexico’s population: now over 117 million and expected to peak at about 138 million
Feb 282013
 

Mexico’s population in January 2013 was 117.4 million; 57.3 million males (48.8%) and 60.1million (51.2%) females according to a December 10, 2012 report by CONAPO (Consejo Nacional de Población) in Proyecciones de la población de México 2010-2050”. By January 2014 it will grow by over a million to 118.6 million. However demographic trends indicate that population growth in Mexico is declining significantly.

The birth rate is expected to fall from 19.7 births per 1,000 population in 2010 to 14.0 in 2050. As the Mexican population ages the death rate is projected to increase from 5.6 per 1,000 in 2010 to 9.2 in 2050. Consequently the annual rate of natural population growth is expected to decline from 1.41% in 2010 to 0.48% in 2050. Extrapolating the trends from the CONAPO projection suggests that death rates will surpass birth rates sometime in the by 2070s and natural population change will become negative. Of course, we must also take emigration into account.

According to the CONAPO report net emigration from Mexico was 321,000 in 2012, though some have noted that due to the Great Recession net emigration to the USA is near zero or less [Pew Research Center’s “Net Migration from Mexico Falls to Zero – and Perhaps Less”]. CONAPO expects net emigration to peak at about 689,000 by 2020 and then gradually decline to 590,000 by 2050. Given the current low levels of emigration to the USA and the rapid growth of the Mexican economy, some feel that these levels are rather high.

As a result of trends in birth rates, death rates and emigration, Mexico’s population growth rate is declining. Annual population growth is expected to fall below a million in 2017, below 500,000 in 2032 and below 100,000 by 2049. Extrapolating the rates in the CONAPO projection, Mexico’s population growth is expected to peak in 2053 at 137.6 million and then start to gradually decline. Of course, it is very difficult to accurately project emigration figures. If emigration is a third less than projected by CONAPO, then Mexico’s population could peak at 145 million.

Related posts:


The geography of Mexico’s drug trade: new cartels involved in turf wars

 Mexico's geography in the Press, Updates to Geo-Mexico  Comments Off on The geography of Mexico’s drug trade: new cartels involved in turf wars
Feb 202013
 

As we suggested a year ago – Mexico’s drug cartels and their shifting areas of operation, a 2012 update  – it is increasingly difficult to track the areas of operation of the major drug trafficking groups in Mexico. The U.S. Department of the Treasury’s Office of Foreign Assets Control recently added a new narcotrafficking group in Mexico, the Meza Flores family, to its list of Foreign Narcotics Kingpins. (This designation prohibits people in the USA from engaging in transactions with the named individuals or their organization, and freezes any assets the individuals or organization may have under U.S. jurisdiction).

According to the Treasury Department’s statement, the Meza Flores family began operations in about 2000 and is responsible for the distribution of considerable quantities of methamphetamines, heroin, cocaine and marijuana in the USA. It is headed by Fausto Isidro Meza Flores (aka “Chapito Isidro”) and is based in the town of Guasave, in the state of Sinaloa. (Meza Flores was previously in the Juárez cartel before becoming a high ranking member of the now defunct Beltran Leyva cartel).

The Meza Flores group is a direct rival of the long-established and very powerful Sinaloa cartel. The Sinaloa cartel is headed by Joaquín “El Chapo” Guzmán Loera, who has been on the run since escaping from the maximum security jail in Almoloya de Juárez, near Toluca, in 2001. According to Forbes Magazine, Guzman Loera is currently Mexico’s 10th richest individual, with assets of around one billion dollars.

Mexico’s “War on Drugs” in recent years has led to a fragmentation of the major cartels. Some experts claim that as many as 80 distinct groups are now involved in drug production and trafficking. Many of these groups are small and highly localized, but this fragmentation has increased the incidence of turf wars between rival groups. These turf wars have caused extreme levels of violence in some parts of the country. Once one side is firmly in control, the violence drops.

The current federal administration has said that some 70,000 people died in Mexico between 2006 and 2012 as a result of the activities of organized crime. Recent press reports such as Jalisco: La invasión de Los Templarios claim that one on-going boundary war is along the state boundary between Michoacán and Jalisco. This conflict is between the Michoacán-based Knights Templar (Los Caballeros Templarios, LCT) and the Jalisco-based New Generation cartel (CJNG).

The LCT is comprised largely of former members of  La Familia Michoacana (LFM), a group which is now almost defunct. Other members of LFM joined the Zetas, the Sinaloa cartel’s arch enemy. The CJNG started out as enforcers for the Sinaloa Cartel.

Violence linked to this particular turf war has occurred in numerous municipalities including Jilotlán de los Dolores, Pihuamo, Mazamitla, San José de Gracia, La Barca, Atotonilco, Ayotlán, Tizapán el Alto, Tuxcueca, Jocotepec and Chapala (all in Jalisco), as well as Briseñas, Yurécuaro, Sahuayo, Marcos Castellanos, La Piedad, Zamora, Cotija de La Paz, Tepalcatepec, Los Reyes, Peribán and Apatzingán (all in Michaocán).

This is not the only turf war currently underway in Mexico. For example, further north, another recent hot spot has erupted along the Durango-Coahuila border, especially in the La Laguna area centered on the city of Torreón.

Related posts:

Which political party has the most state governors?

 Other, Updates to Geo-Mexico  Comments Off on Which political party has the most state governors?
Feb 162013
 

Mexican governors are elected for single six-year terms; re-election is not permitted by the Mexican Constitution. The terms of governors in different states overlap; for example, seven of the 32 governors began their term of office in 2012.

The PRI (Partido Revolucionario Institucional, Institutional Revolutionary Party) currently holds 19 of the 32 governorships spread throughout Mexico (states colored red on map), except for the northwest and extreme south. On 1 March 2013, PRI will gain another governorship when Aristoteles Sandoval of PRI replaces the current PAN Governor of Jalisco. Although PRI Presidential candidate, Enrique Peña Nieto, easily won the Mexican Presidency in 2012, of seven new governors inaugurated in 2012, only three were from PRI.

Ex-President Calderón’s PAN (Partido Acción Nacional, National Action Party) is a distant second with seven governorships (blue on map); six after 1 March 2013. Four of the PAN governorships are in the northwest.

The PRD (Partido de la Revolución Democrática, Party of the Democratic Revolution) is third with four governorships (yellow on map). Three of the PRD governors took office in 2012. PRD has held the important governorship of the Mexico City Federal District since 1988.

State governorships, 2010 and 2013

State governorships, 2010 and 2013

The Governor of Oaxaca (brown on 2013 map) is from the Movimiento Ciudadano (Citizens’ Movement, formerly known as Convergencia or Convergence), which supported López Obrador in the 2006 presidential election. The Governor of Chiapas is from the PVEM (Partido Verde Ecologísta de México; Mexico’s Green Party; green on the 2013 map).

The north-south political divide that we have referred to in some previous posts, including the equivalent map for 2010 shown above, is no longer evident in the current pattern of state governorships.

Related posts:

Value of remittances entering Mexico declines in 2012

 Updates to Geo-Mexico  Comments Off on Value of remittances entering Mexico declines in 2012
Feb 042013
 

Mexico’s central bank has released figures showing that remittances entering Mexico in 2012 totalled $22.446 billion, 1.57% less than the $22.803 billion  recorded in 2011. [All figures in US dollars.]

The central bank registered 71.62 million remittance movements in 2012, 2.52% more than the year before. The average remittance fell by about 4% from $326 in 2011 to $313 in 2012.

The state receiving most remittances was Michoacán which accounted for $2.209 billion, almost 10% of the total.

Remittances are the second largest source of foreign exchange after oil and gas revenues and are a vital source of funding for millions of people.

Related posts: