This Guardian article – ‘My neighbourhood is being destroyed to pacify his supporters’: the race to complete Trump’s wall – highlights the problems created (not solved) by US efforts to build a wall along its southern border.
Geo-Mexico is reader-supported. Purchases made via links on our site may, at no cost to you, earn us an affiliate commission.
Learn more.
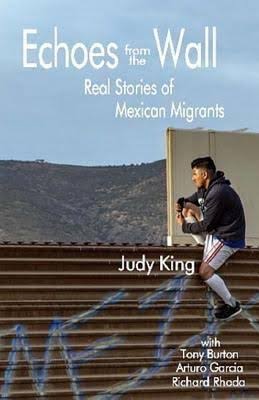 For what it’s worth, here is my own take on the wall, written a few years ago as a short chapter for Judy King’s book, Echoes from the Wall: Real Stories of Mexican Migrants (Mexico Insights, 2019). The majority of King’s book is based on her one-on-one interviews with a varied and fascinating selection of Mexican migrants who at one time or another lived and/or worked in the US. King’s personal, in-depth approach was time consuming but was amply rewarded and she acquired some extraordinary individual accounts. The book also includes short “backgrounders” on the history of Mexican-US migration and the practicalities involved.
My chapter focused on the geography related to the wall building.
The Border Story: the effects of a barrier wall (written in 2018)
The U.S.-Mexico border is unique in terms of its geography. It is the longest land border in the world between a developed economy and an emerging economy. The continental U.S.-Mexico border (excluding offshore limits) is about 1990 miles (3200 km) long. At roughly the mid-point, the cities of El Paso and Ciudad Juárez face each other across the boundary line. East of these cities, the border follows the course of the Río Grande (Río Bravo as it is known to Mexicans) to the Gulf of Mexico; west of these cities, it crosses the Sonoran desert to reach the Pacific Ocean between San Diego and Tijuana.
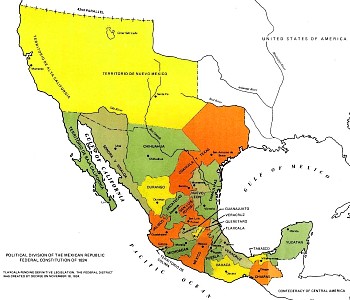
Map of Mexico, 1824
This boundary was established in the middle of the 19th century. After the Mexican‑American War (1846‑1848) the 1848 Treaty of Guadalupe Hidalgo ceded over half of Mexico’s territory to the USA. A few years later, under the 1853 Gadsden Purchase (Treaty of La Mesilla), northern portions of Sonora and Chihuahua were also transferred to the USA. This more or less established the current border between the two countries.
Minor disputes have occurred since due to the constantly migrating meanders of the Río Grande/Bravo. Flooding during the early 1860s moved the river channel south, shifting an area of about 2.6 square kilometers (1 square mile) from Ciudad Juárez in Mexico to El Paso in the U.S. Both countries claimed the area, giving rise to the El Chamizal dispute. This dispute went to international arbitration in 1911 and was only finally resolved in 1963 with the ratification of the Chamizal Treaty by President John F. Kennedy and his Mexican counterpart, Adolfo López Mateos.
A permanent memorial to Chamizal was established in El Paso in 1966 to commemorate the two nations’ laudable international cooperation, diplomacy and respect for cultural values in arriving at a mutually acceptable resolution to the conflict. A later dispute about changes in river meanders – the Ojinaga Cut – was amicably resolved in 1970.
There are about fifty places where people can legally cross the U.S.-Mexico States border but only one where the cities on either side of the border have the same name: Nogales. Historically, straddling the international border was not a drawback to residents of the “Two Nogales” (Ambos Nogales).
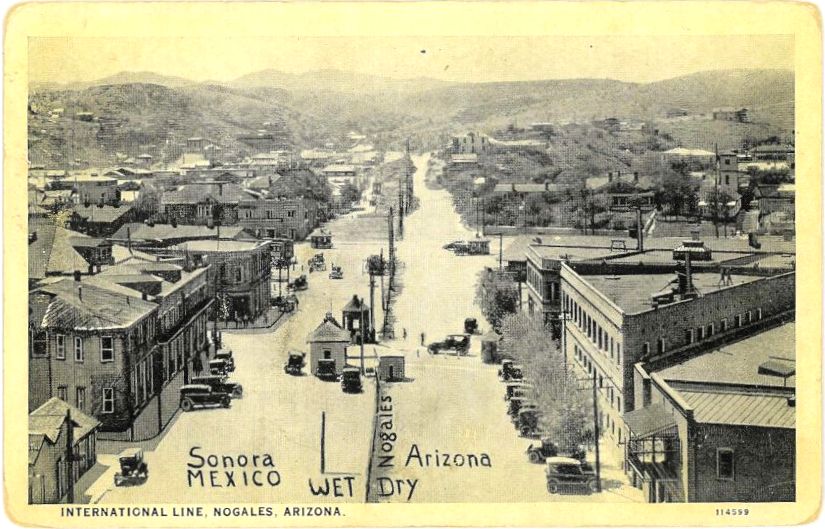
Postcard of Ambos Nogales, ca 1915
A century ago, one street in Nogales – International Avenue – actually ran east‑west along the border, with one side of the street in the U.S. and the other in Mexico. Even before a boundary fence was erected down the middle, residents were apparently still required to cross at one of two entry points: either the Morley Avenue crossing or the Grand Avenue crossing. The 60-foot-wide avenue had been created in 1897 after all buildings close to the border were razed to the ground as a way of limiting customs fraud. A permanent border fence was built in 1918 following the Battle of Ambos Nogales (La batalla del 27 de agosto).
During the prohibition years (1919-34) in the U.S., Mexican cities close to the border benefited from an influx of free-spending visitors. These years were boom times for the bars, casinos, brothels and race tracks of cities such as Ciudad Juárez and Tijuana. These cities also did well during World War II, when many of the large number of U.S. military personnel stationed near the border were able to circumvent wartime rationing at home by hopping south.
Beginning in the mid-1990s, physical barriers (fences, walls) were erected along some sections of the border to try and stem the flow of migrants from Mexico. Other sectors are closely monitored via electronic sensors, drones, cameras and mobile and satellite surveillance systems. In total, about 30% of the border already has some form of barrier, physical or virtual.
Existing barriers have already made life very difficult in many places. For example, it used to be a ten minute walk for residents of Ejido Jacume in Baja California to cross the border into Jacumba Hot Springs, California, to go to school, work, shop or attend the health clinic. With the barrier, it is now a two hour drive via Tecate.
Most of the physical barriers already built are along the western half of the border (where California, Arizona and New Mexico meet Baja California, Sonora and Chihuahua), They aim to prevent undocumented crossings into the major cities, especially San Diego and El Paso. They have forced would-be migrants to take on crossing the border somewhere in the largely unpopulated Sonoran Desert west of Nogales. The arduousness of this trip has cost the lives of many, many migrants, with the number of deaths of border-crossers since 2004, in this section alone, averaging more than 200 a year.
One of the many ironies associated with demands to build more and higher barriers between the two countries, given their extremely close social and economic ties, is that there is a simultaneous demand (in other quarters) to ease the movement of people and goods across the border in order to boost tourism and facilitate trade. For instance, in December 2015, a 120-million-dollar pedestrian bridge, known as The Cross Border Xpress (CBX), opened to allow passengers living in California to walk across the border into Tijuana International Airport. This helped ease border congestion at the existing land crossings into Tijuana.
Similarly, U.S. and Mexican border officials have piloted joint customs inspection procedures to cut border-crossing times for freight by up to 80%. Trade between the two countries is worth 1.4 billion dollars a day. The first tests of the new joint system were at Laredo international airport in Texas (for vehicle, electronic and aerospace components being flown to eight cities in Mexico), the Mesa de Otay in Baja California (for Mexican farm products entering the U.S.) and San Jerónimo in Chihuahua (for computers and other electronic exports from Mexico). The project has been warmly welcomed by business representatives on both sides of the border.
Finding the right location to build any barrier/wall may prove harder than many would anticipate. While most existing sections of barriers along the western half of the border are located very close to the true boundary line, this is not possible east of El Paso where the boundary runs (theoretically) down the deepest channel of the Río Grande/Río Bravo. Here, a wall or barrier along the boundary is impracticable.
Several protected National Wildlife Refuge (NWR) areas sit on or astride the boundary. They include the Lower Rio Grande Valley NWR and the Santa Ana NWR in Texas, the the Tijuana Slough NWR in California, and the Cabeza Prieta NWR in Arizona (the 3rd largest national wildlife refuge in the lower 48 states) which is contiguous to the UNESCO-designated World Heritage site of El Pinacate y Gran Desierto de Altar Biosphere Reserve in Sonora. In west Texas, Big Bend National Park extends to the border where it meets the Cañon de Santa Elena National Park in Chihuahua.
Ecologists have grave concerns about animal migration corridors and the future of numerous trans-border species. Up to now, only rudimentary and superficial Environmental Stewardship Plans (ESPs) have been prepared for the border areas where barriers have been constructed. These ESPs almost invariably claim that any adverse impacts on plant and animal populations will be only short-term, even in the absence of any scientific studies assessing existing populations.
Barriers such as walls prevent some species from crossing the border and can separate existing cross-border populations into two distinct groups, reducing their viability and increasing the risks of in-breeding, reducing their resilience to changes in climate or food sources. One major study identified 93 currently endangered species likely to be affected by a wall, including jaguars, ocelots, Mexican gray wolves and Quino checkerspot butterflies. Black bears in Texas that currently migrate across the border annually will have their natural territory sliced in half, as will the pronghorn antelope herds further west. Several species, including the jaguar, arroyo toad, the cactus ferruginous pygmy owl (which flies close to the ground) and Peninsular bighorn sheep, have critical habitats either side of the border.
People, too, have cross-border territories. Spare a thought for Native American groups such as the Tohono O’odham people whose ancestral lands now lie on either side of the Arizona-Sonora border. Their divided territory originated in 1853 with the Gadsden Purchase. Most of the estimated 25,000 Tohono O’odham alive today reside in Arizona but about 1500 live in northern Sonora. For decades, the two groups of Tohono O’odham, never granted dual citizenship, kept in regular contact for work, religious ceremonies and festivals, crossing the border as needed without any problem. Stricter border controls have made this impossible today.
Repeated efforts to solve the “one people‑two country” problem by granting U.S. citizenship to all registered members of the Tohono O’odham, regardless of their residence, have so far not succeeded. Ironically, because of its relatively remote location, the Tohono O’odham Nation has often been called upon to provide emergency assistance to undocumented workers (and drug traffickers) attempting to cross the border who have underestimated the severe challenges of crossing this section of the harsh Sonora desert.
Land ownership along any wall-building line is another issue. Building it on federal land is relatively easy, especially if the U.S. administration continues to utilize mechanisms that ignore, or they claim trump, dozens of existing environmental and cultural laws. Costs and protests rise where the planned barrier is located on privately-owned land.
Some sections of barrier have already been built in the wrong place. In 2008, for instance, one Native American human rights delegation reported that the official International Boundary obelisks marking the Arizona/Sonora boundary had been moved about 20 meters south during barrier construction, a clear violation of international law. Costs escalate still further whenever the barrier needs to be relocated.
The effective implementation of many cross-border agreements will be adversely affected by a barrier. For instance, the U.S. Forest Service and Mexico’s National Forestry Commission have a co-operation agreement, the Bi‑national Convention on Forest Fires, for dealing with cross-border wildfires on the Arizona/Sonora border. It aims to increase public safety on both sides of the border, reduce habitat loss, and facilitate the fighting of wildfires. It allows for a united bi‑national command to be established and for firefighting brigades, together with supporting vehicles and aircraft, to cross the border by up to 16 km (10 miles) in either direction in order to battle ongoing wildfires, provided advance notice is given. With a wall, this is clearly impossible.
Quite apart from the cost implications and the potential adverse impacts for people, communities, trade and fauna in the border regions, building a wall is not the answer. Animals may not have a viable choice after a wall is built but if people still want to cross, and can’t do so by land, they will surely turn to the air, the oceans, or (as has already happened repeatedly with smugglers in both directions) underground tunnels.
In fact, despite fear-mongering news reports in the U.S. press, the flow of migrants over the past decade has actually reversed: the number of people now crossing the border from the U.S. to live in Mexico is higher than the number of Mexicans moving north. While some of the migrants moving south are Mexicans returning home, others are estadoudienses preferring to retire, live or work in Mexico.
Judy King’s Echoes from the Wall: Real Stories of Mexican Migrants (Mexico Insights, 2019) is available worldwide via Amazon. The case studies of individual migrants are excellent starting-points for geography classes about international migration in high schools and colleges.