drug deaths | Geo-Mexico, the geography of Mexico

Drug war deaths in Mexico’s biggest cities

 Other  Comments Off on Drug war deaths in Mexico’s biggest cities
Feb 182012
 

Drug war deaths occur in communities of all sizes, but they are a bit more likely in the biggest cities. However, there are gigantic geographic variations. For example, Acapulco, with a population of about 790,000, had 795 drug war deaths in 2011 (Jan–Sept) [note 1] while there were zero drug war deaths in Mérida, with 828,000 residents. Clearly drug cartel battles are very geographically concentrated.

Compared to the rest of the country, Mexico’s 37 largest municipalities with populations of over 500,000 experience about 40% more drug war deaths per 100,000 population than the rest of the country. These big cities account for about 36.5% of Mexico’s population and 44% of the drug war deaths in both 2010 and 2011.

In 2010, Ciudad Juárez was the drug war hotspot with 2,736 deaths for a rate of 206 per 100,000/yr compared to the national rate of 13.6 [note 2]. This dropped by a surprising 41% in 2011 to a rate of 121 [note 3]; but  Ciudad Juárez still led the nation’s death toll with 1,206 deaths. Acapulco’s 795 deaths gave it the highest rate among big cities of 134, up a frightening 186% over 2010. Other dangerous big cities with high drug war death rates include Torreón with a rate 99 (up 100%), Durango with 89 (up 244%), Chihuahua with 65 (down 20%) and Culiacán with 57 (down 17%).

Tijuana used to be a major center of drug violence, but not anymore. Between December 2006 and December 2009, it experienced 1,195 drug war deaths, behind only Ciudad Juárez with 3,699 and Culiacán with 1,303. Its death rate for that period was over four times the national average. But the number of deaths dropped from 472 in 2010 to 183 in 2011 bringing the rate down to 15.6, just above the national average of 15.3. In nearby Mexicali, the rate was only 4.1 in 2011, about a quarter of the average. The state of Baja California is no longer a key battleground in the Mexican drug war.

Drug violence deteriorated most rapidly in Veracruz City which went from 9 deaths in 2010 to 155 in 2011 resulting in a rate increase of almost 2,200%. This increased the rate to 37, nearly two and a half times the national average. Smaller cities in Veracruz State also experienced rapid increases. For example, Jalapa went up 1,066% and Bocas del Rio was up 6,167%. For the state as a whole, the rate was up over 300%. Clearly, the drug war has reached Veracruz.

Drug war violence has also increased rapidly in Monterrey where the number of deaths increased from 179 in 2010 to 399 in 2011, more than doubling its death rate. Deaths in Monterrey’s two large suburbs of Guadalupe and Apodaca also went from 91 to 220. While the rate in Monterrey was just above the national average in 2010, in 2011 it was up to 47, three times the average. Deaths in nearby Saltillo also went up rapidly, from 15 to 50, pushing its rate up by 344%.

Guadalajara also experienced an upsurge in drug violence. While its death rate went up 61% to 7.3 in 2011, this is still less than half the national average. However, the 2011 data do not include the 26 bodies dumped in the city in November 2011. Death rates were also up nearly 50% in Guadalajara’s two big suburbs of Zapopan and Tlaquepaque.

Surprisingly the Mexico City Federal District has been relatively free of drug violence. Total drug war deaths dropped from 191 to 122 pushing its 2011 rate down to only 1.8 deaths per 100,000/yr. This is only about one eighth the national rate. A future post will provide a more detailed analysis of drug violence in Mexico City.

In addition to Mérida, Tuxtla Gutierrez in Chiapas also had zero deaths in 2011. Other big cities with very low drug war death rates include Puebla (0.6), Querétaro (0.8), León (1.9), Toluca (2.1) and Villahermosa (2.5). Apparently drug cartels and their enemies have not been very active in these cities.

Notes:

[1] All the references for 2011 are for January through September based on the data released by Mexican Government

[2] “Mexican drugs war murders data mapped”, The Guardian, posted by Johanna Tuckman, Jan 14, 2011. http://www.guardian.co.uk/news/datablog/2011/jan/14/mexico-drug-war-murders-map. For data see: http://www.google.com/fusiontables/DataSource?dsrcid=393962.

[3] The rates for 2011 were adjusted because data are available for only the first nine months of the year.

Apr 042011
 

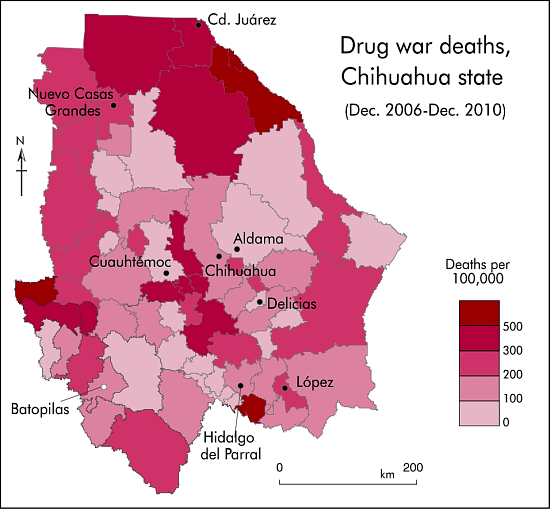
The map (below) of drug war death rates for the 67 municipalities of Chihuahua reveals a rather complicated pattern that is not amenable to easy explanation.

There is a clear cluster of very high death rate municipalities around Ciudad Juárez, which has for years been the main focus of drug violence in Mexico.

Drug war deaths in the state of Chihuahua
Drug war deaths in Chihuahua (Dec. 2006—Dec. 2010). Cartography: Tony Burton; all rights reserved.

There is also a group of high death rate municipalities west and south of Chihuahua City suggesting that it might be a center of significant drug cartel activity.

The reason for high death rate areas on the western and southern borders of Chihuahua is not readily apparent from the map, though they do coincide with the area of lowest HDI (Human Development Index) scores in the state (see Geo-Mexico, figure 29.3).

This south-western part of the state forms part of the Western Sierra Madre physiographic region (see map linked to above), an area of rugged relief with limited highway connections where rivers have carved giant canyons (such as the Copper Canyon system) into the forested plateaus and mountains. The “culture of violence” in this region, sometimes called Mexico’s “Golden Triangle”, was analyzed by Carlos Mario Alvarado in “La [Sierra] Tarahumara, una tierra herida: análisis de la violencia en zonas productoras de estupefacientes en Chihuahua”  (The Tarahumara Sierra, a wounded land: analysis of the violence in narcotic drug production zones in Chihuahua) published by the state government in 1966.

Alvarado found that between 1988 and 1993, in the southernmost municipality of Guadalupe y Calvo and in neighboring drug-growing municipalities, murders had a bimodal distribution each year, with peaks in April-May-June (when poppies and marijuana are planted) and September-October-November (when they are harvested). The four-year drug-violence death-rate for those municipalities in the early 1990s was significantly higher than the four-year drug war deaths ration shown on the map for 2006-2010.

Guadalupe y Calvo, “one of the most violent municipalities in Mexico”, had a four-year rate for 1991-1994 of about 510/100,000 inhabitants. Batopilas’s rate, 478/100,000, was almost as high. The rate in Morelos, sandwiched between these two municipalities, was over 700/100,000. On this limited evidence, it does not appear that this region has actually become any more violent than it used to be!

Returning to the map, it is also interesting that there are some relatively low death rate areas along the rather isolated Mexican-USA border in eastern Chihuahua. Careful analysis of the Chihuahua highway network does not provide any real insights to explain the mapped pattern.

There is some good news. For the 2007-2010 period, five of Chihuahua’s 67 municipalities did not experience a single drug war related death, though they are all very small municipalities with an average population of about 2,000.

Finally, we should remember that even the lightest areas on the map represent municipalities with death rates quite high compared to the rest of Mexico. Five of the municipalities in this group of 18 have death rates over twice the national average and 12 are above the average.

Previous posts in this mini-series:

Geo-Mexico: the geography and dynamics of modern Mexico discusses drug trafficking in several chapters. A text box on page 148 looks at trends in the drug trafficking business and efforts to control it. Buy your copy today to have a handy reference guide to all major aspects of Mexico’s geography!

Which communities in Mexico have the highest rates of drug war deaths?

 Updates to Geo-Mexico  Comments Off on Which communities in Mexico have the highest rates of drug war deaths?
Feb 052011
 

Guadalupe, in the state of Chihuahua, with 139 deaths among a population of only 6,458, has the highest drug war death rate in Mexico: 2,152 drug deaths per 100,000 population. Mier (Tamaulipas) and General Treviño (Nuevo León) are not far behind. Most of the municipalities in the attached table (link below) have rather small populations; 15 of the municipalities had fewer than 6,500 inhabitants in 2010.

A previous post noted that among big cities, Ciudad Juárez had the highest rate of drug war deaths by far, over twice the rate for the runner-up Culiacán in Sinaloa. However, Ciudad Juárez ranks only 10th when smaller municipalities are included in the analysis. The table lists the 20 municipalities with the highest rates of drug war related deaths (from December 2006 through December 2010) per 100,000 population. Drug war deaths include deaths of drug cartel members, law enforcement personnel, and innocent by-standers.

All 20 municipalities listed in the table are in one of four border states: Chihuahua, Sonora, Nuevo León and Tamaulipas. In fact, half of the 20 municipalities are in the state of Chihuahua. Five form a cluster around Ciudad Juárez on the border and four are just south of Chihuahua City. The three in Tamaulipas and three in Nuevo León are bunched together between Nuevo Laredo and Reynosa within 60 kilometers of the border. Three of the four in Sonora are not far from the highway joining the state capital Hermosillo with Nogales on the US border.

Previous posts in this mini-series:

Related posts about the geography of drug trafficking and drug cartels in Mexico:

Geo-Mexico: the geography and dynamics of modern Mexico discusses drug trafficking in several chapters. A text box on page 148 looks at trends in the drug trafficking business and efforts to control it. Buy your copy today to have a handy reference guide to all major aspects of Mexico’s geography!

The rates of drug war deaths vary enormously in Mexico’s states

 Updates to Geo-Mexico  Comments Off on The rates of drug war deaths vary enormously in Mexico’s states
Jan 292011
 

Despite what some media reports might suggest, not all parts of Mexico are plagued with serious drug war violence. A previous post – Deaths from war on drugs have increased rapidly since 2006 – discussed which states accounted for the most drug war deaths during the last four years and noted that these states were mostly in northern and western Mexico. The data on drug war deaths include deaths of drug cartel members, law enforcement personnel, and innocent by-standers.

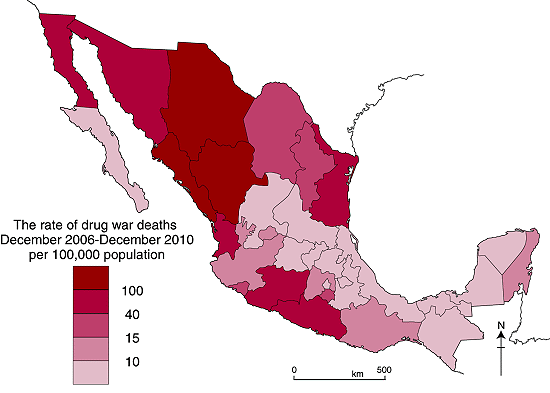
A more accurate way to compare states is to incorporate population to determine the rates of drug war deaths. The table above, and the map below, were compiled using the recently released data on deaths and the preliminary results of the 2010 census. There are some obvious methodological issues associated with combining drug war death figures for a four-year period with a population “snap shot” taken in mid-2010, but we believe these issues are minor and will not have any significant effect on the broad patterns of drug war deaths that the analysis reveals.

Drug war death rates, by state, December 2006-December 2010

The national average rate is 30.81 deaths per 100,000 population. It is not surprising that the State of Chihuahua, which led the country with 10,135 deaths, had the highest rate, almost 300 deaths per 100,000 population. The rate for Chihuahua is almost ten times the rate for the country as a whole. The rates for the other leading drug war states are significantly smaller, but way above the national average.

The four most populous states, Mexico, Federal District, Veracruz and Jalisco, are centrally located and have death rates ranging from half the national average for Jalisco down to about a fifth for Veracruz. Interestingly, for these four states the rates decline from west to east. This pattern does hold when less populous intervening states are included. Two of these, Querétaro and Puebla have about the lowest rates in the country, about one-fifteenth the national average.  Yucatán also has a very low rate. The drug war death rates for Tlaxcala, Puebla and Yucatán are less than one half of one percent of the rate in Chihuahua. Clearly, some parts of the country are far more affected by drug wars than others.

Previous post in this mini-series:

Related posts about the geography of drug trafficking and drug cartels in Mexico:

Other relevant link

Geo-Mexico: the geography and dynamics of modern Mexico discusses drug trafficking in several chapters. A text box on page 148 looks at the drug trafficking business and efforts to control it. Buy your copy today to have a handy reference guide to all major aspects of Mexico’s geography!

Deaths from war on drugs have increased rapidly since 2006

 Updates to Geo-Mexico  Comments Off on Deaths from war on drugs have increased rapidly since 2006
Jan 262011
 

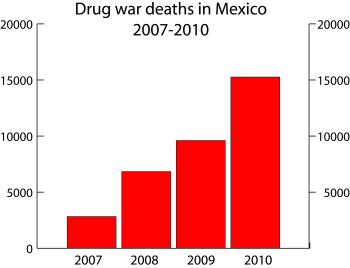
The Mexican Government recently released data on all the deaths in Mexico linked to drug wars for the period December 2006, when the drug wars started, through December 2010. The data include deaths of drug cartel members, law enforcement personnel, and innocent by-standers.  According to the data, 34,612 were killed in Mexico during this four year span, with 2010 being by far the most violent year with 15,273 deaths, 44% of the four year total. The 2010 total was 59% higher than 2009.

The graph below shows how rapidly the number of deaths resulting from the war on drugs has escalated. The crucial question now is, “Will drug war deaths continue to accelerate rapidly in 2011?”

Drug war deaths, 2007-2010

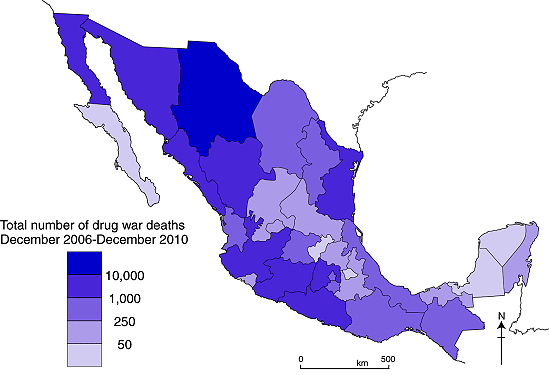
Not surprisingly, Chihuahua, led all other states with 10,135 deaths during the four year period, almost 30% of the total. In 2010 alone 4,427 were killed in Chihuahua, up 32% from 2009. This is a large one year acceleration in violence, but only about half the national increase of 59%. Most of the deaths in Chihuahua were in Ciudad Juarez, with 6,637, and Chihuahua City with 1,415. A later post in this mini-series will investigate drug war deaths in Mexico’s major cities. The map below shows the total number of deaths state-by-state for the period December 2006-December 2010.

Map of total drug war deaths 2007-2010
Map of total drug war deaths, December 2006-December 2010

As can be seen from the map, other states with very large numbers of deaths were Sinaloa (4,387 deaths, up 71% in 2010), Guerrero (2,736, up 29%), and Baja California (2,019 – 1,667 in Tijuana). Next came Durango (1,892 deaths), Michoacán (1,751, down 12%), State of Mexico (1,538), Tamaulipas (1,475), and Sonora, (1,258).

Tamaulipas burst onto the drug war scene in 2010 with 1,209 deaths in 2010 compared to “only” 90 in 2009, an increase of 1243%. The state with the greatest increase was San Luis Potosí which went from 8 deaths in 2009 to 135 in 2010, an increase of 1588%. The figure for 2010 alone was 72% of the four year total. Other states experiencing extremely rapid increases were Nayarit (919%) and Baja California Sur (900%), and Nuevo León (454%).

States with over 1,000 drug war deaths are all located in northern or western Mexico except for the centrally located State of Mexico, and perhaps Guerrero which might be considered a southern state.

At the other end of the spectrum, the states recording the fewest deaths during the four year period were Tlaxcala (13 deaths), Baja California Sur (19), Yucatán (26), Campeche (31) and Querétaro (37). While these were the least affected by drug war violence, the number of deaths in these states was still significant. During 2009 and 2010, Yucatán had only three deaths while Tlaxcala had ten and Baja California Sur had 11.

Related posts about the geography of drug trafficking and drug cartels in Mexico:

Geo-Mexico: the geography and dynamics of modern Mexico discusses drug trafficking in several chapters.  A text box on page 148 looks at drug trafficking business and efforts to control it.  Buy your copy today to have a handy reference guide to all major aspects of Mexico’s geography!

Mar 032016
 

To make it easy to search for specific topics on Geo-Mexico, we add an occasional index page as a starting point for the best links relating to particular key topics. Note that the entire site can easily be searched via our search function, categories (right hand navigation bar on every page) and tags (left-hand navigation bar).

The geography of Mexico’s drug trade: an index page

The Basics

Economics:

Drug War Violence and Crime

Drug Money

Other

Index pages on other topics:

Mexico City has largely escaped drug violence

 Other  Comments Off on Mexico City has largely escaped drug violence
Mar 082012
 

Previous posts have analyzed drug war death rates in Mexican states, cities over 500,000, the most violent municipalities and areas of particular interest to expatriates. This post focuses on Mexico City or D.F. (Distrito Federal). We focus on D.F. because the rate of drug war deaths is exceptionally low there, less than one eighth the national average.

In all of 2010 there were 191 drug war deaths in D.F. [note 1] compared to 122 in the first nine months of 2011. [note 2] While this might sound like a large number of deaths, we must remember that there are almost nine million people in D.F.  The 2011 drug war death rate per 100,000/yr in D.F. was 1.8 compared to a national rate 15.3 and a rate of 134 in Acapulco. [note 3] The rate for D.F. declined 15% from the 2010 rate while the rates for all of Mexico and Acapulco increased by 13% and 187% respectively. Today, people seeking better security are moving into D.F. from other cities in the country.

Why are the rates in D.F. so low? In previous decades D.F. was thought to be one of the most violent places in the country, but this is no longer the case. The total murder rate for D.F. is half the national rate [note 4] and less than a third that of Washington, DC. [note 5] A major reason is that D.F. has a more competent, better organized, better paid and less corrupt police force than any of the other cities. The fact that the national government is in D.F. also helps as do more effective youth programs. That D.F. has higher overall income levels is also a factor. Some even speculate that major cartel bosses have family in D.F. and have an unspoken agreement to avoid violence in the capital [note 6].

The drug war death rates are quite low in all parts of the city. The wealthy delegation of Cuajimalpa in western D.F. had zero deaths in 2011 compared to 11 a year earlier. In 2010 it had the city’s highest rate of 5.9, but this was still less than half the national average. Relatively sparsely populated Milpa Alta in the southeast also had zero deaths in 2011. Cuauhtemoc and Venustiano Carranza, two central delegations, had the highest rates in 2011, but they both less than a third the national average.

The 13 suburban municipalities adjacent to D.F. in the State of Mexico experienced 331 drug war deaths in 2011, almost three times the number in D.F. These suburbs with a total population of just over six million had a combined drug war death rate of 7.3, four times as high as D.F. While the death rate in these municipalities increased 42% over the 2010 level, it was still less than half the national average. Based on the data presented above, it is not surprising that people worried about drug violence would rather live in or near D.F. than in most other cities, especially those in northern and western Mexico.

Notes:
  1. “Mexican drugs war murders data mapped”, The Guardian, posted by Johanna Tuckman, Jan 14, 2011. http://www.guardian.co.uk/news/datablog/2011/jan/14/mexico-drug-war-murders-map. For data see: http://www.google.com/fusiontables/DataSource?dsrcid=393962.
  2. “Van mas de 47 mil muertos por nacroviolencia: PGR”, El Universal, 12 January 2012, http://www.eluniversal.com.mx/notas/822078.html.
  3. The rates for 2011 were adjusted because data are available for only the first nine months of the year.
  4. “Is Mexico City safe from drug cartel war – or the next target,” CNN, January 17, 2012, .http://www.cnn.com/2012/01/17/world/americas/mexico-city-security/index.html
  5. “Mexico’s violence not as widespread as seems,” USAToday, 3 August 2010. http://www.usatoday.com/news/world/2010-08-03-Mexico-drug-violence_N.htm.
  6. Is Mexico City safe from drug cartel war — or the next target,” CNN, January 17, 2012, .http://www.cnn.com/2012/01/17/world/americas/mexico-city-security/index.html.

Drug war death trends in areas of Mexico of interest to foreign tourists and retirees

 Other  Comments Off on Drug war death trends in areas of Mexico of interest to foreign tourists and retirees
Mar 022012
 

Non-Mexicans are far more interested in some parts of Mexico than others. These areas of interest may be well-known tourist destinations, have thousands of expatriate residents or are located on major expatriate travel routes. Mexico’s major cities, which are also of interest to foreigners, were discussed in a previous post. This post focuses on 24 municipalities of less than 500,000 population. (These are listed alphabetically in the table linked to at the end of the post.)

Drug war death rates vary enormously among the 24 communities. Data released by the Office of the President [note 1] indicate that some of these municipalities have extremely high drug war death rates. The number of deaths in Zihuatanejo went from 16 in 2010 [note 2] to a startling 90 in the first nine months of 2011. This results in a rate of 115 deaths per 100,000 population/yr or over seven times the national average of 15.3 [note 3]. This places Zihuatanejo among the 20 most dangerous communities in Mexico (see earlier post) along with the other famous Guerrero beach resort of Acapulco.

Other dangerous municipalities listed in the table are Tepic, Nayarit at 69 (4.5 times the average); Mazatlán at 58 (3.8 times the average) and Nuevo Laredo at 50 (3.3 times the average). Thousands of expatriates live in Mazatlán while thousands drive through Tepic and Nuevo Laredo. The temporal trends in these dangerous cities vary widely. Between 2010 and 2011, the rate for Zihuatanejo went up 650% while Nuevo Laredo’s increased by 67% and Tepic edged up 14%. The rate for Mazatlán was down 20%.

The most worrisome trend is the very rapid drug violence increase in Veracruz State. From 2010 to 2011 the death rate for Xalapa went up 1,066%. In 2010 there were a total of 15 drug war deaths in Xalapa, Boca del Río and Veracruz City combined; but in the first nine months of 2011 this went up to 284. It remains to be seen if this dreadful trend will continue into 2012 and beyond.

Other cities in the table with rates significantly above the national average include Nogales with a rate of 28, down 68% from 2009. The rate for Playas de Rosarito (Baja California) was up 41% to 28, nearly double the average of 15.3. Matamoros’ rate increased 13% to 20 while Cuernavaca’s was down 49% to 19.

The death rates in towns near Lake Chapala varied markedly. The rate for Ixtlahuacán de los Membrillos dropped from 34 in 2010 to 16 in 2010, but was still above the national average and twice the rate of neighboring Chapala. The rate for nearby Jocotepec of 13 was between the other two. Though local media suggest a growing drug violence problem in these three communities, the actual number of deaths dropped from 24 in 2010 to 12 in 2011. The death rate for the three communities dropped from 34% above average in 2010 to 33% below average in 2011.

The great news is that three of communities in the table—Bahia de Banderas, Guanajuato and San Miguel de Allende—had zero drug war deaths in the first nine months of 2011, compared to 27 in 2010. Bahia de Banderas, in Nayarit just north of Puerto Vallarta, is of particular interest because it had 19 deaths in 2010. If this precipitous drop is not a statistical anomaly it represents a major anomaly because the number of deaths in the adjoining community of Puerto Vallarta almost doubled from 15 in 2010 to 28 in 2011; furthermore there were 196 deaths in nearby Tepic.

Several tourist areas had drug war death rates less than a sixth the national average. These include Ensenada, La Paz and Los Cabos on the Baja Peninsula as well as Oaxaca City. Not far behind was Playa del Carmen with a rate about one quarter of the average. These data suggest that tourists worried about drug violence and seeking a beach resort vacation might lean toward Baja California Sur or the Maya Riviera instead of Acapulco, Zihuatanejo or Mazatlán.

Notes:

[1] “Van mas de 47 mil muertos por nacroviolencia: PGR”, El Universal, 12 January 2012, http://www.eluniversal.com.mx/notas/822078.html.

[2] “Mexican drugs war murders data mapped”, Theguradian, posted by Johanna Tuckman, Jan 14, 2011. http://www.guardian.co.uk/news/datablog/2011/jan/14/mexico-drug-war-murders-map. For data see: http://www.google.com/fusiontables/DataSource?dsrcid=393962.

[3] The rates for 2011 were adjusted because data are available for only the first nine months of the year.

Which Mexican communities have the highest drug war death rates?

 Other  Comments Off on Which Mexican communities have the highest drug war death rates?
Feb 232012
 

In a previous post we noted that big Mexican cities with populations of over 500,000 have drug war death rates about 40% higher than the rest of Mexico. However the highest rates of all are in small northern municipalities which have experienced very high levels of drug violence.

Mier, Tamaulipas was the most dangerous municipality in 2011 as it was in 2010. Though the number of drug war deaths in the town of 4,768 (2010) decreased from 93 in 2010 [note 1] to 50 in the first nine months of 2011 [note 2], it still led the country with 1,398 drug war deaths per 100,000/yr [note 3]. This is 91 times the rate for all of Mexico which was 15.3 in 2011 and also over ten times as dangerous as Acapulco, the large city with the highest rate of drug violence. Actually the death rate per population for Mier is probably higher because the mayor estimates that a third of the population may have fled the violence-prone town [note 4]. Mier is only about eight kilometers (five miles) from the Texas border and roughly midway between Nuevo Laredo and Reynosa. The municipality may be a bit more peaceful now that the Mexican military has occupied the town.

Guerrero, Mier’s immediate neighbor to the northwest with a population of 4,468, ranked second with a death rate of 1,045 or roughly 68 times the average. Both Guerrero and Mier are located between two warring drug cartels, the Zetas and the Gulf Cartel. Mier’s other neighbor along the Rio Grande, Miguel Alemán, fared somewhat better. Its death rate dropped from 407 in 2010 to 114 in 2011; but its 2011 rate was still over seven times the national average. The data reveal that municipalities along the border between Nuevo Laredo and Reynosa are among the most dangerous in all of Mexico. Interestingly, the rate for Reynosa itself was only 11 or about 27% below the average.

In third place is San Fernando, also in Tamaulipas, with a death rate of 680, about 44 times the average. This community of 57,220 suffered 292 deaths in 2011. Over half of these deaths were discovered in mass graves of Central Americans who were trying to immigrate to the US, but were kidnapped and murdered by drug cartels.

Next on the list are three small municipalities in Chihuahua – Guadalupe (rate of 496), Gran Morelos (373) and Cusihuiriachi (369). The 2011 death rates in these towns were 24 to 32 times the national average. While the rate for Guadalupe declined 42% since 2010, the rates for Gran Morelos and Cusihuiriachi were up 50% and 150% respectively. As mentioned in an earlier post, the State of Chihuahua had the highest 2011 drug war death rate among Mexico’s 32 states.

Drug war death totals in small communities can change dramatically from year to year. For example, Saric, Sonora with a population of 2,703 had 30 deaths in 2010 and zero in 2011. General Bravo, Nuevo Leon had 18 deaths in 2010 and zero in 2011 while Yecora, Sonora had 18 deaths in 2010 and only one in 2011. The number in General Treviño, Nuevo León went from 21 down to only two, but it still had the 8th highest rate among Mexico’s municipalities.

On the other hand, drug war deaths in Boca del Rio, Veracruz went from 2 in 2010 to an alarming 94 in 2011. This resulted in a rate increase of 6,167% and a rate six times the average. The rate for Zihuatanejo de Azueta, Guerrero increased by 650%; that of Yurécuaro, Michoacán went up by 452% while that for Cosalá, Sinaloa was up 317%, giving it a rate 13 times the average.

Zihuatanejo de Azueta is different than many of the other communities with very high drug war death rates because it has a rather large population of 104,609 and includes the famous international resort of Ixtapa. The number of drug war deaths in the municipality went from 16 in 2010 to a very disturbing 90 in 2011, giving it a death rate of 115, almost as high as Acapulco’s rate of 134. Certainly, the high drug war death rates in Zihuatanejo and Acapulco have damaged their tourism industries.

Twenty municipalities had drug war death rate in 2011 higher than 100 per 100,000/yr or about seven times the national average (see table). Two of these are the large municipalities of Ciudad Juárez and Acapulco. The 20 communities are spread across six northern and western states: six in Chihuahua, five in Tamaulipas, three in Guerrero, two in Sinaloa and Michoacán, and one each in Sonora and Nuevo León. Before randomly traveling in areas of these states, it would be a good idea to check local media and bulletin boards for indications of recent drug violence.

Notes:

[1] “Mexican drugs war murders data mapped”, The Guardian, posted by Johanna Tuckman, Jan 14, 2011. http://www.guardian.co.uk/news/datablog/2011/jan/14/mexico-drug-war-murders-map. For data see: http://www.google.com/fusiontables/DataSource?dsrcid=393962.

[2] “Van mas de 47 mil muertos por nacroviolencia: PGR”, El Universal, 12 January 2012, http://www.eluniversal.com.mx/notas/822078.html.

[3] The rates for 2011 were adjusted because data are available for only the first nine months of the year.

[4] Christopher Sherman (AP), “Drug War: Despite army takeover, fear grips Mexican town”, Press-Telegram, Long Beach, CA, Dec 7, 2011. http://www.presstelegram.com/breakingnews/ci_19488405

Recent geographic trends in Mexico’s drug violence

 Other  Comments Off on Recent geographic trends in Mexico’s drug violence
Feb 112012
 

Drug related violent deaths during the first nine months of 2011 increased by about 13% compared to 2010.  Data released by the Office of the President  in January 2012 indicate that from January through September 2011 Mexico had a total of 12,903 drug war deaths. This is a rate of about 15.3 per 100,000 people per year [2011 rates were adjusted because data are available for only the first nine months of the year] compared to 13.6 in 2010 and 7.55 in 2009 [“Mexican drugs war murders data mapped”]. While the rate of increase declined significantly in the past two years, still drug violence is increasing rapidly.

The geographic pattern of drug violence is still mainly concentrated in northern border states and some western states. Chihuahua was still the most violent state with 2,289 deaths in 2011 (Jan-Sept) for a rate of 90 deaths per 100,000 per year.  Other states with high rates were Guerrero (61), Durango (58), Sinaloa (53), Tamaulipas (45), Nayarit (42), Nuevo León (33), and Coahuila (28). Note that four of these states are along the border and four are in western Mexico.

At the other end, Yucatán had only one death for a rate of 0.07. Other states with low rates were Tlaxcala, 0.8; Puebla, 1.22; Querétaro, 1.24; Campeche, 1.62; Chiapas, 1.73; Hidalgo, 1.75; and the Federal District (Mexico City), 1.83. It is very interesting that the drug war death rate in the capital city was one of the lowest in the country and less than one eighth the national. A future post will investigate drug war death rates in Mexico City.

Among border states, drug war death rates decreased significantly for the western states. Baja California was down 38%; Sonora down 36%, and Chihuahua down 31%. Before 2010, Baja California and Sonora had death rates over twice the national average largely because of high death totals in Tijuana and Nogales. However for 2011 the rates for Baja California and Sonora were 31% and 22% below the national average. The worst drug violence in these two northwestern states might be a thing of the past.

The eastern border states all suffered increases. Coahuila was up 99% and Nuevo Leon was up 143%. Both now have death rates over twice the national average. Tamaulipas’ already high rate of 37 in 2010 increased 22% to 45, almost three times the average. Clearly the battleground of drug cartel clashes along the border has shifting to the east.

Violence is up in some western states where it already was quite high. The rate in Guerrero increased 80% to 60 deaths per 100,000 people, four times the national average. Nayarit suffered an increase of 21% to a rate 42, almost three times the average. Smaller, but still significant, increases were registered in Colima, up 24%, and Michoacán, up 40% putting these two states above the average. On the other hand, the some of the violent non-border states experienced declines. The rate in Sinaloa declined 19%; but with a 2011 rate of 53 it is still three and half times the average. Morelos was down 18% putting it just above the average.

Drug violence increased very rapidly in some non-border states that were relatively peaceful through 2010. The drug war death rate in Zacatecas increased 361% while that in Veracruz was up 302%. While these increases are alarming, these two states still had rates below the national average in 2011. Jalisco suffered an increase of 40%, but its 2011 death rate of 11 was still less than three-fourths of the average. The State of México was up 24%, but its rate was still less than a third the average.

In conclusion, drug violence in Mexico continued to increase in 2011. The violence appears to be mostly concentrated in a wide geographic arc formed by the border states and those in western Mexico. Within this region some areas are suffering rapid increases while drug violence is declining in other places.  It is not clear how this pattern will change in the years ahead. To get a clearer picture of the current pattern, in future posts we will investigate trends in drug violence among Mexico’s 2,458 municipalities.

Jan 122012
 

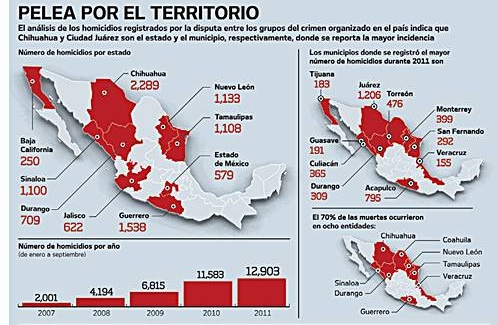
The Mexican Attorney General’s Office has released data for narco-related homicides for the first nine months of 2011. The data show that 12,903 narco-related deaths occurred in that period. The 2011 figure is 11% higher than the number of narco-related deaths reported for the same nine months in 2010. Even in the absence of data for the last quarter of 2011, we can safely assume that the total number of drug-related deaths in Mexico since the start of the “drug war” in December 2006 now exceeds 50,000.

As we have stressed in previous posts about drug-related violence in Mexico, the data for January-September 2011 show that violence is heavily concentrated in certain parts of the country, with other regions (such as Baja California Sur, Oaxaca and the Yucatán Peninsula including Quintana Roo) remaining untouched.

Narco-violence, January-September 2011

Narco-violence, January-September 2011 (El Universal)

As this graphic (original here) from Mexico daily El Universal shows, eight states (out of 32) accounted for 70% of all the homicides in the first nine months of 2011: Chihuahua, Guerrero, Nuevo León, Tamaulipas, Durango, Jalisco, State of México, Coahuila.

The ten municipalities with the highest number of homicides were Ciudad Juárez, Acapulco, Torreón, Monterrey, Culiacán, San Fernando, Durango, Mazatlán, Tijuana and Veracruz.
[* see comment below]

In all cases, it should be remembered that the data are for the total number of homicides and are not homicide rates (i.e. data adjusted for population size).

Jul 182011
 

With so much media attention focused on drug violence in Mexico, many potential tourists and tour operators are canceling planned trips to Mexico. Are such decisions rational? The analysis below indicates that travel to Mexico is considerably safer than risking vehicle traffic in the USA.

The US State Department has issued numerous travel advisories concerning visits to Mexico. As we discussed in a previous post —Which parts of Mexico are currently subject to US travel advisories?— the advisories focus on specific areas of Mexico. Unfortunately, many potential tourists overlook the geographic specificity and get the impression that all parts of Mexico are dangerous. Previous posts clearly indicate that levels of drug war violence vary enormously from place to place in Mexico.

This post investigates the chances of being a fatal victim of drug violence in various places in Mexico and compares these with the chances of being a fatal victim of a traffic accident in the USA. The US Department of Commerce estimates that about 19 million US citizens visit Mexico each year. According to MSNBC, in 2010 at least 106 Americans were killed in Mexico as a result of drug violence. Dividing the 19 million visits by the 106 deaths suggests that the chance of a visitor being killed on a trip to Mexico in 2010 was about 1 in 179,000. These are good odds, much better than the annual chance of being killed in a US traffic accident which is about 9,000 to 1. In other words, the chances of dying in a US traffic accident are roughly 20 times greater than being killed as a consequence of drug violence while visiting  Mexico. (As an aside, the annual chances of being killed in a Mexican traffic accident are about 1 in 4,800.)

Chance of a visitor being killed in drug violence in MexicoRelative danger of death in a road accident in the USA
MEXICO (whole country)1 in 179,00020 times greater
Ciudad Juárez1 in 11,4001.3 times greater
State of Chihuahua1 in 18,5002.1 times greater
Culiacán1 in 25,0002.8 times greater
Mazatlán1 in 47,0005.2 times greater
Tijuana1 in 52,0005.7 times greater
Monterrey1 in 210,00023 times greater
Puerto Vallarta1 in 288,00032 times greater
Chapala1 in 299,00033 times greater
Cancún1 in 360,00040 times greater
State of Jalisco1 in 378,00042 times greater
Oaxaca City1 in 427,00048 times greater
Guadalajara1 in 569,00063 times greater
Mexico City1 in 750,00083 times greater
State of Yucatán1 in 4,151,000460 times greater
Puebla City1 in 6,572,000730 times greater

Some areas of Mexico experience much more drug violence than others. For example drug violence deaths in Ciudad Juárez are 16 times greater than the Mexico national average. Consequently, the chance of an American visitor getting killed in drug violence in Ciudad Juárez is about 11,400 to one, still safer than risking traffic in the USA. The table shows the risks for a range of Mexican locations and compares them to the risks of US traffic. In the city of Puebla the risk is one in 6.6 million compared to one in 750,000 for Mexico City, one in 570,000 for Guadalajara, one in 360,000 for Cancún, about one in 300,000 for Chapala and Puerto Vallarta, and about one in 50,000 for Tijuana and Mazatlán.

These results indicate that the chance of a visitor being killed by drug violence in Mexico is extremely unlikely, far less likely than the risk of being killed in a US traffic accident. For example, a visit to Chapala is 33 times safer than risking US traffic for a year, while Mexico City is 83 times safer. Though this analysis focuses on the travel of US tourists to Mexico, the results are equally relevant for visitors from other countries.

More impacts of Mexico’s war against drug cartels

 Mexico's geography in the Press  Comments Off on More impacts of Mexico’s war against drug cartels
May 162011
 

Drug trafficking is one of the North America’s major contemporary issues, with widespread ramifications not only for Mexico, but extending well beyond her national borders. This is the first of an occasional series of updates examining some of the numerous different effects of the war on drug-related violence on Mexican society, the environment and the economy.

How many members of Mexico’s military have lost their lives in the war against the cartels?

In “InSight Map: Counting Federal Casualties in Mexico”, Patrick Corcoran takes a look at the confusing statistics relating to the deaths of members of the military in Mexico. The number claimed by the government (470 federal forces killed since 2000) does not match any of the conflicting numbers released on separate occasions by the Defense Secretariat for the number of military personnel killed in the on-going war against the drug cartels.

Drug war violence has decreased press freedom in Mexico

Freedom House, in its annual report, says that Mexico has experienced one of the world’s most radical declines in press freedom. Mexico’s press is now categorized on the Press Freedom Index as “not free”, alongside press in Cuba, Honduras and Venezuela.

More than 60 journalists have been killed in Mexico in the last decade, including 10 in 2010. Many others have been kidnapped, or intimidated. Several journalists have sought asylum in the USA. Drug cartels have increasingly pressured local press and news stations to broadcast partisan material, regardless of its accuracy.

Earlier this year, several major media groups in Mexico agreed to de‑glorify drug trafficking by refusing to show any grisly photos or menacing messages. The pact has been heavily criticized in some sectors, however, mainly on the grounds that it downplays the gravity of the on-going violence.

New laws enacted to protect all migrants in Mexico

It is not only the USA that has problems coping with undocumented or unauthorized migrants. More than 300,000 immigrants pass through Mexico each year on their way from Central America to the USA. Mexico actively patrols its southern border to limit the number of Central Americans who succeed in reaching the interior of the country.

Now, a new federal law expressly recognizes and protects the human rights of all migrants in Mexico, regardless of their place of origin, nationality, gender, ethnicity, age and immigration status. The new law guarantees access to basic services such as health and education. It comes in the wake of the horrific discovery in northern Mexico in recent months of several mass graves of migrants, mainly originating from Central America. The graves are believed to be linked to people-trafficking operations, known to be a source of revenue for drug cartels.

Drug gangs and the price of limes

One unexpected by-product of Mexico’s on-going drug wars in January 2011 was a steep rise in the price of limes, a quintessential ingredient of Mexican food and drinks. Prices in Mexico City quadrupled to almost four dollars a kilo ($1.80 a pound).

The interesting story behind the sudden increase in lime prices is given by Nacha Cattan in The Christian Science Monitor. An accompanying graphic shows how drug traffickers intervened in the normal supply chain, “extorting farmers, attacking produce trucks, or causing more time‑consuming border inspections”.

Most of the limes sold during winter months come from the semi-tropical orchards around Apatzingán, a town in Michoacán, western Mexico. Local truckers have to pay drug gangs up to 800 pesos ($66) a truckload for safe passage. Thefts of fully-laden trucks rose 50% in some areas last year. Allegedly, the gangs also influence prices by limiting harvesting and restricting the operation of packing plants.

Fortunately for Mexican lime-lovers, the price of limes has since returned to normal, with drugs gangs switching their attention to the much more lucrative trade in avocados.

How long will drug-related violence in Mexico last?

Even the Public Security Secretary, Genaro García, has now stated publicly that Mexico’s war on drug cartels will not be over any time soon. He argues that Mexico’s campaign against the cartels is having success, but that organized crime and violence related to drug production and trafficking are unlikely to fall within the next seven years.

Previous posts about the geography of drug trafficking and drug cartels in Mexico:

Geo-Mexico: the geography and dynamics of modern Mexico discusses drug trafficking in several chapters. A text box on page 148 looks at trends in the drug trafficking business and efforts to control it. Buy your copy today to have a handy reference guide to all major aspects of Mexico’s geography!

An in-depth analysis of drug violence in Mexico from the University of San Diego’s Trans-Border Institute

 Books and resources  Comments Off on An in-depth analysis of drug violence in Mexico from the University of San Diego’s Trans-Border Institute
Mar 222011
 

The Trans-Border Institute (TBI) at the University of San Diego has published a very informative analysis of drug violence in Mexico which goes into far more depth than our short blog posts. The report is part of the TBI’s Justice in Mexico initiative, which is focused on crime, policing and the legal system in Mexico. The Justice in Mexico website provides public access to several books and working papers, databases and specially-drawn maps, produced by the project’s researchers.

Drug Violence in Mexico: Data and Analysis Through 2010, authored by Viridiana Ríos and David Shirk, takes a close look at both the patterns and trends relating to drug violence. The full text of the 21-page report (as a pdf file) is available here.

The report includes numerous maps showing the pattern by municipality for several successive years; when seen in sequence, the shifting focus of drug violence is clearly apparent. A large number of additional maps showing state-level values can be accessed from the Resources on Drug Violence page. These maps use total values for each state, whereas most of the maps and statistics we have included in previous posts (here, here and here) use rates/100,000 people.

Ríos and Shirk balance the bad news about the increase in drug violence in Mexico with their assessment that Mexico’s war against the drug cartels is beginning to show some signs of (limited) success. They point, for example, to the gaps created in the leadership structures of several cartels, due to the capture or killing of high-profile traffickers such as Teodoro “El Teo” García Simental, Edgar “La Barbie” Valdez and Nazario “El Chayo” Moreno.

The TBI report on drug violence includes a brief discussion of some of the  methodological issues connected to alternative and overlapping definitions, and to the various alternative sources of data. In particular, they consider the relative merits of official government figures and those compiled by Reforma, a national daily. Ríos and Shirk acknowledge that the recent provision of more comprehensive statistics by Mexico’s federal authorities represents a major improvement as regards transparency. Interestingly, the figures released by the government in January 2011 are far higher than those compiled by Reforma.

The TBI investigators are not alone in puzzling over the quality of the data for drug-related violence. A recent Spanish-language article elsewhere, by José Merino, compared the number of drug-war deaths recorded in the government figures to the total number of homicides (drug-related or not) in a database managed by INEGI, the National Statistics Institute, based on death certificates in each municipality. Merino identified 105 municipalities (out of 2,456 nationwide) where the total number of drug-related homicides appeared to be higher than the total number of all homicides. The most extreme case in Moreno’s comparison was the discrepancy of 199 homicides in the case of Culiacán, the capital of the state of Sinaloa. The INEGI database showed 1,104 homicides in total, while the federal government figure, for drug-related homicides only, was 1,303.

Feb 092011
 

Previous posts in this mini-series analyzed the recently released data on drug war deaths for Mexican states, the largest cities, and the communities with the highest death rates per 100,000 population. This post looks into the number and rates of drug war deaths for 25 communities with large numbers of non-Mexican (ex-pat) residents or visitors. Drug war deaths include deaths of drug cartel members, law enforcement personnel, and innocent by-standers.

Drug war death rates of larger communities of particular ex-pat interest were addressed in an earlier blog which focused on municipalities with populations over 750,000. The table (link above) indicates the number drug war related deaths (from December 2006 through December 2010) and the rate per 100,000 population in the 25 municipalities.

In general, these municipalities have death rates below the national average. The rates for Xalapa, La Paz, and Los Cabos are less than one eighth the national average. Those for Guanajuato and San Miguel de Allende are almost as good. Apparently, foreigners in these communities have relatively little to worry about with regard to drug war violence.

Only six of the 25 have death rates above the national average. Mazatlán has the highest drug war death rate, about four times the rate for all of Mexico, but still less than a fourth that of Ciudad Juárez. The rate for Playas de Rosarito is also very high, even higher than that of its northern neighbor Tijuana. Interestingly, its southern neighbor Ensenada has a low rate, about one eighth that Playas de Rosarito.

The drug war death rate for Tepic, Nayarit is over twice the national average. The rates are also relatively high for Cuernavaca and Nuevo Laredo. Actually, the rate for Nuevo Laredo is less than most of the smaller municipalities surrounding it. There is considerable variation among three adjoining municipalities near Lake Chapala: Ixtlahuacan (43.8), Jocotepec (28.5) and Chapala (18.4). All three have rates many times higher than the nearby city of Guadalajara (9.7).

I wonder how much these drug war death rates are affecting or will affect the choices that foreigners make concerning where to live or where to vacation in Mexico?

Previous posts in this mini-series:

Related posts about the geography of drug trafficking and drug cartels in Mexico:

Geo-Mexico: the geography and dynamics of modern Mexico discusses drug trafficking in several chapters. A text box on page 148 looks at trends in the drug trafficking business and efforts to control it. Buy your copy today to have a handy reference guide to all major aspects of Mexico’s geography!

Is drug war violence concentrated in Mexico’s largest cities?

 Updates to Geo-Mexico  Comments Off on Is drug war violence concentrated in Mexico’s largest cities?
Feb 012011
 

It is commonly believed that crime and murder rates are highest in the largest cities. Is this the case for Mexican drug war deaths? Recently available data (from Mexican government) on drug war deaths indicate that this generalization is definitely NOT TRUE for Mexico’s largest cities. Drug war deaths include deaths of drug cartel members, law enforcement personnel, and innocent by-standers.

True, the largest numbers of deaths were recorded in some of the larger cities: Ciudad Juárez (6,637 deaths), Culiacán in the state of Sinaloa (1,890), Tijuana (1,667), Chihuahua City (1,415), and Acapulco (661). On the other hand, the number of deaths per 100,000 population was four to five times higher in some small municipalities in the states of Chihuahua, Sonora, Tamaulipas, and Nuevo León. A future post will take a more in-depth look at the drug war death rates in these smaller communities.

In this post, we consider only those Mexican municipalities whose 2010 population exceeded 700,000. The table below indicates drug war death rates per 100,000 population since December 2006 for the 22 Mexican municipalities with 2010 populations over 700,000. It is no surprise that the rate for Ciudad Juárez (484.7) is the highest, about 16 times the national average of 30.8. The city accounted for about 30% of the country’s drug war deaths during the four year period. In general, the cities with the highest rates are in the northern or western areas with concentrated drug cartel activity. However, Saltillo in the northern state of Coahuila has one of the lowest rates.

Only six of the largest 22 municipalities in the table have death rates above the national average. Monterrey is just below the average, Guadalajara is less than a third the average and Mexico City is less than a quarter. Two Mexico City suburbs, Nezahualcoyotl and Ecatepec in the State of Mexico, have rates nearly twice that of the capital, but are still less than half the national average. Zapopan, a suburb of Guadalajara has a rate 36% higher than Guadalajara.

Puebla, the center of the fourth largest metropolitan area in the country has an extremely low rate, less than 3% of the national average. Querétaro and Mérida also have very low rates.

Our next post in this mini-series will look at the smaller municipalities which tend to have the highest drug war death rates of all.

Previous posts in this mini-series:

Related posts about the geography of drug trafficking and drug cartels in Mexico:

Other relevant link

Geo-Mexico: the geography and dynamics of modern Mexico discusses drug trafficking in several chapters. A text box on page 148 looks at drug trafficking business and efforts to control it. Buy your copy today to have a handy reference guide to all major aspects of Mexico’s geography!

The impacts of the US border wall with Mexico

 Books and resources, Teaching ideas  Comments Off on The impacts of the US border wall with Mexico
Jan 162021
 
Judy King cover

This Guardian article – ‘My neighbourhood is being destroyed to pacify his supporters’: the race to complete Trump’s wall – highlights the problems created (not solved) by US efforts to build a wall along its southern border.

Geo-Mexico is reader-supported. Purchases made via links on our site may, at no cost to you, earn us an affiliate commission. Learn more.

Judy King coverFor what it’s worth, here is my own take on the wall, written a few years ago as a short chapter for Judy King’s book, Echoes from the Wall: Real Stories of Mexican Migrants (Mexico Insights, 2019). The majority of King’s book is based on her one-on-one interviews with a varied and fascinating selection of Mexican migrants who at one time or another lived and/or worked in the US. King’s personal, in-depth approach was time consuming but was amply rewarded and she acquired some extraordinary individual accounts. The book also includes short “backgrounders” on the history of Mexican-US migration and the practicalities involved.

My chapter focused on the geography related to the wall building.

The Border Story: the effects of a barrier wall (written in 2018)

The U.S.-Mexico border is unique in terms of its geography. It is the longest land border in the world between a developed economy and an emerging economy. The continental U.S.-Mexico border (excluding offshore limits) is about 1990 miles (3200 km) long. At roughly the mid-point, the cities of El Paso and Ciudad Juárez face each other across the boundary line. East of these cities, the border follows the course of the Río Grande (Río Bravo as it is known to Mexicans) to the Gulf of Mexico; west of these cities, it crosses the Sonoran desert to reach the Pacific Ocean between San Diego and Tijuana.
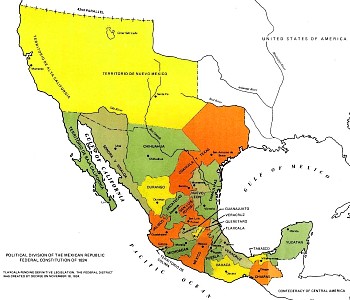
Map of Mexico, 1824

Map of Mexico, 1824

This boundary was established in the middle of the 19th century. After the Mexican‑American War (1846‑1848) the 1848 Treaty of Guadalupe Hidalgo ceded over half of Mexico’s territory to the USA. A few years later, under the 1853 Gadsden Purchase (Treaty of La Mesilla), northern portions of Sonora and Chihuahua were also transferred to the USA. This more or less established the current border between the two countries.

Minor disputes have occurred since due to the constantly migrating meanders of the Río Grande/Bravo. Flooding during the early 1860s moved the river channel south, shifting an area of about 2.6 square kilometers (1 square mile) from Ciudad Juárez in Mexico to El Paso in the U.S. Both countries claimed the area, giving rise to the El Chamizal dispute. This dispute went to international arbitration in 1911 and was only finally resolved in 1963 with the ratification of the Chamizal Treaty by President John F. Kennedy and his Mexican counterpart, Adolfo López Mateos.

A permanent memorial to Chamizal was established in El Paso in 1966 to commemorate the two nations’ laudable international cooperation, diplomacy and respect for cultural values in arriving at a mutually acceptable resolution to the conflict. A later dispute about changes in river meanders – the Ojinaga Cut – was amicably resolved in 1970.

There are about fifty places where people can legally cross the U.S.-Mexico States border but only one where the cities on either side of the border have the same name: Nogales. Historically, straddling the international border was not a drawback to residents of the “Two Nogales” (Ambos Nogales).
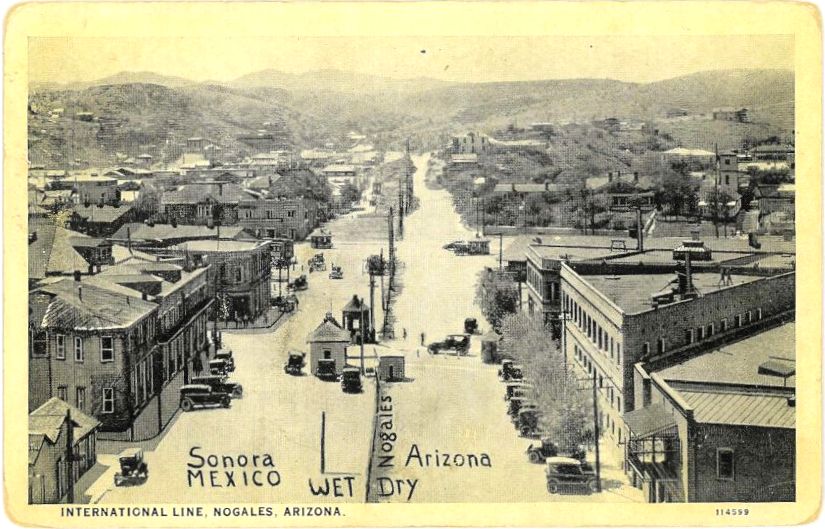
Postcard of Ambos Nogales, ca 1915

Postcard of Ambos Nogales, ca 1915

A century ago, one street in Nogales – International Avenue – actually ran east‑west along the border, with one side of the street in the U.S. and the other in Mexico. Even before a boundary fence was erected down the middle, residents were apparently still required to cross at one of two entry points: either the Morley Avenue crossing or the Grand Avenue crossing. The 60-foot-wide avenue had been created in 1897 after all buildings close to the border were razed to the ground as a way of limiting customs fraud. A permanent border fence was built in 1918 following the Battle of Ambos Nogales (La batalla del 27 de agosto).

During the prohibition years (1919-34) in the U.S., Mexican cities close to the border benefited from an influx of free-spending visitors. These years were boom times for the bars, casinos, brothels and race tracks of cities such as Ciudad Juárez and Tijuana. These cities also did well during World War II, when many of the large number of U.S. military personnel stationed near the border were able to circumvent wartime rationing at home by hopping south.

Beginning in the mid-1990s, physical barriers (fences, walls) were erected along some sections of the border to try and stem the flow of migrants from Mexico. Other sectors are closely monitored via electronic sensors, drones, cameras and mobile and satellite surveillance systems. In total, about 30% of the border already has some form of barrier, physical or virtual.

Existing barriers have already made life very difficult in many places. For example, it used to be a ten minute walk for residents of Ejido Jacume in Baja California to cross the border into Jacumba Hot Springs, California, to go to school, work, shop or attend the health clinic. With the barrier, it is now a two hour drive via Tecate.

Most of the physical barriers already built are along the western half of the border (where California, Arizona and New Mexico meet Baja California, Sonora and Chihuahua), They aim to prevent undocumented crossings into the major cities, especially San Diego and El Paso. They have forced would-be migrants to take on crossing the border somewhere in the largely unpopulated Sonoran Desert west of Nogales. The arduousness of this trip has cost the lives of many, many migrants, with the number of deaths of border-crossers since 2004, in this section alone, averaging more than 200 a year.

One of the many ironies associated with demands to build more and higher barriers between the two countries, given their extremely close social and economic ties, is that there is a simultaneous demand (in other quarters) to ease the movement of people and goods across the border in order to boost tourism and facilitate trade. For instance, in December 2015, a 120-million-dollar pedestrian bridge, known as The Cross Border Xpress (CBX), opened to allow passengers living in California to walk across the border into Tijuana International Airport. This helped ease border congestion at the existing land crossings into Tijuana.

Similarly, U.S. and Mexican border officials have piloted joint customs inspection procedures to cut border-crossing times for freight by up to 80%. Trade between the two countries is worth 1.4 billion dollars a day. The first tests of the new joint system were at Laredo international airport in Texas (for vehicle, electronic and aerospace components being flown to eight cities in Mexico), the Mesa de Otay in Baja California (for Mexican farm products entering the U.S.) and San Jerónimo in Chihuahua (for computers and other electronic exports from Mexico). The project has been warmly welcomed by business representatives on both sides of the border.

Finding the right location to build any barrier/wall may prove harder than many would anticipate. While most existing sections of barriers along the western half of the border are located very close to the true boundary line, this is not possible east of El Paso where the boundary runs (theoretically) down the deepest channel of the Río Grande/Río Bravo. Here, a wall or barrier along the boundary is impracticable.

Several protected National Wildlife Refuge (NWR) areas sit on or astride the boundary. They include the Lower Rio Grande Valley NWR and the Santa Ana NWR in Texas, the the Tijuana Slough NWR in California, and the Cabeza Prieta NWR in Arizona (the 3rd largest national wildlife refuge in the lower 48 states) which is contiguous to the UNESCO-designated World Heritage site of El Pinacate y Gran Desierto de Altar Biosphere Reserve in Sonora. In west Texas, Big Bend National Park extends to the border where it meets the Cañon de Santa Elena National Park in Chihuahua.

Ecologists have grave concerns about animal migration corridors and the future of numerous trans-border species. Up to now, only rudimentary and superficial Environmental Stewardship Plans (ESPs) have been prepared for the border areas where barriers have been constructed. These ESPs almost invariably claim that any adverse impacts on plant and animal populations will be only short-term, even in the absence of any scientific studies assessing existing populations.

Barriers such as walls prevent some species from crossing the border and can separate existing cross-border populations into two distinct groups, reducing their viability and increasing the risks of in-breeding, reducing their resilience to changes in climate or food sources. One major study identified 93 currently endangered species likely to be affected by a wall, including jaguars, ocelots, Mexican gray wolves and Quino checkerspot butterflies. Black bears in Texas that currently migrate across the border annually will have their natural territory sliced in half, as will the pronghorn antelope herds further west. Several species, including the jaguar, arroyo toad, the cactus ferruginous pygmy owl (which flies close to the ground) and Peninsular bighorn sheep, have critical habitats either side of the border.

People, too, have cross-border territories. Spare a thought for Native American groups such as the Tohono O’odham people whose ancestral lands now lie on either side of the Arizona-Sonora border. Their divided territory originated in 1853 with the Gadsden Purchase. Most of the estimated 25,000 Tohono O’odham alive today reside in Arizona but about 1500 live in northern Sonora. For decades, the two groups of Tohono O’odham, never granted dual citizenship, kept in regular contact for work, religious ceremonies and festivals, crossing the border as needed without any problem. Stricter border controls have made this impossible today.

Repeated efforts to solve the “one people‑two country” problem by granting U.S. citizenship to all registered members of the Tohono O’odham, regardless of their residence, have so far not succeeded. Ironically, because of its relatively remote location, the Tohono O’odham Nation has often been called upon to provide emergency assistance to undocumented workers (and drug traffickers) attempting to cross the border who have underestimated the severe challenges of crossing this section of the harsh Sonora desert.

Land ownership along any wall-building line is another issue. Building it on federal land is relatively easy, especially if the U.S. administration continues to utilize mechanisms that ignore, or they claim trump, dozens of existing environmental and cultural laws. Costs and protests rise where the planned barrier is located on privately-owned land.

Some sections of barrier have already been built in the wrong place. In 2008, for instance, one Native American human rights delegation reported that the official International Boundary obelisks marking the Arizona/Sonora boundary had been moved about 20 meters south during barrier construction, a clear violation of international law. Costs escalate still further whenever the barrier needs to be relocated.

The effective implementation of many cross-border agreements will be adversely affected by a barrier. For instance, the U.S. Forest Service and Mexico’s National Forestry Commission have a co-operation agreement, the Bi‑national Convention on Forest Fires, for dealing with cross-border wildfires on the Arizona/Sonora border. It aims to increase public safety on both sides of the border, reduce habitat loss, and facilitate the fighting of wildfires. It allows for a united bi‑national command to be established and for firefighting brigades, together with supporting vehicles and aircraft, to cross the border by up to 16 km (10 miles) in either direction in order to battle ongoing wildfires, provided advance notice is given. With a wall, this is clearly impossible.

Quite apart from the cost implications and the potential adverse impacts for people, communities, trade and fauna in the border regions, building a wall is not the answer. Animals may not have a viable choice after a wall is built but if people still want to cross, and can’t do so by land, they will surely turn to the air, the oceans, or (as has already happened repeatedly with smugglers in both directions) underground tunnels.

In fact, despite fear-mongering news reports in the U.S. press, the flow of migrants over the past decade has actually reversed: the number of people now crossing the border from the U.S. to live in Mexico is higher than the number of Mexicans moving north. While some of the migrants moving south are Mexicans returning home, others are estadoudienses preferring to retire, live or work in Mexico.

Judy King’s Echoes from the Wall: Real Stories of Mexican Migrants (Mexico Insights, 2019) is available worldwide via Amazon. The case studies of individual migrants are excellent starting-points for geography classes about international migration in high schools and colleges.
Maps of Mexico on geo-mexico.com

 Index page, Maps  Comments Off on Maps of Mexico on geo-mexico.com
Dec 012015
 

This page lists some of the many maps on Geo-Mexico.com.

Want to use a map? All these maps [except those marked  (*)] are original Geo-Mexico.com maps. The use of any of Geo-Mexico’s maps for educational purposes is fine, provided credit is given to  Geo-Mexico.com. For commercial use (including business presentations, newsletters, magazines, books, TV), please contact us with details of your project via the link or the Contact Us form.

General / Educational:

Physical geography

Hazards:

Population

Economy

Regional and city maps

Crime:

History:

Other:

Mapping exercises:

 Tagged with:

Threats to the traditional Tarahumara way of life, part two

 Other  Comments Off on Threats to the traditional Tarahumara way of life, part two
Sep 132012
 

In the first part of this two-part article – Threats to the traditional Tarahumara way of life, part one – we looked at the threats to traditional Tarahumara life posed by alcohol, deforestation and the construction of new or improved roads in the Sierra Tarahumara (Copper Canyon) area.

In this part, we consider the impacts of drug cultivation, mining and tourism.

Drug cultivators and drug cartels

The incursion of drug cultivators seeking land for growing marijuana and opium poppies into the Canyon country has further marginalized the Tarahumara, sometimes labelled “Cimarones” (“Wild Ones”) by the newcomers. Drug cultivators have sometimes registered parcels of land as theirs and then ejected the Indians by force. Obviously, they choose the best available land, and their cultivation methods are designed to produce quick results, rather than sustainability.

Alvarado (1996) divides anti-drug policy into various time periods. First came an emphasis on catching those responsible, then came exhaustive efforts to eradicate the crops. Crop eradication has its own serious environmental downside, since it involves the widespread and indiscriminate use of aerially-applied herbicides, alleged to include Agent Orange, Napalm and Paraquat.

Alvarado’s study is an interesting analysis of the incredible, quickly-acquired wealth (and accompanying violence and corruption) that characterizes some settlements on the fringes of the Sierra Tarahumara. In some towns, for example, there are few visible means of economic support but the inhabitants are able to purchase far more late-model pick-ups than can their counterparts in major cities. Murder rates in these towns are up to seven times the Chihuahua state average. Violence even has a distinct, seasonal pattern, with peaks in May-June (planting time) and October-November (harvest time).

The levels of violence and injustice led Edwin Bustillos (winner of the 1996 Goldman Prize for Ecology) to change the focus of CASMAC, the NGO he directed, from environmental conservation to the protection of Tarahumara lives. In 1994, CASMAC was instrumental in stopping a 90-million-dollar World Bank road-building project that would have opened up still more of the Sierra Tarahumara to timber companies.

Mining

Besides deforestation and its resultant impacts, mining has had several other adverse effects on the Tarahumara and the local landscape. Mining activity has increased in the past decade as metal prices have been high and the federal government has encouraged foreign investment in the sector. Mining leads to a reduction in wildlife and to the contamination of water resources. The most damaging pollutants are heavy metals.

Tourism

Even tourism poses a potential threat. In the past decade, investments totaling 75 million dollars have been made to improve infrastructure (highways, runways, drainage systems, water treatment facilities, electricity) in the Copper Canyon region so that the area has the hotels, restaurants and recreational activities to handle six times the current number of visitors. The plan includes three remodeled train stations and a cable car that is already in operation. Sadly, the Tarahumara were not consulted. The plan essentially deprives them of some communal land with nothing being offered in exchange. Clearly, they are in danger of losing control over even more of their natural resources, especially since improved highways will benefit other groups such as drugs growers.

Anthrologist María Fernanda Paz, a researcher in socio-environmental conflicts at UNAM’s Regional Center for Multidisciplinary Studies, argues that these recent conflicts in the Copper Canyon region have stemmed from the federal government’s support for inflows of foreign capital, helped by modifications to the land ownership provisions enshrined in article 27 of the Constitution, changes made in 1992 during the administration of President Carlos Salinas de Gortari. In her view, the developers behind contentious projects first do everything possible to hide the project from public view until it is well advanced. Once people start to object, they then identify the community leaders and do everything possible to get them on their side. Before long, they have succeeded in creating a massive rift in the community, paying some very well indeed for their land, and others next to nothing.

Finally, the good news

The  Tarahumara recently (12 March 2012) won one of the greatest victories to date for indigenous peoples in Mexico. The Tarahumara (rarámuri) community of Huetosachi in the state of Chihuahua has now been recognized by Mexico’s Supreme Court as having long-standing indigenous territorial rights (but not formal ownership) that must be respected by the Copper Canyon Development Fund (Fideicomiso Barrancas del Cobre). This is truly a landmark victory. The Tarahumara have been guaranteed the right to be consulted over all Development Plans, and to select the benefits they will receive in exchange for any loss of ancestral territory. Finally, this juggernaut of a tourist development plan must respect the territories and natural resources of the Tarahumara.

This was truly David against Goliath. Huetosachi is a tiny settlement of only 16 families, about 10 km from where the main tourist complex is being built near the Divisadero railway station. The village has no water, electricity or health services.

The Copper Canyon Development Fund is now obligated to create a Regional Consultative Council allowing the villagers of Huetosachi and other settlements a say in the negotiations to decide what level of development is acceptable, and what the villagers expect in return. This council is expected to include representatives of 27 indigenous communities in the immediate area between Creel and Divisadero.

This landmark court decision could well be the first of many as indigenous groups elsewhere in Mexico fight their own battles against developers of various kinds. There could still be more court cases concerning the Copper Canyon region since it is widely expected that this initial success will lead to a legal challenge against the siting of the cable car. The villagers are also reported to be discussing how best to deal with water contamination allegedly resulting from existing hotels, and the possibility of a golf course being built on the canyon rim.

Sources:

  1. Alvarado, C.M. (1996) La Tarahumara: una tierra herida. Gobierno del Estado de Chihuahua. Somewhat repetitive academic analysis of the violence of the drug-producing zones in the state of Chihuahua, based in part on interviews with convicted felons.
  2. Merrill, W.L. (1988) Raramuri Souls – Knowledge and Social Progress in North Mexico. Smithsonian Institution, Washington D.C.
  3. Nauman, T. (1997) “Tala ilegal para la siembra de mariguana y opio en Chihuahua” p. 50 in El Financiero, May 12, 1997. Describes the Arareko project.
  4. Plancarte, F. (1954) El problema indígena tarahumara. INI. Mexico. Spanish language description published by National Indigenous Institute.
  5. Shoumatoff, A. (1995) “The Hero of the Sierra Madre” pp 90 – 99 of Utne Reader (July-August, 1995), reprinted from Outside (March 1995). An account of the determined efforts by Edwin Bustillos to prevent further environmental destruction in the Copper Canyon region.

Related posts:

Threats to the traditional Tarahumara way of life, part one

 Other  Comments Off on Threats to the traditional Tarahumara way of life, part one
Sep 102012
 

The extreme isolation of the Tarahumara (until recent years) and their adaptation of some elements of the alien Spanish/Mexican culture have enabled them to survive in what most observers would regard as an extraordinarily hostile natural environment. The effects of this isolation are reflected in their culture, in their relatively equal gender roles in terms of their economy, their flexibility of work schedule, lack of economic specialization and their willingness to share available food when necessary to ensure survival.

Their isolation has also hindered the emergence of any well‑defined leadership system. A lack of any “official” hierarchy make it much more difficult to resolve any serious disputes. It has also meant that the shy and politically naive Tarahumara have found it difficult to counteract intruders, whether they are government officials or drug‑dealers. As more roads are improved, even the furthest, most remote sanctuaries, of the Tarahumara come under threat.

Some Tarahumara have adopted more mestizo culture than others; the “gentile/baptized” distinction, first recognized by Lumholtz, with all its associated differences in settlement patters and lifestyle arose from the resistance of many Tarahumara to the imposition of a Spanish/mestizo culture that they considered “alien”. The more traditional Tarahumara still prefer to live in relative isolation and not to resettle into fixed villages where there would be insurmountable pressure on their culture.  The mestizos in the Copper Canyon region, who occupied the best land by force and formed villages in the European‑derived tradition, have far more links with modern Mexico, and have preserved their economic dominance over the Indians.

None of this means that the traditional Tarahumara way of life has remained unchanged or will not continue to undergo modifications in the future. Any changes to the environment can have serious adverse impacts on their abilities to find sufficient food. The main drivers of environmental change have been drug-growing, forestry, mining and tourism.

In addition, they have to manage changes which, to some extent, have been thrust upon them by some of the government and other efforts aimed at helping them. For example, modern medicine and education threaten to change the Tarahumara population balance. Today, more infants survive to adulthood and fewer adults die as a result of accidents. The problem for the Tarahumara is how to feed and support an ever‑growing population using existing methods of cultivation and herding.

Alcohol

Equally important is the transformation of the traditional Tarahumara system of wants by contact with mestizos. Prior to these contacts, the Tarahumara had little or no access to commercially-made alcohol. Tarahumara tesgüino took considerable time and effort to make and had to be consumed rapidly, meaning that Tarahumara could get drunk occasionally, but could not remain drunk for long. The ready availability of commercial alcohol has completely changed this dynamic.

Slightly over a decade ago, an innovative, women-led project reportedly changed the 3500-inhabitant community of Arareco (8 km from the town of Creel) for the better. Kari Igomari Niwara, a 200-member women’s organization, began in 1992, and is celebrating its 20th anniversary this year. It has often been quoted as an outstanding example of what the Raramuri (Tarahumara) can do if left to their own devices and allowed to control their own resources. In this project, they have sought encouragement and support, rather than direction and dependence. By 1997, Kari Igomari Niwara had organized a health center, primary school, bilingual literacy program, drinking water system, bakery, three small food supply stores, a handicrafts business, a restaurant and collective transportation for the village.

One of the first collective efforts of the Kari Igomari Niwara group was to get the cantinas (bars) of Creel closed at 4pm in the afternoon, so that their husbands wouldn’t get so drunk. Almost 70% of Arareco women reported having been beaten by their husbands, the vast majority of attacks coming when their husbands were drunk. After the initial cantina victory, the men became even more repressive, but the women persisted and four years later managed to persuade the church to build them a small health center despite the objections of their local male-dominated council. The women have already reduced nutrition-related infant mortality to 25% of its former level and have brought birth rates down by 50%  (Nauman, 1997).

Deforestation

The deforestation of the Copper Canyon region has a long history and has significantly changed the resource base of the Tarahumara to the point where their traditional way of life in the canyons is probably impossible to sustain in the future. Deforestation was started by mining companies who cut trees to make pit props and burn as fuel. In the 1890s, the region started to supply timber to the USA, via concessions given by Chihuahua state governor Enrique Creel to companies such as the Sierra Madre Land and Lumber Company, owned by William Randolph Hearst. Today, many of the local ejidos continue to cut more timber than they can ever replant, and there are more sawmills in operation than could ever be sustainable.

In many places, there are clear signs of the immense environmental destruction wrought by timber cutting, often on slopes so steep that there is little chance of reforesting them in the future. Soil erosion is rampant in some areas and satellite imagery reveals huge areas that are no longer forested.

Recent droughts have not helped, and one NGO, Alternative Training and Community Development (ALCADECO) has explored their links with deforestation and migration. The NGO’s director, Laura Frade, argues that the long-term effects of drought go far beyond the obvious. Poor crops in times of drought results in the abandonment of traditional lands. Families become dependent on poorly-paid jobs in the timber industry, or on drug plantations, or dependent on the sale of handicrafts to tourists. Many of those that fail to make ends meet then become the unwilling recipients of blankets and food from charity organizations. Others move to cities like Chihuahua, where they try to survive by begging or turn to alcohol.

New and improved roads

The development of forestry required the development of roads and vehicle tracks. Road development continues to this day and is not necessarily a beneficial thing. Improved road access has opened up new areas for lumbering, mining and tourism. In turn, small stores spring up, even in remote areas, selling mestizo items such as radios, carbonated drinks, cigarettes, and manufactured clothing. The use of money has become more widespread. Better roads have enabled traders to build a credit relationship with Tarahumara Indians, offering them non-traditional goods in exchange for a share of the next maize harvest. This has led to typical problems of indebtedness and exploitation.

Further reading:

Sources:

  1. Lartigue, F. (1970) Indios y bosques. Políticas forestales y comunales en la Sierra Tarahumara. Edicions de la Casa Chata # 19, Mexico.
  2. Lumholtz, C. (1902) Unknown Mexico. 2 volumes. Scribner’s Sons, New York. Republished in both English and Spanish. Fascinating ethnographic account from the last century.
  3. Nauman, T. (1997) “Tala ilegal para la siembra de mariguana y opio en Chihuahua” p. 50 in El Financiero, May 12, 1997. Describes the Arareko project.
  4. Vatant, Francoise. La explotación forestal y la producción doméstica tarahumara. Un estudio de caso: Cusárare, 1975-1976. INAH, Mexico.

Related posts:

The diffusion of violence in Mexico since the early 1980s

 Mexico's geography in the Press  Comments Off on The diffusion of violence in Mexico since the early 1980s
Nov 122011
 

Today, we take a quick look at Mexico, the Un-Failed State: A Geography Lesson, published on the InSight Crime website. InSight Crime’s stated objective is “to increase the level of research, analysis and investigation on organized crime in Latin America and the Caribbean.”

diffusion of violence in Mexico

Credit: InSightcrime.org

Gary Moore, the author of Mexico, the Un-Failed State: A Geography Lesson, considers some of the claims made recently about Mexico being a “failed state”, where parts of the country are effectively no longer under government control. As the title of article suggests, Moore does not find evidence to support these claims.

His position is set out early in the article when he writes that, “The statements are all serious assessments of an elusive reality. The violence in today’s Mexico forms a twilight zone. It is not an all-consuming apocalypse, but it is also not the relative peace of Mexico a generation ago.”

The article is illustrated by three maps, “snapshots” of the situation in the early 1980s, in 2006-2008 and in 2011. While these appear to show that there has been a significant expansion of violence across Mexico in recent years, some caution is needed since the evidence used for each map is entirely different.

Moore’s article is a useful overview of how and why violence has diffused across much of Mexico since President Felipe Calderón declared a “war on drugs” in December 2006. It is, though, only an overview. There are significant local differences even within those states (such as Tamaulipas and Chihuahua) which are considered to be among the worst for drug violence in the country.

Few analysts would disagree with the article’s concluding statements that:

“In the 1970s it was natural to assume that these throwback “bandido” areas were shrinking and would soon disappear, as the march of development brought education, opportunity and civilization.”

“The harsh news from the drug war is that the reverse has occurred. The landscape of no-go zones has swelled across Mexico, as at no time since the Mexican Revolution of 1910-1920.”

The Mexican Revolution threw Mexico into convulsions for more than a decade, and the war on drugs looks set to last at least as long.

Related posts:


Are homicide rates in Mexico increasing? Perhaps, but…

 Other  Comments Off on Are homicide rates in Mexico increasing? Perhaps, but…
Aug 252011
 

This question is far more complicated to answer than might initially appear. To start with there are two primary sources of homicide data in Mexico which provide very different results and vary significantly from state to state and year to year.  The National System of Public Security (SNSP) compiles homicide statistics from police reports and investigations.  The National Institute of Statistics and Geography (INEGI) obtains homicide data from death certificates reported through the Ministry of Health. For 2010, SNSP reported 35,053 homicides in Mexico, while INEGI – Reporta el INEGI más de 24 mil muertes en 2010 – reported 24,374 homicides.

For a very interesting comparison (in Spanish) of trends over time for these two data sources, including a detailed look at the trends in some individual states, see:

For two earlier posts using SNSP data, see:

What factors may explain why the data is so different?

The terminology associated with homicides is very complex. This is equally true in English and Spanish. Even the basic subcategories do not necessarily match closely from the legal system in one country to that in another. Legal definitions and classifications depend in part on subjective decisions by officials concerning such things as the perpetrator’s motive, intent and state of mind.

In general terms, homicide (homicidio) means the deliberate killing of one person by another. A homicide may be either an:

  • intentional homicide or murder (homicidio doloso) or an
  • involuntary homicide, negligent homicide or case of manslaughter (homicidio culposo)

In some jurisdictions, intentional homicides are further divided into such categories as “first degree murder” and “second degree murder”.

The data associated with homicides are at least as complicated as the legal definitions. Statistics originating from police records will never exactly match those coming from death certificates or public records. For instance, some individuals may have been recorded originally as dying from accidents, natural causes or suicide on their death certificates, but then shown later to have been intentionally killed (murdered) and therefore counted in police records as murder victims. There are numerous possible scenarios in which the police data will differ from the data recorded on death certificates.

Differences in terminology, definitions and application may explain some of the differences in the two data sets, but is very unlikely to explain 100% of such significant differences, so care is needed before drawing any conclusions about Mexico’s homicide rate.

What do the figures for homicides suggest?

In 2000, INEGI, Mexico’s National Statistics Agency, recorded 10,743 homicides in Mexico. This number dropped gradually to 8,897 in 2007 before jumping up to 14,006 in 2008, 19,803 in 2009 and leaping  23% in 2010 to 24,374. Current information suggests the number of homicides will be at least as high in 2011.

The SNSP data have become significantly higher than INEGI data in recent years. They also show an increase in the number of homicides in 2010 (compared to 2009), but of only 11%.  Both data sets indicate a rapid increase. This is especially troublesome given that murder rates had declined rather steadily up until the “drugs war” started in earnest in 2007.

If we average the INEGI and SNSP numbers, it suggests that the overall 2010 homicide rate was about 27 per 100,000 population.

How does Mexico’s murder (intentional homicide) rate compare to that in other countries?

Wikipedia’s list of intentional homicide (murder) rates claims that Mexico’s murder rate in 2010 was 15 per 100,000. SNSP data for Mexico show 2010 figures of 18 per 100,000. Either of these figures is very high compared to Canada (1.6 per 100,000), Peru (3.2) or the USA (5). On the other hand, Mexico’s homicide rate is rather low compared to Honduras (78), El Salvador (65), Venezuela (48), South Africa (34) and Brazil (25). In 2007, Mexico’s murder rate was about 8.4 per 100,000, very close to the world average.

How many of Mexico’s murders are drug-war related?

Data released last January by the Mexican government indicated that drug-war deaths increased in 2010 by 5,659 from 9,614 to 15,273. These data suggest that 63% of Mexico’s intentional homicides in 2010 were related to drug violence compared to only 49% in 2009, 28% 2007 and roughly 10% in 2006. In fact, non-drug-war-related intentional homicides in Mexico appear to have declined 11% from 10,189 in 2009 to 9,101 in 2010, less than the total number of homicides in any year from 2000 through 2006.

This brings us back to our original question, “Are homicide rates in Mexico increasing?” Yes, they are increasing, but only as a result of the much publicized “war on drugs”. It is likely that if there was no drugs war, then Mexico’s homicide rate would be continuing to decline, consistent with its long-term trend.

Related posts, relying on data issued by the Office of the President of Mexico:

Believe it or not, homicide rates in Mexico have actually declined since 1997

 Updates to Geo-Mexico  Comments Off on Believe it or not, homicide rates in Mexico have actually declined since 1997
Sep 202010
 

All the recent media attention to drug war violence suggests that homicide rates in Mexico are increasing rapidly. This is undoubtedly true, but only in certain areas. The available data from the Mexican National Public Security System (SNSP) does not uniformly support the contention that homicide rates are on the rise.

SNSP data show that Mexico’s homicide rate has declined by 23% since 1997. It declined for 20 of Mexico’s 32 states.  According to SNSP, the national homicide rate of 37 per 100,000 population declined by 36% to 24 in 2007, before edging up 20% to 29 in 2009, the most recent year for which data available. However, since 2007 the homicide rate has declined in nine states. Clearly, there are enormous differences in homicide rates among Mexico’s states. A future blog will focus on states with low and declining homicide rates.

The increases in some states since 2007 may well be related to drug war violence. The estimated 28,000 drug war deaths reported in the media is significant compared to the 111,000 homicides in Mexico for the four year period 2006–2009.

The states with homicide rates above 40 in 2009 and which have increased since 2006 are shown in the table. Undoubtedly, drug war violence is an important factor in many of these states, particularly Chihuahua, Durango, Sinaloa, Guerrero and Michoacán.

StateHomicide rate per 100,000 population, 2009Increase, 2006–2009 (%)
Durango89865
Chihuahua86177
Sinaloa7540
Guerrero6355
Morelos6046
Michoacán5755
Quintana Roo52124
ALL MEXICO2920

International comparisons are difficult due to differences in definitions and in data collection methods. For example, the fatal shooting of an intruder, death committed in self-defense, or death caused by  a drunk driver may count as a homicide in some countries and not in others. In rough terms, data appear to show that homicide rates in Mexico are about four times those in the USA, but less than half of the rates in Colombia or South Africa.

Narco-related killings in Mexico, 2006-2010

 Mexico's geography in the Press, Updates to Geo-Mexico  Comments Off on Narco-related killings in Mexico, 2006-2010
Jul 162010
 

The alarming situation in Mexico with regard to drug-related violence has led the Wall Street Journal to prepare an interesting interactive graphic.

The graphic shows narco-related killings from 2006 to 2010. The slider allows you to see the pattern for each year. Hovering over the proportional circles used to represent the deaths in each state brings up the exact number.

While drug-related violence is not new, it is clearly intensifying and now affecting areas of the country where it was traditionally very rare.

Chapter 20 of Geo-Mexico: the geography and dynamics of modern Mexico includes a brief section about the geography of drug trafficking. It focuses mainly on the spatial changes in supply systems. Buy your copy today, so you have this handy reference guide to all aspects of Mexico’s geography available whenever you need it.