Slight decrease in the number of “Los Ninis” in Mexico

 Mexico's geography in the Press, Updates to Geo-Mexico  Comments Off on Slight decrease in the number of “Los Ninis” in Mexico
Feb 092015
 

Los ninis are young people (aged 15-29) that “ni trabaja, ni estudia” (neither work nor study). They have become the focus of much press attention in the past few years, often accompanied by the phrase “Mexico’s lost generation”.

nini-logo

According to a recent OECD report, “Education at Glance 2015”, two out of every ten Mexicans in the 15-29 age group neither studied nor worked in 2013, the latest year for which there is data. The report found that 22.3% of Mexican in that age category were ninis, a slight decrease compared to 25.0% in 2011. After population increase is taken into account, Mexico has about 200,000 fewer ninis than in 2011.

Mexico’s percentage of ninis is above the average for all 34 OECD member countries, and is the fifth highest among OECD members, after Turkey (31.3%), Greece (28.5 %), Spain (26.8 %) and Italy (26.1 %). Very few of Mexico’s 7.3 million ninis (only 3.8%) are technically “unemployed”; most ninis have not actively sought work and are therefore considered “inactive”.

In Mexico, most ninis are female. For example, in the 20-24 age group, around 10% of males are ninis, compared to 40% of females.

The figure of 7.3 million will no doubt again be disputed by Mexico’s Secretariats of Education (SE) and of Labor and Social Welfare. In 2011, the Secretariats issued a joint rebuttal of the OECD figure, and claimed that 78% of those reported by OECD as ninis were young married women, with children, who dedicated themselves to home-making. The Secretariats emphasized that the figures revealed a gender inequality in access to educational and economic opportunities, linked to cultural patterns where many young women still saw marriage and motherhood as their preferred or only option.

Related posts:

Dec 082014
 

Every so often, a news article comes along which rattles our perceptions, causes us to think, and begs us to discuss big issues. This is one of those times.

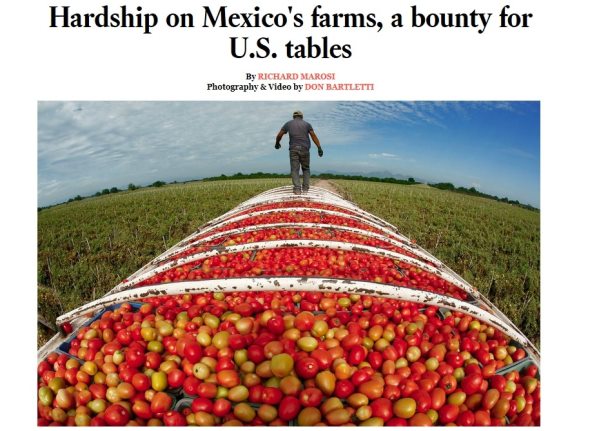
Los Angeles Times reporter Richard Marosi and photojournalist Don Bartletti traveled across nine Mexican states, observing conditions and interviewing workers at some of the mega-farms that have powered the country’s agricultural export boom.

The resulting article, the first of a four-part series, was published yesterday in the Los Angeles Times, and offers lots of potential for serious discussions in geography classes around the world about agribusiness practices, supply chains, the persistence of inequalities, and a host of other issues. The article is accompanied by some great photographs and short, informative videos.

la-times-article

In “Hardship on Mexico’s farms, a bounty for U.S. tables“, Marosi and Bartletti find that thousands of laborers at Mexico’s mega-farms endure harsh conditions and exploitation while supplying produce for American consumers.

This is a must-read series for anyone interested in the Geography of Mexico, and we can’t wait to see the next three parts of this series.

Related posts:

Sep 182014
 

Which countries have the most promising crops of leaders coming up through the ranks today, and where in the world are there more young people likely to develop into business leaders tomorrow? And how can leadership be measured at all? SHL, a U.K.-based talent management consulting firm, released a study in 2012 that aims to provide answers to those questions.

SHL is a giant in the world of employee assessments, with more than 10,000 clients in over 100 countries. It offers services to consultancies like Deloitte and KPMG, multinationals like Unilever and organizations like the United Nations and the European Personnel Selection Office.

Ranking Effective Leaders Today Potential
Leaders of Tomorrow
Ranking change
between leaders for today and leaders for tomorrow
1-25 Country %  Country %   ↑or↓
1 Hong Kong 14% Mexico 54% 21↑
2 Germany 13% Turkey 50% 16↑
3 United Kingdom 10% Egypt 44%  New entry
4 Australia ∞ 10% Switzerland 43% 2↑
5 United States 10% Brazil 42% 19↑
6 Switzerland 10% India 41% New entry
7 Canada 10% Italy 41% 10↑
8 Japan∞ 9% United States 41% 3↓
9 Singapore ∞ 9% Germany 40% 7↓
10 New Zealand ∞ 8% Netherlands 40% New entry
11 Sweden 7% Taiwan 39% 1↑
12 Taiwan ∞ 7% United Arab Emirates 39% 9↑
13 France∞ 7% Denmark 39% 10↑
14 Thailand 7% Sweden 37% 3↓
15 Finland ∞ 7% Portugal 37% New entry
16 Belgium ∞ 7% Russia 37% New entry
17 Spain 6% Spain 37% No change
18 Turkey 6% Ireland 37% New entry
19 Italy 6% Indonesia 37% New entry
20 South Africa ∞ 6% China (Hong Kong) 37% 19↓
21 United Arab Emirates 6% United Kingdom 37% 18↓
22 Mexico 6% Norway 36% 3↑
23 Denmark 5% Poland 35% New entry
24 Brazil 5% Canada 35% 16↓
25 Norway 5% China (Mainland) 34% New entry
∞ Indicates those counties ranked in the top 25 leaders today that fall out of the top 25 for leadership potential tomorrow
“New entry” = countries not ranked in the top 25 today but listed in the top 25 for leadership potential tomorrow
 

This year, executives at SHL decided to mine data from past employee assessments and try to shed some light on the leadership potential in the many countries where it works. The SHL data came from 1.05 million client surveys gathered between 2006 and 2011. It focused on eight different skill areas to measure leadership capability: initiating activity and deciding, supporting and cooperating, interacting with and presenting to others, analyzing and interpreting data, creating and conceptualizing ideas, organizing and executing plans, adapting and coping with others, and finally, performing and achieving.

In September 2012, SHL published a list of the countries it believes have the greatest percentage of effective leaders, and those that it sees as most likely to develop leaders within the next three to five years. The list of current leaders may not be that surprising. The report ranks the country with the most leaders today as Hong Kong (treated as a separate country, though it is a special administrative region of mainland China), followed by Germany, the U.K., Australia, U.S.A., Canada and Switzerland.

The country that emerges as that with the most future leaders is… Mexico. According to SHL, Mexico’s “market is becoming more international and its leaders are strengthening in several different categories.”

This is an interesting analysis, but only time will tell whether or not it holds much validity!

Many Mexican Bracero workers still trying to claim their pay

 Excerpts from Geo-Mexico, Updates to Geo-Mexico  Comments Off on Many Mexican Bracero workers still trying to claim their pay
Nov 302013
 

In response to severe labor needs during the second world war, the governments of Mexico and the USA initiated the Bracero guest worker program in 1942. The program enabled Mexico to contribute to the war effort by sending temporary agricultural workers to the USA. Mexicans were granted renewable six month visas to work on selected farms. Most migrants under the Bracero program came from the same three states, Michoacán, Jalisco and Guanajuato. They worked mostly in California and other states along the Mexican border.

Los BracerosAs a result of the Bracero program, some farmers in the USA became very dependent on relatively cheap Mexican labor. The program was considered a great success by farmers. Unfortunately mistreatment of Bracero laborers was widespread. In protest, the Mexican Government threatened to stop the flow of migrants. During the war many Mexicans who were not recruited under the Bracero program entered the USA illegally looking for work. Tolerance for unauthorized migration developed on both sides of the border. With a large dependency in the USA on Mexican farm workers and a large supply in Mexico, there was virtually no way to put a halt to this migration stream.

Labor unions, churches and Latino groups in the USA opposed the Bracero program on the grounds that it held down farm wages and impeded the upward mobility of US Hispanics. They convinced the US Congress to halt the Bracero program in 1964. Between 1942 and 1964 an estimated 4.5 million Mexican Bracero workers entered the USA. At its height in the late 1950s more than 500,000 workers migrated each year. Most were temporary migrants who returned to Mexico within a year, often settling in larger cities, exacerbating the flow of migrants from rural areas to the growing cities. The Bracero program set the stage for the continued high volume of Mexican labor migration to the USA.

In an effort to ensure that the Bracero workers were only temporary migrants to the USA, the US government withheld 10% of all their earnings. The US government then remitted this amount to the Mexican government for payment to the workers on their return home. More than 70 years after the Bracero program started, many braceros are still trying to claim money that they earned legitimately years ago and that is still owed to them by the Mexican government.

The struggles of temporary bracero workers who were never repaid the 10% that had been withheld, are detailed in a short October 2013 article entitled “Bracero Guestworkers, Unpaid”, written by Adam Goodman and Verónica Zapata Rivera (history doctorate students at, respectively, the University of Pennsylvania and Mexico’s National Autonomous University).

The article also describes some of the other injustices faced by Bracero workers, including forced whole-body fumigation with DDT as they crossed the US border.

For more information about the Bracero program, see The Bracero Archive

Related posts:

Nov 022013
 

Innovation is an important ingredient of economic growth, especially growth in the decades ahead. While most people know what innovation is, it is not an easy concept to measure. Fortunately three different groups have attempted to measure it and compare countries on their “innovativeness”. All three rely on such measures as research and development, number of patents, number of researchers per person, manufacturing, and the percentage of college graduates with science and engineering degrees. However, the number and character of the specific individual variables they use are quite different. As a result their international rankings can be very different. The three approaches are briefly discussed below.

1. Bloomberg’s “Global Innovation Quotient” is based on R&D intensity (20%); manufacturing capability (10%); researcher concentration (20%); productivity (20%); High-tech density (20%); patent activity (5%) and tertiary (education) efficiency (5%).  [For more details, see Global Innovation Index (pdf)]

Bloomberg’s “Global Innovation Quotient”, for 96 countries, ranked Mexico ranked in 2012 as 46th, just behind Chile (41st) and Argentina (43rd), but ahead of Brazil (57th) and Venezuela (62nd). Other notable countries ranked as follows: Finland (1st), Singapore (2nd), USA (7th), Switzerland (8th), Canada (19th), Russia (22nd), Israel (29th) and China (32nd) and Indonesia (64th).

2. In 2009, a “Global Innovation Index” was produced by The Boston Consulting Group (BCG), the National Association of Manufacturers (NAM), and The Manufacturing Institute (MI). In March 2009, the Global Innovation Index ranked Mexico 57th. For comparison, it had Chile at 37th, Argentina at 92nd, Brazil at 72nd, and Venezuela at 108th.

These rankings are significantly higher than the Bloomberg rankings above because this index included more countries which pushed the Latin American countries lower down on the ranking list. But there are other important differences in how innovativeness was measured in the two studies. Compare the following rankings with the ones in paragraph above: Finland (7th), Singapore (1st), Switzerland (3rd), USA (8th), Canada (14th), Russia (49th), (Israel 16th), China (27th) and Indonesia (71st).

3. The third index, confusingly also called the “Global Innovation Index”, is published jointly by Cornell University, INSEAD (The Business School of the World) and the World Intellectual Property Organization (WIPO).

global-innovation-index-2013This very complicated index is based on six pillars (Institutions, human and capital research, infrastructure, market sophistication, business sophistication, knowledge and technological outputs and creative outputs.), each with sub-pillars, and a total of 84 indicators. Of the 134 countries analyzed in 2012, Mexico ranked 79th, way behind Chile (39th) also lagging behind Brazil (58th) and Argentina (70th), but way ahead of Venezuela (118th). This complex index’s rankings are different from but generally align with the two other indices: Finland (4th), Singapore (3rd), USA (10th), Switzerland (1st), Canada (12th), Russia (51st), Israel (17th) China (34th) and Indonesia (100th).

Conclusion

These three indices appear to tell us that Mexico is relatively weak when it comes to innovativeness. Mexico, along with Brazil and India, appears to lag behind other major emerging economies such as China, Russia, South Africa and Thailand. This is a bit surprising considering that Mexico is a world leader in the export of smart phones, flat panel TVs, automobiles and appliances. Apparently these exports are manufactured in Mexico but the innovations that go into their designs mostly come from elsewhere.

Though Mexico is graduating thousands of engineers and science majors, these are either not yet innovating or are finding employment in other countries. If Mexico is to compete in future world trade, it would do well to take steps now to improve its innovativeness.

Related posts:

The value in Mexico of unpaid work in the home

 Other  Comments Off on The value in Mexico of unpaid work in the home
Aug 042012
 

A study by the National Statistics Institute (INEGI) based on 2010 data calculated that routine work done in the home (almost 80% of the time-value involved by women) is worth about 2.9 trillion pesos to the Mexican economy each year, equivalent to more than 20% of Mexico’s GDP. By way of comparison, manufacturing accounts for 17.2% of GDP, and commerce 15% of GDP.

The INEGI calculation includes the costs in time/labor needed to meet the demands of the home, and the net salary that would be paid for someone undertaking those tasks.

INEGI divides work done in the home into six categories:

  • help and assistance to members of the household. [In market value terms, this is equivalent to 6.9% of GDP]
  • preparation and serving of meals [5% of GDP]
  • cleaning and maintaining the home [3.5% of GDP]
  • shopping and household administration [2.9% of GDP]
  • washing and looking after footwear and clothing [2% of GDP]
  • helping other households and voluntary work [1.6% of GDP]

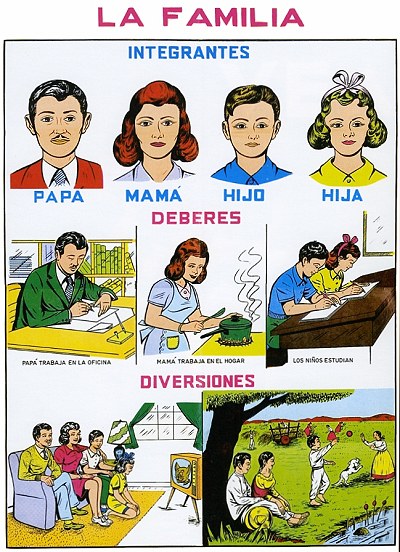
INEGI’s findings suggest that some aspects of family life and the division of “duties” (such as that common to older images like the one below) are not changing very rapidly.

"La Familia" ("The Family"). School chart of unknown date.

“La Familia” (“The Family”). School chart of unknown date.

Related posts:

Why do Mexican seasonal farmworkers in Leamington, Ontario, have their own consulate?

 Other  Comments Off on Why do Mexican seasonal farmworkers in Leamington, Ontario, have their own consulate?
Jan 122012
 

The list of Mexican consulates in Canada on the website of the Mexican Embassy in Ottawa includes one massive surprise. In addition to consulates in such obvious locations as Toronto, Vancouver, Montreal and Calgary, it also includes one in the small city of Leamington in Ontario, designated to provide service to Essex County (South).

Just why is there a Mexican consulate in a city of only 31,000 people?

Tacos Tony. Photo Steve Cylka

Tacos Tony. Photo Steve Cylka (www.theblackpeppercorn.com)

Leamington, established in 1890, is a small city (population 31,000) 50 km southeast of Windsor, on the shores of Lake Erie, near Point Pelee, Canada’s southernmost point. The city is a mix of different ethnic groups. From the 1920s to the 1940s, it attracted waves of German-speaking immigrants from Europe, including some German-speaking Mennonites from Russia, as well as Italians and Portuguese. In the 1950s, it became home to returning Mennonites from Mexico, whose families had lived in Canada prior to the 1920s when they had relocated to Mexico. The city reflects its ethnic diversity, with German bakeries, an Italian fountain, Tony’s Mexican tacos, and a Lebanese Club.

For the fascinating perspectives of two generations in a single family on (im)migration, settlement, and home-making in a small city in Ontario with close ties to Mexico, see Leamington, Ontario: Bloom or Bust by Tonya Davidson and Katherine Davidson.

Leamington is home to H.J. Heinz’s second largest plant in the world. The city is Canada’s greenhouse capital, with 485 ha (1200 acres) of greenhouses which yield 500 million tomatoes a year and provide several thousand jobs, many of them seasonal. Since 1974, as many as 4000 Mexican farm laborers come to Leamington for up to eight months each year to harvest the tomatoes. They are not the latest wave of permanent migrants but belong to the Seasonal Agricultural Workers’ Program. To qualify for the program workers have to be male, married, with limited education and strong family ties back home in Mexico. When seasonal work ends, they have to return home.

Their life in Canada, a mixture of opportunity and exploitation, was the subject of El Contrato: The Contract, Min Sook Lee’s 2003 National Film Board of Canada movie. El Contrato looks in detail at the lives of two migrant workers: father-of-four Teodoro Bello Martinez and “M” who wears a mask in the movie to disguise his  identity.

At the time the film was made, Mexican farm workers worked “seven days a week, ten hours a day for a flat rate of $7.25 per hour, no overtime, no holidays”. A quarter of their salary is deducted for taxes, employment insurance, board and transportation, but anyone who gets sick or challenges their employer is sent back to Mexico. In the words of one of the workers in the film, “Slavery has not disappeared.” This hard-hitting film (dialogue in Spanish, with English commentary and subtitles) is a very valuable starting point for discussions about globalization, migration and many other aspects of geography.

Since the movie, several things have changed. The Mexican consulate in Leamington was opened in 2005,  in response to the inability of the Mexican consulate in Toronto to keep up with the need to provide consular services to migrant workers in Leamington. The migrant workers are also now supported by several migrant agricultural support centers, including one in Leamington established by Canada’s United Food and Commercial Workers Union.

Mexico’s changing society: the phenomenon of “los ninis”

 Mexico's geography in the Press  Comments Off on Mexico’s changing society: the phenomenon of “los ninis”
Aug 022011
 

Los ninis are young people (aged 15-29) that “ni trabaja, ni estudia” (neither work nor study). They have become the focus of much press attention in the past couple of years, often accompanied by the phrase “Mexico’s lost generation”.

This El Universal article cites Education Ministry (SEP) figures that there are more than 7 million ninis in Mexico, 20.9% of the total number in that age group in the country. Apparently, at present, only five states have any specific programs targeting ninis and trying to persuade some of them either to enter the workforce or resume their education. These five states are Chihuahua, Baja California, Tlaxcala, Guerrero and Hidalgo.

The two states with the highest proportion of ninis (over 25% of the age group) are Chiapas and Michoacán, neither of which has any specific program to help them. The states with the smallest proportion of ninis (about 15% of the age-group) are Colima, Quintana Roo and Yucatán.

It is widely held that, in the absence of help, many ninis will have few options other than to turn to antisocial and criminal behavior, connected to drug trafficking, drug gangs, petty crime and the sex trade.

The state programs that are trying to work with ninis are adopting a variety of strategies, from seeking funding to recruit some ninis into local police forces or offering three-years paid service in the military to providing a direct monetary incentive to continue their education or financial incentives to firms that employ ninis. For example, the state of Chihuahua has funded 2,000 jobs, at a salary of 112 pesos (slightly less than 10 dollars) a day, for such socially-responsible tasks as painting homes in marginal parts of Ciudad Juárez or cleaning parks and public spaces  in Chihuahua city.

It is far too early to say whether these strategies will ultimately be successful. Finding an appropriate and productive role for Mexico’s millions of ninis is likely to remain one of society’s major challenges for decades to come.

Update (17 September 2011):

Mexico’s Secretariats of Education (SE) and of Labor and Social Welfare have issued a joint rebuttal of the previously published figure of 7 million ninis, which apparently originated in an OECD report, not from SE data as originally reported.

The rebuttal claims that 78% of these ninis are young married women, with children, who dedicate themselves to home-making. Up to 1 million young people are in this situation in the State of Mexico alone, the Secretariats claim. They emphasize that the figures reveal a gender inequality in access to educational and economic opportunities, linked to cultural patterns where many young women still see marriage and motherhood as their preferred or only option.

Read more:

Are Mexicans the world’s hardest-working people or the least productive?

 Books and resources  Comments Off on Are Mexicans the world’s hardest-working people or the least productive?
Jun 042011
 

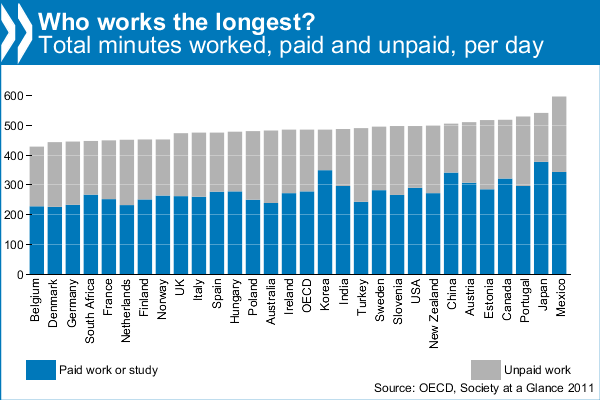
The headline — “Mexicans work longer hours than anyone else” — said it all, or did it? A recent report from the OECD (Organisation for Economic Co-operation and Development) found that Mexicans worked longer hours than people in any other OECD country, devoting 10 hours a day to paid and unpaid work (the latter includes housework and cooking). By contrast, Belgians work the least, only 7 hours. The OECD average is 8 hours a day. Is the positive spin simply because the OECD is currently headed by Mexican economist Dr. Angel Gurría?

The figures come from the latest edition of OECD’s Society at a Glance (2011), which gives an overview of social trends and policy developments in all member countries. Using indicators taken from OECD databases and other sources, it shows how societies are changing over time and how different countries compare.

Most unpaid work is housework. Mexicans do the most, more than 3 hours per day, and Koreans the least, only 79 minutes. Mexicans spend more time cooking than is customary in most other countries. The inhabitants of the USA spend the least time cooking each day, barely 30 minutes, and Turks the most, 74 minutes. Most people spend around 50 minutes a day cooking. Shopping also makes up a big part of unpaid work. The OECD average is 23 minutes a day, with the French spending the most (32 minutes) and the Koreans the least (13 minutes).

OECD: Working Hours

OECD: Working Hours

The report also attempts to estimate how much unpaid work is worth as a percentage of GDP for the 25 OECD countries for which data are available. It finds that the value of unpaid work is considerable, equivalent to about one-third of GDP in OECD countries, ranging from a low of 19% in Korea to a high of 53% in Portugal.

From a Mexican perspective, this may all paint a very rosy picture. However, as other commentators (see, for example, Burro Hall) have pointed out, it could equally well mean that Mexicans have the lowest productivity in the world, since they are working longer hours than other countries, but failing, in most sectors, to out-perform them!

Other highlights from the OECD’s Society at a Glance:

  • The 4 hours and 21 minute difference in unpaid work time between Mexican women and men is the largest in the OECD, where the average gap is 2 hours and 28 minutes
  • Mexicans have the second highest level of income inequality and the highest level of relative poverty in the OECD. One in every five Mexicans are poor, compared to just above one in ten on average across the OECD. Nearly half of Mexicans find it difficult or very difficult to get by on their current income.
  • Mexicans report the third highest positive psychological experiences (feeling rested, smiling, learning, and enjoyment) and lower than average negative experiences (pain, worry, stress, sadness, depression).