How did Mexico get to be the world’s 11th most populous country?

 Other  Comments Off on How did Mexico get to be the world’s 11th most populous country?
Jun 112011
 

Mexico is currently the world’s 11th most populous country. While it has not always held this position, Mexico has been among the world’s population leaders for the last two thousand years. Worldmapper.org provides data on the estimated population occupying the areas of current countries for various years starting in the year one, when India (62 million) and China (60 million) had more than half of world’s total population of 231 million. No other country had more than eight million. Mexico ranked 17th with an estimated two million inhabitants. According to available data eight countries have always been more populous than Mexico: China, India, Bangladesh, Russia, Pakistan, Japan and Indonesia.

The next data point is the year 1500, when Mexico ranked 13th with an estimated population of seven million. This estimate seems reasonable, though some feel that Mexico’s population might have been as large as 15 million which would have made Mexico the third most populous country on the planet behind only China and India. Between year 1 and 1500, Mexico surpassed Turkey, Spain, Egypt, Iran, and the Ukraine; but was passed by Germany.

Mexico’s total population plunged after the Spanish arrived bringing small pox, other diseases and major social disruption. By 1600, Mexico’s population was down to 2.5 million, but it was still the most populous country in the New World, according to data provided by gapminder.org. It ranked 22nd tied with Austria and behind such countries as Czechoslovakia, Poland, Sudan, and Yugoslavia.

In 1700 Mexico’s population was 4.5 million, ranking it 18th. By 1820 the USA had moved past Mexico’s population of 6.6 million to become the most populous country in the New World. Mexico maintained its 19th ranking until 1870 when Brazil surpassed Mexico’s population of 9.2 million to become the most populous country in Latin America. It is interesting that there were relatively few changes in the ranks of the top 20 countries during the 170 year period between 1700 and 1870, except for the USA which went from 40th to 4th.

Since 1870 Mexico’s population has surpassed that of nine different European countries. By 1900 Mexico had 11.7 million inhabitants moving it past Czechoslovakia and Turkey into the 18th spot. (Note that Gapminder population figures are higher than the Mexican census figures, perhaps because they attempted to correct for census under-counting; for the purposes of this analysis we use the Gapminder figures.) Mexico maintained its 18th rank until 1950 when its population of 28.5 million edged it past Spain and war torn Poland into 16th place. In 1970 its population reached 52.8 million putting Mexico in 14th place ahead of France and the Ukraine. By 1980 Mexico’s population of 68.3 million pushed it past Italy and Britain into 12th place. A decade later its population of 84.9 million moved Mexico past Germany into the 11th spot, where it has remained.

What will happen in future decades? Mexico’s position will change, but only slightly. In 2020, Mexico’s population may reach 125 million moving it past Japan into 10th place (Population forecasts for 2020 to 2050 are from the U.S. Bureau of Census). By 2030, Mexico, with a population of about 135 million, will have passed Russia, but fallen behind Ethiopia and the Philippines, putting it back in the 11th spot.

Mexico’s estimated population of 144 million in 2050 will place it 12th behind the Congo (World Population Prospects: the 2010 Revision). According to the United Nations, by 2100 Mexico’s population will decrease to 127 million moving it to the 20th spot, behind Tanzania, Uganda, Kenya, Iraq, Zambia, Niger, Malawi, and Sudan. Obviously, the accuracy of such a long term forecasts is very speculative. For example, given global climate change and possible food scarcities, some doubt if the sub-Saharan African countries can grow as rapidly during the last half of the 21st century as projected by the United Nations.
Marriage declining among Mexican couples

 Updates to Geo-Mexico  Comments Off on Marriage declining among Mexican couples
May 312011
 

Mexican couples still prefer marriage over the alternatives, but not as strongly as in the past. According to the 2010 census, 40.5% Mexicans age 12 and over were married, down from 44.5% in 2000 and 45.8% in 2009. The 11% decline since 1990 does not sound like much, but is significant when the data are investigated more deeply.

Because the data include all Mexicans over age 12, it is not surprising that 35.2% were single in 2010, compared to 37.2% in 2000 and 40.6% in 1990. The 13% drop since 1990 in the percentage for singles is mostly a result of the relative decline in the total number of teenagers, most of whom are unmarried, as a consequence of the decline in fertility over the past few decades.

The most impressive growth was for “free union” couples, those living together but not married. In terms of population, the proportion went from 7.4% in 1990 to 10.3% in 2000 and 14.4% in 2010, almost double the 1990 level. If we compare married couples with those in free union, we get an even clearer picture of the trend. In 1990, 13.9% of all couples lived in a “free union”; this figure increased to 18.8% in 2000 and 26.2% in 2010.

While roughly three of every four couples in Mexico are married, this varies significantly from state to state. It is not surprising that the least Catholic state—Chiapas— has the most couples living in “free union” – 38.8%. Chiapas also is one the most heavily indigenous states. But even in Chiapas, over six in ten couples are married. Other states with high rates of “free union” couples are Baja California (35.5%), Nayarit (34.5%), Baja California Sur (34.4%) and Quintana Roo (34.4%), a state with relatively few Catholics and a substantial indigenous population. The most Catholic state of all—Guanajuato—has the fewest “free union” couples, only 13.4%. Other states with relatively few unmarried couples are Yucatán (14.1%), Zacatecas (15.3%), Nuevo León (15.6%) and Aguascalientes (16.0%).

The census also includes three additional categories which all have increased rather rapidly since 1990. Those widowed went from 3.6% in 1990 to 4.3% in 2000 and 4.4% in 2010. This probably is a function of increasing life expectancy and people living longer on their own after their spouse dies, especially if the death resulted from an accident or violence. Separation, though still rather rare, is becoming more common, increasing from 1.2% in 1990 to 2.6% in 2000 and 3.7% in 2010. Divorce is also quite uncommon but increasing, from 0.7% in 1990 to 1.0% in 2000 and 1.5% in 2010.

Mexico’s population is aging fast

 Updates to Geo-Mexico  Comments Off on Mexico’s population is aging fast
May 232011
 

Mexico’s population has aged significantly in the past two decades. In 2010, the median age was 26 years meaning that there were equal numbers of people above and below age 26. The median age in 2000 was 22 years while that in 1990 was only 19 years. Obviously, the number of older adults is growing much faster than the number of young adults and children. The Federal District has the highest median age by far with 31, followed by Nuevo León, Tamaulipas and Veracruz with 27. At the other end are Chiapas with 22, Guerrero with 23, and Puebla, Guanajuato, Durango and Aguascalientes with 24.

In 2010, about 29.3% of the Mexican population was under age 15 compared to 34.1% in 2000 and 38.6% in 1990. On the other hand, the 2010 census indicates that 6.3% are over age 65, up from 5.0% in 2000 and only 4.2% in 1990. The proportion in this older age group increased 50% in the past two decades. These changes are quite dramatic and represent major demographic change. The trend is expected to continue and have significant implications for education and elder care systems.

The group in the middle, those between ages 15 and 65, has increased from 57.2% in 1990, to 60.9% in 2000 and 64.4% in 2010. This trend of increasing working age population contributes to greater economic growth as does the proportion of women entering the work force :

Of course, the growth in workforce can only contribute to economic growth if there are sufficient employment opportunities.

Mexico’s current age-sex structure is graphically presented in the 2010 population pyramid depicted in an earlier post:

Projecting Mexico’s population: when, if ever, will it stop growing?

 Updates to Geo-Mexico  Comments Off on Projecting Mexico’s population: when, if ever, will it stop growing?
May 172011
 

Between 2000 and 2010, Mexico’s population grew over 15% from 97.362 million to 112.337 million. While this is less than the 20% growth experienced between 1990 and 2000, it is still relatively fast. Will Mexico’s population ever stop growing? To answer such questions, demographers make population projections based on rates of births, deaths and net migration.

The most recent official population projection available from the Mexican Government’s CONAPO (Spanish acronym for National Population Commission) website estimates the Mexican population from 1990 to 2050. It estimates that the population will peak at 130.3 million in 2044 and decline gradually thereafter. This projection is many years old and does not incorporate the data from the 2010 Mexican census nor the impact on immigration of the employment recession in the USA.

In an attempt to get a better handle on Mexico’s future population dynamics until 2050, we conducted a simplified update of the CONAPO projections by using the 2010 census figures, more current net migration figures and adjusted natural population growth rates. Given the uncertain future of job opportunities in the USA for Mexican immigrants, we make the very simple assumption that net immigration from Mexico in the future will remain at 203,000 per year, the most recent figure available. (Pew Hispanic Center, “Mexican Immigrants: How Many Come? How Many Leave?” July 22, 2009, Washington, D.C.) The Pew numbers are limited to net Mexican migration to the USA, but that migration stream represents almost all Mexican migrants.

To obtain the correct 2010 census figure, the CONAPO values for natural population increase need to be upped by about 10%, an increase of only 0.122 percentage points in 2011 (from 1.222% to 1.344%), and progressively less in subsequent years. Using these two adjustments, we estimate that Mexico’s population will peak at 140.5 million in 2047. This is more than ten million more than the original CONAPO projection on 130.3 million.

With higher net emigration, the population peak will be lower and arrive earlier. For example, if net migration is set at 360,000 per year (the average for 2011 through 2050 used in the CONAPO projection, and about 66% of the net migration in 2005 before the recession), the population will peak at 134.5 million in 2043.

Without a doubt, accurate forecasts of net migration are needed for reliable population forecasting. If the CONAPO rate of natural increase is upped by only 5%, (instead of 10%), to 1.283% in 2011, the population will peak at 135.2 million in 2044. The compounding of this change of about one twentieth of one percent results in a change of over five million in Mexico’s eventual peak population.

Until CONAPO, or some other reputable demographic agency, makes a new population projection for Mexico, we can probably safely say only that Mexico’s population will peak at between 135 and 140 million sometime between 2040 and 2050.

Related posts:

Why did CONAPO underestimate Mexico’s population by almost two million people? Mexico’s changing population dynamics

 Updates to Geo-Mexico  Comments Off on Why did CONAPO underestimate Mexico’s population by almost two million people? Mexico’s changing population dynamics
May 122011
 

Making population projections is risky business. Birth and death rate trends can change unexpectedly. Perhaps more difficult to forecast accurately, in Mexico’s case, are international migration rates. The most recent official population projection available from the Mexican Government’s CONAPO (Spanish acronym for National Population Commission) website estimates that the Mexican population will peak at 130.3 million in 2044, before declining gradually thereafter. However, this projection is many years old, and does not incorporate the data from the 2010 Mexican census, nor the impact on immigration of the employment recession in the USA.

CONAPO projected that Mexico’s total population in 2010 would be only 110,619,340, about 1.7 million fewer than the 2010 census figure of 112,336,538. Their estimate for net migration for 2005 to 2009 was 2,012,904, which is quite close to the more recent Pew Hispanic Center figure of 2,036,000 (“Mexican Immigrants: How Many Come? How Many Leave?” July 22, 2009). The Pew numbers are limited to net Mexican migration to the USA, but that migration stream represents almost all Mexican migrants.

However, the two sources have very different values for individual years. The CONAPO net migration projection gradually increased from 400,000 in 2005 to 405,000 in 2009, peaking at 406,000 in 2011 and gradually declining to 303,000 in 2050. The more current Pew estimates reached 547,000 in 2006-2007, before declining to 374,000 for 2007-2008 and only 203,000 for 2009-2009. Current evidence and continued lack of real job opportunities for Mexicans in the USA suggests that net migration has stayed at about this level for the past few years.

The CONAPO projection forecasts that the Mexican rate of natural population increase would decline gradually from 1.39% per year in 2005 to 0.06% per year in 2050. The average of the values they used for 2005 to 2010 was 1.313% per year. Using the actual 2010 census figure and the Pew migration numbers, we calculate that the actual average rate of natural increase for 2005 to 2010 was 1.443%. This suggests that the actual rates of natural increase were about 10% higher than the values used in the CONAPO projection. Apparently, birth rates in Mexico did not decline as fast as expected by CONAPO, consequently their estimate of Mexico’s 2010 population was significantly less than the census figure.

In a later post, we will attempt to update the existing CONAPO projection using the 2010 census figure, more recent net migration values and adjusted natural increase rates.

Fertility decline not as fast as expected, but faster in some areas of Mexico than others

 Updates to Geo-Mexico  Comments Off on Fertility decline not as fast as expected, but faster in some areas of Mexico than others
May 092011
 

Data from the 2010 census indicate that the fertility rate did not decline as fast in the last decade as previously expected. On the other hand, the actual reduction was significant and consistent with Mexico’s demographic transition which will lead it to zero natural population growth by mid-century. See our 15 May 2010 post: Mexico’s demographic transition and flirtation with overpopulation.

At mid-decade Mexico’s National Population Council (CONAPO) projected that the total fertility rate would decline to an average of 2.1 children per women for the 2010 census. The new census data indicate that the fertility rate for 2009 was actually 2.4 compared to 2.9 in 1999. This decline is still significant but not quite as rapid as previously expected.

Fertility rates vary greatly for different areas of the country. Like many other socio-economic variables, fertility is closely related to community size. It declines systematically with increasing community size. Rural areas (localities of less than 2,500 population) had the highest rate of 2.9 in 2009, equal to the national level in 1999. If this ten year lag relationship continues, we might expect the fertility rate in rural areas in 2019 to be equal to the 2009 national rate of 2.4. The fertility rate in rural areas declined the fastest in the past decade, a full 24% from their 3.8 rate in 1999.

Towns between 2,500 and 15,000 dropped 16% from 3.1 to 2.6. Small cities between 15,000 and 100,000 declined by 14% from 2.8 to 2.4, the national average. For cities of over 100,000 the 2009 rate was 2.1 (the theoretical replacement level), compared to 2.4 in 1999.

The Federal District has the lowest fertility rate by far, for example women between age 35 and 40 have had an average of 1.8 children compared to the national average of 2.5. Using this measure, other states with low fertility levels include Nuevo León with 2.3, followed by Baja California Sur, Colima, State of Mexico, Morelos, Quintana Roo and Yucatán with 2.4. The highest fertility rates are in Chiapas and Guerrero where women between age 35 and 40 have had 3.2 children on average, followed by Oaxaca with 2.9.

The demographic transition model and its application to Mexico is described in depth in chapter nine of “Geo-Mexico; the geography and dynamics of modern Mexico”.

Mexico’s population keeps growing, but at a slower pace

 Updates to Geo-Mexico  Comments Off on Mexico’s population keeps growing, but at a slower pace
May 052011
 

The 2010 census indicates that since 1960 Mexico’s population has more than tripled to 112.3 million. However, the growth rate between 2000 and 2010 (1.4% per year) is less than half the 3.4% rate of increase experienced in the 1960s. If Mexico’s population had continued to grow at 3.4% since 1960, it would have been over 186 million by now!

Population growth has slowed because the fertility rate has declined dramatically. The total number of children born per women dropped from about 8 in 1960 to 2.9 in 1999 and 2.4 in 2009. It is expected to reach the replacement level of 2.1 by 2010. The fertility rate dropped in the last ten years for women in all age groups. It dropped an impressive 54% for women aged 45 to 49 and 28% for women aged 40 to 45. However, women in these age groups have relatively few babies. Fertility in the prime childbearing age groups; 20 to 24, 25 to 29 and 30 to 35; decreased by 15%, 18% and 15% respectively. The smallest drop was 12% for females ages 15 to 19, suggesting that the incidence of teen pregnancies may remain an issue.

Increased female education is closely linked with fertility reduction. The 2010 census indicates that women with university education had an average of 1.1 children, whereas those who completed secondary school had 1.6 children. Those completing only primary school had 3.3 children, while women with no formal  education had 3.5 children. Because these women may have additional children in the future, these numbers are not directly comparable to the total fertility rates referred to earlier.

With female education levels rising and total fertility rates declining, worries about “overpopulation” in Mexico do not seem warranted at this time. As we have stressed elsewhere, the really significant characteristic of Mexico’s population is no longer how rapidly total numbers are growing, but how rapidly the average age is rising as the population ages. An earlier post here includes a link to a pdf file showing Mexico’s predicted population pyramid for 2050, which shows just how fast Mexico’s population will age if present trends continue. The changing age distribution will require substantial shifts in public services over the next 20-30 years.

Related posts include:

Several chapters of Geo-Mexico: the geography and dynamics of modern Mexico discuss additional insights into Mexico’s population dynamics and trends, and their implications for future development. Buy your copy today!

May 032011
 

Somewhat surprisingly, the number of Mexicans speaking indigenous languages has increased significantly in the past 20 years. In 2010 there were 6.7 million indigenous speakers over age five compared to 6.0 million in 2000 and 5.3 million in 1990.

There are two factors contributing to this finding:

  • First, indigenous speakers are teaching their children to speak their indigenous language.
  • Second, indigenous speakers have higher than average birth rates.

The number of indigenous speakers that cannot speak Spanish decreased slightly from 1.0 million in 2000 to 981,000 in 2010.

The most widely spoken indigenous languages are:

  • Nahuatl, with 1,587,884 million speakers, followed by
  • Maya (796,405),
  • Mixteca (494,454),
  • Tzeltal (474,298).
  • Zapotec (460,683), and
  • Tzotzil (429,168).

[Note: language names used here include all minor variants of the particular language]

About 62% of all indigenous language speakers live in rural areas, communities with under 2,500 inhabitants. Nearly 20% live in small towns between 2,500 and 15,000, while about 7% in larger towns, and 11% live in cities of over 100,000 population. Indigenous speaking areas tent to have low levels of development. Over 73% of the population In Mexico’s 125 least developed municipalities speak an indigenous language.

States with the most indigenous speakers tend to be in the south. In Oaxaca, almost 34% of the population over age three speak an indigenous language followed by Yucatán (30%), Chiapas (27%), Quintana Roo (16%) and Guerrero and Hidalgo (15%). States with the fewest indigenous speakers are Aguascalientes and Coahuila (0.2%), Guanajuato 90.53%) and Zacatecas (0.4%).

A total of 15.7 million Mexicans over age three consider themselves indigenous. Surprisingly, 9.1 million of these cannot speak any indigenous language. There are 400,000 Mexicans who can speak an indigenous language, but do not consider themselves indigenous.

Related posts:

Chapter 10 of Geo-Mexico: the geography and dynamics of modern Mexico is devoted to Mexico’s indigenous peoples. Many other chapters of Geo-Mexico include significant discussion of the cultural and development issues facing Mexico’s indigenous groups.

Which Mexican states attract most migrants?

 Updates to Geo-Mexico  Comments Off on Which Mexican states attract most migrants?
Apr 252011
 

Mexico-USA international migration remains a hot topic in any “Geography of Mexico” program. But international migration is not the only form of migration in Mexico; internal (domestic) migration is also important. This includes people moving house within the same town or city, as well as those who move to a different town, city or state.

The most rapid period of urban growth in Mexico coincided with high rates of rural-urban migration. As the proportion of the total population residing in rural populations fell, the proportion of the population living in urban areas (defined in Mexico as settlements with a population exceeding 2,500) rose, a trend called urbanization.

Rural-urban migration within Mexico has slowed down dramatically in recent years, but internal migration is still very common, with increasing numbers of Mexicans opting to live in mid-sized cities (those with a population between 100,000 and 1,000,000). In many cases, this involves a change of state, and this post examines which states in Mexico have attracted the most migrants from other states or from outside the country.

The 2010 census reveals that 18.4% of people residing in Mexico were born in another Mexican state or in a foreign country. In Quintana Roo, 54% of the residents were born outside the state. These residents were mostly attracted to Quintana Roo by the rapidly growing tourist industry in Cancún and other resorts. Almost 13% of Quintana Roo residents moved into the state within the last five years.

Over 45% of Baja California residents, 1.4 million people, were born elsewhere, and almost 6% moved into the state in the last five years. These migrants were probably attracted to the growing employment opportunities in Tijuana and Mexicali. Some may be waiting to try to cross illegally into the USA or have already made an unsuccessful attempt and are contemplating their next move.

Baja California Sur has almost 40% who were born elsewhere and over 13% who moved into the state within the past five years. These migrants were mostly attracted to jobs created in the booming tourism industry and in the associated construction sector.

About 37% of residents in the State of Mexico, 5.6 million people, were born elsewhere. Migration to the State of Mexico is mostly linked to the suburbanization and counter-urbanization of Mexico City. Between 2005 and 2010, about half a million people moved out of Mexico City and over 380,000 of these settled in the State of Mexico and an additional 38,000 moved to Hidalgo which is part of Metropolitan Mexico City. (For the areas involved, see Is Mexico City sprawl a sign of a future megalopolis?) Similar processes are also taking place in Guadalajara, Mexico’s second-largest city: Population change in the Guadalajara Metropolitan Area.

States with rather low income levels and slow economic growth attracted few migrants. Only 3.6% of Chiapas residents were born outside the state, with 1.2% moving into Chiapas in the last five years. Interestingly, Chiapas also has one the lowest rates of out-migration. Other states with relatively few migrants are Guerrero, Oaxaca, Yucatán and Tabasco.

Internal migration in Mexico is the focus of chapter 25 of Geo-Mexico: the geography and dynamics of modern Mexico. Ask your library to buy a copy of this handy reference guide to all aspects of Mexico’s geography today! Better yet, order your own copy…

Apr 142011
 

Foreigners are defined as individuals born in another country, but residing in Mexico. According to the recent census, almost a million (961,121) foreigners were living in Mexico in mid-2010. In 2000 there were only about half as many (492,617). Among foreigners, there were slightly more males than females (50.6% versus 49.4%). Under this definition, children born in the USA of two Mexican parents are considered foreigners if they currently live in Mexico. Unfortunately, the data currently available do not enable us to separate these foreign-born Mexicans from other foreigners who were raised in other countries and moved to Mexico to follow their professions or retire. Furthermore, they do not help us answer a question we have been asked dozens of times in recent years, namely, “How many Canadians and how many Americans have retired in Mexico?”

Though almost a million foreigners sounds like an impressive number, Mexico has relatively few foreign born residents compared to its two northern neighbors. Foreigners constitute only 0.86% of the 2010 Mexican population, compared to 21% Canada and 13% in the USA.

Where in Mexico do most foreigners reside? Baja California has the most foreigners with almost 123,000, followed by Jalisco (84,000), Chihuahua (80,000), and the Federal District (72,000). Tlaxcala has the fewest, with just over 3,200, followed by Tabasco with about 4,500.

The states with the highest percentage of foreigners are mostly along the US border. Baja California leads with 3.9%, followed by Chihuahua (2.3%), Tamaulipas (1.9%), and Sonora (1.7%). Interestingly, the other border state, Coahuila, has relatively few foreigners, only 0.8%. Other states with relatively large percentages are either historical sources of immigrants to the USA or retirement havens like Colima (1.44%), Quintana Roo (1.40%), Nayarit (1.35%), Zacatecas (1.22%), Jalisco (1.14%) and Michoacán (1.10%).

Tabasco has the fewest foreigners as a percentage with only 0.20%, followed by Tlaxcala (0.28%), Veracruz (0.30%), the State of México (0.33%) and Yucatán (0.36%). Yucatán is a surprise on this list because there is a very large and active foreign retirement community there. Perhaps many of these retirees were away from Mexico when the census was taken in the summer of 2010.

What states experienced the largest increases in foreigners in the last decade? The number of foreigners grew fastest in those states with relatively few foreigners in 2000, namely Hidalgo (up 402% over the decade), Tlaxcala (333%), Tabasco (281%), and Veracruz and Oaxaca (both with 272%).

Related posts:

Mexico’s population pyramid (age-sex diagram) for 2010

 Updates to Geo-Mexico  Comments Off on Mexico’s population pyramid (age-sex diagram) for 2010
Mar 102011
 

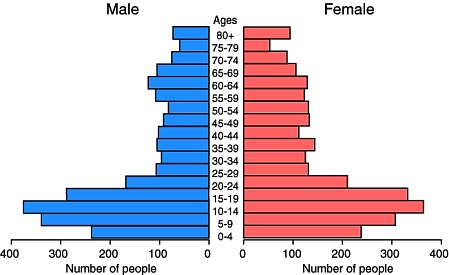
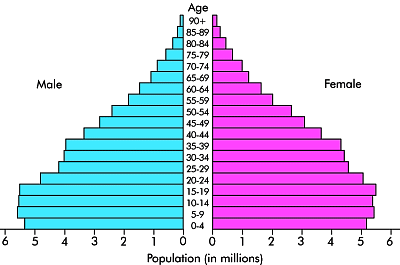
The population pyramid for Mexico in 2010 is shown below:

Mexico's population pyramid, 2010. Data: INEGI

What does this pyramid tell us about Mexico’s population and possible future trends?

The number of babies born during the last 20 years has been more or less equal for each 5-year period. This is despite a higher number of females in the age-bearing categories (15-45). These two statements, taken together, must imply that both birth rates (number of births/1,000 people) and fertility rates (number of children per female of child-bearing age) have fallen and continue to fall.

There are numerous implications for a population with a declining number of babies. Perhaps the most obvious is that fewer school places will be required in ten years time than are currently needed. In Mexico’s case, it is unlikely that school buildings will be closed (at least not in the short to mid-term) since many government-run schools currently house two independent school populations, one attending classes every morning, and the other attending classes in the afternoons.

The decline in babies also means that the average age of Mexico’s population continues to rise. The median age of Mexico’s 112.3 million inhabitants is now 26 years (i.e. half the population is older than 26 years, the other half is 26 years or younger).

Several chapters of Geo-Mexico: the geography and dynamics of modern Mexico discuss additional insights into Mexico’s population dynamics and trends, and their implications for future development. An earlier post here includes a link to a pdf file showing Mexico’s population pyramid in 1990, and the predicted pyramid for 2050. The 2050 pyramid shows just how fast Mexico’s population will age if present trends continue.

The 10 states in Mexico with the lowest male-female ratios

 Other  Comments Off on The 10 states in Mexico with the lowest male-female ratios
Feb 072011
 

In an earlier post, we looked at the ten states with the highest male-female ratios (ie the most males for every 100 females). This time we turn our attention to the ten states with the lowest male-female ratios (or the most females for every 100 males). Male-female ratios are sometimes referred to as “sex ratios”, though that term does not indicate clearly whether the values are males for every 100 females (the usual interpretation) or females for every 100 males.

States with low male-female ratios

The 10 states with the lowest male-female ratios

Male-female ratios are an important demographic statistic and reflect numerous environmental, economic and social factors. In turn, they influence many aspects of economic and social geography. This Wikipedia entry on Human Sex Ratio offers a general introduction to some of the geography associated with male-female ratios.

The table and map show the 10 states in Mexico with the lowest male-female ratios.

RankStatemale-female ratio (males/100 females)number of females per 100 males
1=Federal District91.8108.9
1=Oaxaca91.8108.9
3Puebla92.1108.6
4Guanajuato92.8107.8
5Hidalgo93.2107.3
6Michoacán93.4107.1
7Morelos93.5107.0
8=Tlaxcala93.7106.7
8=Veracruz93.7106.7
10Querétaro94.3106.0

What do these states have in common?

The short answer would appear to be not very much, apart from forming a band across central Mexico!

The Federal District may offer far more employment opportunities for females than for males. Females who live in other states may be more likely to migrate to Mexico City in search of employment than to attempt the more complicated migration to the USA which has become the preferred option for many young males.

Oaxaca, along with Guanajuato and Michoacán, has a high rate of out-migration. In most situations, demographers consider that males are more more likely to migrate than females. This gender imbalance in migration would leave a low male-female ratio at the place of origin. Out-migration may also explain why Morelos and Tlaxcala, two of the smallest states in Mexico, are on the list.

In conclusion, while male-females ratios are an important population statistic, it is not necessarily always easy to explain them, especially when considering a country as complex as Mexico.

Relevant posts previously published on this blog:

Several chapters of Geo-Mexico: the geography and dynamics of modern Mexico discuss population issues, including population growth, distribution, gender differences and density. Buy your copy today to have a handy reference guide to all major aspects of Mexico’s geography!

The 10 states in Mexico with the highest male-female ratios

 Other  Comments Off on The 10 states in Mexico with the highest male-female ratios
Jan 312011
 

Male-female ratios are a useful way of looking at population dynamics. They may reflect, or may influence, many aspects of social and economic geography from employment opportunities to rates and age of civil partnerships (including marriage).

In 2010, only four states in Mexico had more males than females: Baja California, Baja California Sur, Sonora and Quintana Roo (see table).

RankStateMale-Female ratio (males/100 females)
1Baja California Sur104.5
2Quintana Roo103.3
3Baja California101.8
4Sonora101.3
5Nayarit99.5
6Nuevo León99.4
7Sinaloa98.9
8Chihuahua98.7
9Coahuila98.6
10Colima98.4

States with high male-female ratios

The ten states with the highest male-female ratios (2010)

What do these states, at opposite extremes of the country, have in common?

They are among the most economically dynamic states. All except Sonora have a vibrant tourism sector, where employment opportunities in the construction sector (mainly for young males) have offered young people an alternative to migrating north of the border.

Sonora has a more mixed economy,which includes an important mining sector (another predominantly male source of employment), as well as agriculture, manufacturing and some tourism.

In a future post, and to avoid any accusation of gender bias, we will look at the states which have the highest proportion of females (i.e. the lowest male-female ratios, the lowest number of males/100 females).

Several chapters of Geo-Mexico: the geography and dynamics of modern Mexico discuss population issues, including population growth, distribution, gender differences and density. Buy your copy today to have a handy reference guide to all major aspects of Mexico’s geography!

Population change in the Guadalajara Metropolitan Area

 Updates to Geo-Mexico  Comments Off on Population change in the Guadalajara Metropolitan Area
Jan 252011
 

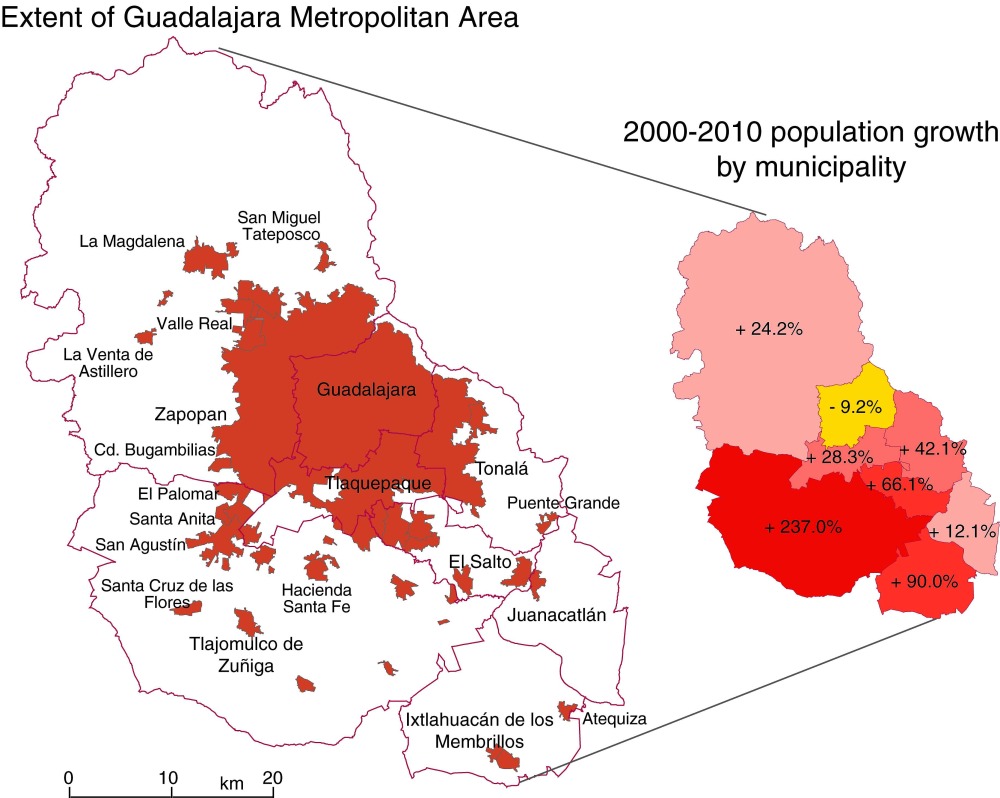
The preliminary results of Mexico’s 2010 population census reveal that the population residing in the Guadalajara Metropolitan Area (GMA) increased from 3.7 million in 2000 to 4.4 million in 2010. The census results also show clearly that the GMA is continuing to experience the effects of suburbanization and counter-urbanization.

Suburbanization is the gradual spread of the urban area into the surrounding rural areas. The built-up area of Guadalajara is spreading mainly to the south and west. The north-eastern part of the city is unable to spread beyond its existing extent because it is hemmed in by the precipitous canyon of the River Santiago, often referred to as La Barranca de los Oblatos (Oblates‘ Canyon).

Counter-urbanization is the movement of city dwellers into smaller settlements in the surrounding countryside. With time, some of these smaller settlements are eventually engulfed by the spreading city. The precise boundaries of large metropolitan areas such as the GMA are therefore subject to almost constant change. The map below shows the population change for Guadalajara and its surrounding municipalities for the period 2000-2010.

Guadalajara Metropolitan Area
Population change in the Guadalajara Metropolitan Area, 2000-2010. Click to enlarge.

Note, first, that the population of Guadalajara proper (the municipality of that name) has actually declined significantly since 2000, from 1,647,720 to 1,494,134.

The city is not bounded by the municipal boundary, but spreads into several adjoining municipalities (see map), all of which have experienced population growth between 2000 and 2010. The municipality of Tlaquepaque was already “built up”, even prior to 2000, and its population has risen only slowly since that date. The slowest rate of growth (excluding the “negative growth” of Guadalajara) is in Zapopan; this is a complete change from 30 years ago when Zapopan was growing very rapidly as Guadalajara expanded westwards.

In the 1980s and 1990s, Guadalajara also spread into Tonalá and El Salto. El Salto, relatively close to Guadalajara’s international airport, and close to the main Guadalajara-Mexico City highway, is the heart of a major industrial corridor.  Its main focus in recent years has been on high-tech firms; the region is often referred to as “Mexico’s Silicon Valley”. Firms with manufacturing and/or assembly plants in or close to El Salto include Hewlett-Packard, IBM, General Electric, Intel, Hitachi, Siemens, Flextronics and Solectron. The El Salto area has seen moderate growth over the last ten years.

By far the most dramatic rates of growth for 2000-2010 occurred in Ixtlahuacán de los Membrillos. and in Tlajomulco de Zuñiga, which more than tripled its population in just ten years, from 123,220 to 416,552. Tlajomulco is a very old settlement indeed, with considerable historical importance. The spread of Guadalajara’s suburbs into the northern part of Tlajomulco has been astonishingly rapid, and represents a classic case of the process of suburbanization. Meanwhile, the population of the long-established settlement of Tlajomulco (further south in the eponymous municipality) has also risen rapidly as some urban dwellers choose, in the process of counter-urbanization, to live slightly outside the main urban sprawl of Guadalajara. The counter-urban movement is strongest in the settlements relatively close to the city, but now extends at least 50 km to the south, to the villages on the northern shore of Lake Chapala.

What will 2010-2020 bring? There are few signs that the building boom along the southern edge of Guadalajara Metropolitan Area is going to come to a halt any time soon. The state of Jalisco plans to construct an “outer ring road” south of the city. The planned route passes very close to the settlement of Tlajomulco. It is surely only a question of time before Tlajomulco, and various other small towns and villages, are swallowed up by the continuing expansion of Mexico’s second largest city.

Dec 122010
 

The map below shows the average number of inhabitants per household (“household size”) for each of Mexico’s states.

The national average household size is 3.9 persons. The middle band on the map shows those states with household size between 3.7 and 4.0 inclusive. The darkest shade shows states with a household size of 4.1 or greater; the lightest shade shows those with a household size of 3.6 or smaller.

Average household size in Mexico, 2010

Average household size in Mexico, 2010. Cartography: Tony Burton; all rights reserved.

Discussion questions:

  • Compare this map with the maps of:
  1. potable water,
  2. GDP/person
  3. infant mortality
  • Discuss the possible reasons for any connections you note between household size, potable water, GDP/person and infant mortality.
  • What other factors might also affect household sizes?
  • What are the drawbacks to using any of these measures (household size, potable water, GDP/person, infant mortality) on their own as a development indicator?

Development indices of various kinds are discussed in chapters 29 and 30 of Geo-Mexico: the geography and dynamics of modern Mexico. Ask your local library to purchase a copy today!

Map of population change in Mexico, 2000-2010

 Updates to Geo-Mexico  Comments Off on Map of population change in Mexico, 2000-2010
Dec 072010
 

The publication of the preliminary results from this year’s population census has allowed us to update our map of Mexico’s recent population change (Figure 8.3 of Geo-Mexico: the geography and dynamics of modern Mexico). We are delighted to bring you what may be the first map to be published anywhere in the world of Mexico’s population change over the past decade:

Annual % population change in Mexico, 2000-2010

Annual % population change in Mexico, 2000-2010. Cartography: Tony Burton, all rights reserved.

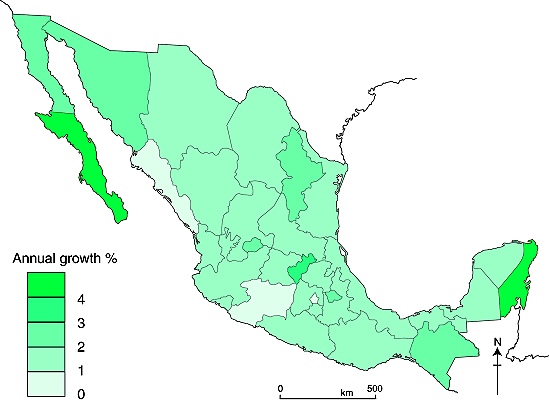
The pattern on this map for 2000-2010 shows that population change over this period has been broadly similar to that for the period 1970-2005 (Figure 8.3 of Geo-Mexico: the geography and dynamics of modern Mexico). Mexico’s total population has grown by an average of 1.52%/yr over the past decade.

Things to note:

The fastest growth rates are in Baja California Sur and Quintana Roo, both states where tourism continues to develop rapidly and attract more migrants.

The slowest rates are in the Federal District (Mexico D.F.), Michoacán and Sinaloa, all of which have rates of less than 1%/yr. Michoacán’s low rate of increase is an anomaly, given the state’s high birth rate, and must be due to out-migration.

In central Mexico, the state of Querétaro stands out as being the most dynamic state in population terms, registering a growth of more than 3%/yr over the last decade.

Discussion Question: How does this map compare to the map of GDP/person?

Several chapters of Geo-Mexico: the geography and dynamics of modern Mexico discuss population issues, including population growth, distribution and density. Buy your copy today to have a handy reference guide to all major aspects of Mexico’s geography!

How many Mexicans are there? The preliminary figures from Mexico’s 2010 national population census

 Updates to Geo-Mexico  Comments Off on How many Mexicans are there? The preliminary figures from Mexico’s 2010 national population census
Nov 262010
 

The National Statistics Institute (INEGI) has released the preliminary figures from Mexico’s 2010 national population census. INEGI claims that its 190,000 census workers were able to visit 98.4% of all homes in the country. The lowest response rates were 91.3% and 91.5% respectively in the troubled northern border states of Tamaulipas and Chihuahua.

Update: 2020 – Total population is about 126 million.

The highlights of the preliminary results

The preliminary results of the 2010 census reveal some interesting changes.

First, Mexico’s total population in 2010 is  112,322,757. This is almost 4 million higher than INEGI’s pre-census estimates. The population total means that Mexico remains the world’s 11th most populous country.

Mexico has now become a markedly urban society. Whereas a hundred years ago, in 1910, 71.3% of the then population of 15.2 millions lived in rural areas (defined as municipalities with fewer than 2,500 inhabitants), in 2010, 62.6% of all Mexicans live in one of the country’s 56 largest metropolitan areas (as defined by INEGI). The largest single metropolitan area is the Mexico City Metropolitan Area (which extends into the State of Mexico) with a population of 20.1 million.

The density of population has changed over the last century as well. In 1910, the overall density of population was 8 persons/square kilometer. In 2010, the density of population was 57 persons/square kilometer (with Mexico D.F. having the highest value in Mexico of 5,937 inhabitants/square kilometer!).

Emigration in search of work, and a declining maternal mortality rate have completely changed Mexico’s male/female ratio. Whereas in 1910, there were 102.7 males for every 100 females, in 2010 there are  95.5 males for every 100 females.

As more figures are released in coming months, we will offer further insights into the changing geography of Mexico.

In the meantime, for a comprehensive summary of Mexico’s geography, including several chapters about Mexico’s population, ask Santa Claus, a friend or family member to give you a copy of Geo-Mexico: the geography and dynamics of modern Mexico. What better seasonal gift could there possibly be?

Which states in Mexico have the highest infant mortality rates?

 Maps, Other, Teaching ideas  Comments Off on Which states in Mexico have the highest infant mortality rates?
Nov 122010
 

Infant mortality is the number of deaths of infants (aged less than 1 year old) for every 1,000 live births. It is widely regarded as a very useful development indicator, and is one of the statistics used when calculating compound (multifactor) development indices. The Federal District has the lowest infant mortality rate in the county – 13.8, ahead of Nuevo León (14.0), Coahuila (14.8) and Baja California (14.9).

RankStateInfant mortality rate
22Michoacán20.0
23Campeche20.1
24Zacatecas20.3
25San Luis Potosí20.5
26Tabasco20.9
27Puebla20.9
28Hidalgo21.3
29Veracruz21.6
30Guerrero24.4
31Oaxaca24.6
32Chiapas25.3

The table lists the 11 states in Mexico which have the highest rates of infant mortality. No other state has an infant mortality rate of 20.0 or higher. The map clearly reveals that these states are mostly in the south of Mexico, a long way from the USA border.

Map of infant mortality

The eleven states with the highest infant mortality rates

Compare this map with the map of GDP/person. Are there any states which appear to be anomalies to the general rule that GDP/person and infant mortality rates are inversely related?

Development indices of various kinds are discussed in chapters 29 and 30 of Geo-Mexico: the geography and dynamics of modern Mexico. Ask your local library to purchase a copy today!

What questions were asked in Mexico’s 2010 population census?

 Other  Comments Off on What questions were asked in Mexico’s 2010 population census?
Nov 082010
 

In mid-2010, Mexico held a general census of its population and households. The majority of census respondents were required to complete a “basic questionnaire” of 29 questions, with a smaller number (2.7 million) asked to complete a “full questionnaire” with 75 questions.

The questions asked in the basic questionnaire (with a summary of the options for each response)  included:

Characteristics of the dwelling:

  • What are the floors made of? (earth/cement or concrete/wood, tiles or other)
  • How many rooms are used for sleeping (excluding passages)?
  • How many rooms are there in total, including the kitchen, but excluding passages or bathrooms?
  • Does the dwelling have electricity?
  • What is the water supply? (piped municipal supply/stand pipe/water piped from another dwelling/periodic water trucked in/river, well or lake)
  • Is the dwelling connected to a sewage system or septic tank?
  • Does the toilet have running water/water from buckets/no water?
  • Which of the following do the occupants of the dwelling own? – radio/television/refrigerator/washing machine/vehicle/computer/fixed line telephone/cell phone/internet.

Characteristics of each person in the household:

  • Sex, age, relation to head of household
  • Place of birth (state, if born in Mexico, or country, if born elsewhere)
  • Which medical services if any, do the occupants have access to? (IMSS, ISSSTE, Pemex or Armed Services, private provider, other, none)
  • Religion
  • Limitations in daily life? (walking, moving/vision, even when wearing glasses or contacts/speaking/hearing even when wearing a hearing aid/dressing, bathing, eating/learning simple new tasks/any form of mental difficulty/none)
  • Name of any dialect or indigenous language (ie other than Spanish) spoken

Education:

  • Are you currently enrolled in school, college or university?
  • Level of education already completed
  • Can you read and write a simple message?
  • Where did you reside 5 years ago? (state in Mexico, or country if outside Mexico)
  • Civil status (single/married/separated/divorced/widowed)

Employment

  • Last week, did you work at least one hour/have a job, but not work/look for work
  • Are you retired/student/homemaker/unable to work through physical or mental incapacity

Children

  • How many liveborn children have you had?
  • How many of these children have since died?

The first results from the 2010 census should be available from early next year. As results are published, Geo-Mexico will be updating facts and figures to highlight any important changes in Mexico’s geography.

Oct 222010
 

By common consent, the history of blacks in what-is-now Mexico is a long one. The first black slave to set foot in Mexico is thought to have been Juan Cortés. He accompanied the conquistadors in 1519. It has been claimed that some natives thought he must be a god, since they had never seen a black man before.

A few years later, six blacks are believed to have taken part in the successful siege of the Aztec capital Tenochtitlan. Several hundred other blacks formed part of the wandering, fighting forces employed in the name of the Spanish crown to secure other parts of New Spain.[1]

The indigenous population crashed in the first hundred years following the conquest, largely as a result of smallpox and other European diseases. Estimates of the native population prior to the conquest range from 4 to 30 million. A century later, there were just 1.6 million.

afromexico-coverNew Spain had been conquered by a ludicrously small number of Spaniards. To retain control and in order to begin exploiting the potential riches of the virgin territory they had won, a good supply of laborers was essential. There were not enough locals, so imports of slaves became a high priority.

By 1570, almost 35% of all the mine workers in the largest mines of Zacatecas and neighboring locations were African slaves. [2] Large numbers of slaves were also imported for the sugar plantations and factories in areas along the Gulf coast, such as Veracruz. By the mid-seventeenth century, some 8,000-10,000 blacks were Gulf coast residents. After this time, the slave trade to Mexico gradually diminished.

Miguel Hidalgo, the Independence leader, first demanded an end to slavery in 1810 (the same year that Upper Canada freed all slaves). Slavery was abolished by President Vicente Guerrero on September 15, 1829.

During the succeeding 36 years, prior to the abolition of slavery in the U.S. (1865), some U.S. slaves seized their chance and headed south in search of freedom and opportunity. Recognizing the potential, in 1831, one Mexican senator, Sánchez de Tagle, a signatory of the Act of Independence, called for assistance to be given to any blacks wanting to move south on the grounds that this movement would possibly prevent Mexico being invaded by white Americans. [3] Sánchez de Tagle’s point was that black immigrants would be strong supporters of Mexico since they wouldn’t want to be returned to slavery, and would be preferable to white Americans, who might be seeking an opportunity to annex parts of Mexico for their homeland. Sánchez de Tagle’s fears came to pass. One year after the U.S. annexed the slave-holding Republic of Texas in 1845, it invaded Mexico.

Perhaps as many as 4,000 blacks entered Mexico between 1840 and 1860. At the beginning of 1850, several states enacted a series of land concessions for black immigrants, in order that undeveloped areas with agricultural potential might be settled and farmed.

Even after the abolition of slavery in the U.S., small waves of blacks continued to arrive periodically in Mexico. Many came from the Caribbean after 1870 to help build the growing national railway network. In 1882, some 300 Jamaicans arrived to help build the San Luis Potosí-Tampico line; another 300 Jamaicans made the trip in 1905 to take jobs in mines in the state of Durango. [4] Partially as a response to their own independence struggles, thousands of Cubans came after 1895. They favored the tropical coastal lowlands such as Veracruz, Yucatan and parts of Oaxaca, where the climate and landscapes were more familiar to them than the high interior plateaux of central Mexico.

Mexican historians have largely ignored the in-migration of blacks and their gradual intermarriage and assimilation into Mexican society. For a variety of reasons, they chose to focus instead on either the indigenous peoples, or the mestizos who form the majority of Mexicans today. The pendulum is finally beginning to swing back, as researchers like Charles Henry Rowell, Ben Vinson III and Bobby Vaughn re-evaluate the original sources, and examine the life and culture of the communities where many blacks settled.

Most work about the influence of blacks on modern-day Mexico has focused on the Veracruz area, in particular on the settlements of Coyolillo, Alvarado, Mandinga and Tlacotalpan. 5 On the opposite coast, Bobby Vaughn has spent more than a decade studying the Costa Chica of Oaxaca and Guerrero. [6]

Analysts of Mexican population history emphasize the poor reliability of early estimates and censuses, as well as the complex mixing of races which occurred with time. While the precise figures and dates may vary, most demographers appear to agree with Bobby Vaughn that the black population, which rose rapidly to around 20,000 shortly after the conquest, continued to exceed the Spanish population in New Spain until around 1810.

It is estimated that more than 110,000 black slaves (perhaps even as many as 200,000) were brought to New Spain during colonial times. Happily, their legacy is still with us, and lives on in the language, customs and culture of all these areas.

Sources / Further Reading

1 Matthew Restall. Seven Myths of the Spanish Conquest. (Oxford University Press) 2003

2 Peter J. Bakewell. Silver Mining and Society in Colonial Mexico: Zacatecas, 1546-1700, cited in Afroméxico.

3 Vinson III, Ben & Vaughn, Bobby. Afroméxico. (in Spanish; translation by Clara García Ayluardo) Mexico: CIDE/CFE. 2004. The main source for this column, divided into three parts. Following a joint introduction, Ben Vinson III, Professor of Latin American History at Penn State University, provides a detailed overview of studies connected to blacks in Mexico. Then Bobby Vaughn, who has a doctorate in anthropology from Stanford University, adopts an ethnographic perspective in writing about the Costa Chica of Oaxaca and Guerrero; his short essay includes discussion of the Black Mexico movement. The work concludes with an extensive bibliography of sources relating to Afroméxico.

4 Vinson III, Ben & Vaughn, Bobby. Afroméxico. Mexico: CIDE/CFE. 2004

5 See, for example, the Winter 2004 and Spring 2006 issues of Callaloo (A Journal of African Diaspora Arts and Letters). The Spring 2006 issue, vol 29, #2, pp 397-543, has a series of articles under the general heading of “Africa in Mexico”, including transcriptions of fascinating interviews with such characters as Rodolfo Figueroa Martinez, who relates the history of how several local towns, including San Lorenzo de los Negros (now Yanga) were founded by blacks, and of how a black identity gradually emerged. Other interviewees discuss how they view their color and Afromestizo identity, lamenting the fact that their history has been distorted or largely forgotten. Local food and festival celebrations are also highlighted.

6 Bobby Vaughn’s Black Mexico Home Page, Afro-Mexicans of the Costa Chica, available via MexConnect, provides links to several of his articles including Blacks in Mexico. A Brief Overview.

Original article on MexConnect

Several chapters of Geo-Mexico: the geography and dynamics of modern Mexico discuss population issues, including population growth, distribution and density. Buy your copy today to have a handy reference guide to all major aspects of Mexico’s geography!

Over half a million natives of the state of Puebla live in New York City

 Excerpts from Geo-Mexico  Comments Off on Over half a million natives of the state of Puebla live in New York City
Aug 252010
 

The New York City area is now home to over half a million poblanos, natives of the Mexican state of Puebla. A 2005 Smithsonian article by Jonathan Kandell (available here as a pdf file) takes a close look at their expectations and aspirations. Most started as undocumented workers, but many have gained legal status through the 1986 Immigration Reform and Control Act (ICRA) or a variety of other means.

The story of Ricardo and Aldea is just one example. They got to New York by crossing the 49o C (120o F) Sonoran Desert in the summer of 2003. They work 70-hour weeks for less than the minimum wage. She will pay for her month long trip back to Puebla by serving as a courier, or paquetera, a person who carries clothing, electronics, and other gifts from immigrants to their families.

Getting back and forth across the border without proper documents is more difficult than it used to be, but is not a significant problem. Most rely on trusted polleros, often called coyotes, who provide border crossing service for fees ranging from a few hundred dollars for just crossing the border to a few thousand dollars for door-to-door service.

Population pyramid for Piaxtla, 2000.

Population pyramid for Piaxtla, 2000. How does this pyramid reflect out-migration?

Migration has had a profound impact on villages in Puebla, such as Piaxtla. Most of the 1600 current residents of Piaxtla are either children or elderly (see population pyramid). The mayor claims that “maybe three out of four of my constituents live in New York”. The hundreds of millions of dollars send back each year are having a dramatic effect on rural communities in Puebla. Forty years ago, virtually all the houses were made of palm-thatch adobe. Now they are mostly brick and concrete. Many are topped with satellite dishes.

The towns also have new restaurants, taxis, video arcades, cybercafes, and newly paved streets, all made possible from remittances. Ironically, the towns are sparsely populated and many of the new houses are empty because their owners are working in New York.

Most youth consider the prospect of migration. Few think about careers in Mexico or becoming artisans and continuing Puebla’s long tradition of ceramics, woodworking and weaving. Teenagers show little interest in corn farming, the traditional mainstay of the local economy. In short, migrating to jobs in New York has become the norm.

Somewhat similar migration channels link:

For previous posts about remittances, the funds sent home by migrant workers, see:

Migration between Mexico and the USA is the focus of chapter 25 of Geo-Mexico: the geography and dynamics of modern Mexico. Ask your library to buy a copy of this handy reference guide to all aspects of Mexico’s geography today! Better yet, order your own copy…

The 10 least populous states in Mexico

 Maps, Teaching ideas  Comments Off on The 10 least populous states in Mexico
Aug 192010
 

The table shows the 10 states in Mexico which have the fewest inhabitants.

RankStatePopulation (2005)Population (2010 census)
1Baja California Sur512,170637,065
2Colima567,996650,129
3Campeche754,730822,001
4Nayarit949,6841,084,957
5Tlaxcala1,068,2071,169,825
6Aguascalientes1,065,4161,184,924
7Quintana Roo1,135,3091,324,257
8Zacatecas1,367,6921,490,550
9Durango1,509,1171,632,860
10Querétaro1,598,1391,827,985
Map of least populous states

The smallest states in Mexico (by population). Click to enlarge. All; rights reserved

(a) Can you suggest any characteristics which many of these small states might share? (not counting, obviously, their small population!)

(b) What implications might a relatively small population have for a state, and for its economy and administration?

(c) What geographic and historical factors might help to explain why some states have only a relatively small population?

(d) Which two states exchanged their rank positions between 2005 and 2010? Can you suggest why this might have occurred?

Several chapters of Geo-Mexico: the geography and dynamics of modern Mexico. discuss population issues, including population distribution and population density. Buy your copy today to have a handy reference guide to all major aspects of Mexico’s geography!

The 11 states in Mexico with the oldest population

 Maps, Teaching ideas  Comments Off on The 11 states in Mexico with the oldest population
Aug 142010
 

The table shows the eleven states in Mexico which have the oldest population (defined by average age of the population).

RankStateAverage age (years)
1Federal District30.0
2Veracruz28.4
3=Nayarit28.0
3=Nueva León28.0
5Yucatán27.6
6=Zacatecas27.4
6=Colima27.4
6=Hidalgo27.4
6=Morelos27.4
6=Sonora27.4
6=Tamaulipas27.4
Map of states with the oldest population

States with the oldest population. Click to enlarge. All rights reserved.

(a) What factors might explain why the inhabitants of some states in Mexico have a high average age than others? What might these 11 states have in common?

Hint: Do not just think about why some states might have many elderly people, but also why some states might have relatively few young children

You might also like to compare this map with a map of the states which have the youngest average age.

Several chapters of Geo-Mexico: the geography and dynamics of modern Mexico. discuss population issues, including the age of the population. Buy your copy today to have a handy reference guide to all major aspects of Mexico’s geography!

The 11 states in Mexico with the youngest population

 Maps, Teaching ideas  Comments Off on The 11 states in Mexico with the youngest population
Aug 052010
 

The table and map show the eleven states in Mexico which have the youngest population (defined by average age of the population).

RankStateAverage age (years)
1Quintana Roo22.3
2Chiapas24.2
3Baja California24.9
4Querétaro25.7
5=State of México25.9
5=Aguascalientes25.9
7=Guerrero26.0
7=Baja California Sur26.0
9=Tabasco26.3
9=Puebla26.3
9=Chihuahua26.3
The states with the youngest average age

The states with the youngest average age. Click to enlarge. All rights reserved.

This map does not appear to reveal any obvious spatial pattern. What do these 11 states have in common, apart from (presumably) a high percentage of young people?

(a) Can you suggest what circumstances (or combination of circumstances) might result in a state having a relatively young population?

(b) Find a table or map showing the birth rates in each state. Is there any similarity between that information and this map of states with the youngest population?

(c) Find a table or map showing which states have experienced the fastest rates of in-migration because their economies have grown rapidly in the past 30 or 40 years. Is there any similarity between that information and this map of states with the youngest population?

Several chapters of Geo-Mexico: the geography and dynamics of modern Mexico. discuss population issues, including the age of the population. Buy your copy today to have a handy reference guide to all major aspects of Mexico’s geography!

Jun 112010
 

Compared to its very large and loud northern neighbor the USA, Mexico often seems like a rather minor country. But let’s take a closer look at Mexico’s major characteristics.

Mexico is among the world leaders in land size, population and economic production. These three criteria are a rational way of determining the world’s major countries. Mexico is the world’s 14th largest country in area, just behind the Congo and Saudi Arabia, but ahead of Indonesia and Libya. Mexico’s population in 2009 was about 109 million ranking it 11th in the world.  Russia (140 million) and Japan (127 million) were slightly ahead of Mexico. Trailing Mexico were the Philippines (92 million) and Vietnam (87 million).

The Gross Domestic Product (GDP) of Mexico in 2009 was about $1.5 trillion, behind Brazil ($2.0 trillion) and Italy ($1.7 trillion), but ahead of South Korea (S1.4 trillion), Spain ($1.4 trillion) and Canada ($1.3 trillion). These GDP figures are based on “Purchasing Power Parity” which illuminates distortions based on exchange rates. For example, if a hair cut of equal quality costs $20 in the USA, $5 in Mexico and $2 in China, the haircut is counted as a $20 contribution the GDP of each country.

Mexico is one of only six countries that are in the top 15 in all three categories. The other five countries in this select group are China, India, the USA, Brazil and Russia.

That Mexico is in this very select group makes a very strong case that it is indeed a major country on the world stage.

For more information about these and many other aspects of Mexico, consider buying Geo-Mexico: the geography and dynamics of modern Mexico and adding it to your library.

Mexico’s population will peak before 2050 but migration is harder to predict

 Updates to Geo-Mexico  Comments Off on Mexico’s population will peak before 2050 but migration is harder to predict
Jun 052010
 

Past data and current trends indicate that Mexico is adhering to the demographic transition model (see post of 15 May 2010).

Mexico's population is aging rapidly

Death rates first dropped precipitously and now birth rates are declining rapidly. By the middle of the 21st century, these will be roughly equal and natural population growth will drop to zero. Then birth rates will drop below death rates and the population will begin to decline. This is already happening in Russia, Italy, Germany and Japan.
Mexico is expected to reach this situation before 2050 when its population will be between 120 and 130 million. This is a rather wide spread for a demographic forecast because predicting the rates of Mexican immigration to the USA is very tricky. Net immigration was over 550,000 in 2006, but dropped to about 200,000 in 2009 because the employment situation in the USA was so bad. When the recession ends and jobs are again plentiful in the USA, immigration will jump back up, but how far and for how many years?

As Mexico’s population growth rates continue to decline and become negative, the new challenge will be coping with a rapidly aging population. Fortunately, Mexico will be able to learn from Europe and Japan who are already facing this challenge.

Mexico’s population dynamics are discussed in chapters 8 and 9 of Geo-Mexico: the geography and dynamics of modern Mexico.

A summary of population trends in Mexico

 Mexico's geography in the Press  Comments Off on A summary of population trends in Mexico
May 262010
 

The Economist issue of April 24-30 had an interesting article entitled “Mexico’s population, when the niños run out. A falling birth rate and what it means.” Here are some of the figures quoted in that article:

Mexico's population is aging rapidly

Children per woman of child-bearing age.

  • 1960s: almost 7
  • today: just over 2 (about the same as the USA)

Average age

  • 1980: 17 years
  • 2010: 28 years (1 in 10 of the total population is aged 60 or older)

As the article emphasizes, in Mexico the trend towards an aging population “which took a century in Europe, has happened in three decades”. This trend has many implications for the provision of health care, social security and pensions. Such a rapid change towards an older population may also have a considerable impact on the rates of migration between Mexico and the USA.

The geography of Mexico’s population is analyzed in chapters 8 and 9 of Geo-Mexico: the geographyand dynamics of modern Mexico. Buy your copy today!

Is Mexico’s population evenly distributed?

 Excerpts from Geo-Mexico  Comments Off on Is Mexico’s population evenly distributed?
May 222010
 

No! Mexico’s population (mid-2010 estimate: 108,396,211) is not evenly distributed. Parts of central Mexico are very densely populated while there are relatively few people in the wide open spaces in northern Mexico. This is perhaps one of the most important features of Mexico’s human geography.

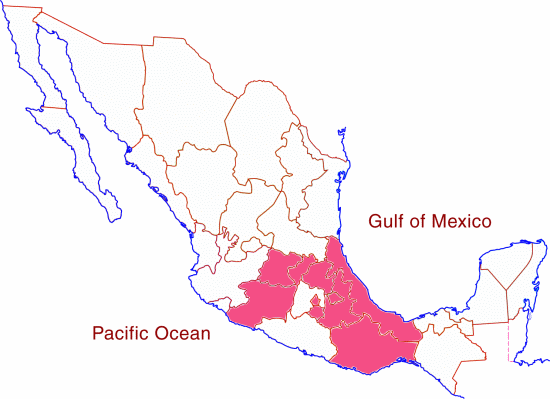
The Federal District and adjoining State of Mexico make up just over 1% of Mexico’s area, but house over 22% of the population for a density of 950 persons per km2.  A central band, including Mexico City, encircled by Guadalajara, Aguascalientes, Xalapa, Veracruz, Puebla, Cuernavaca and Morelia covers only 10% of the land but contains over half of all Mexicans and has a density higher than that of northeastern USA (between Washington and Boston), UK, Germany or Italy.

The other 90% of Mexico has 50 million people, more than any other Latin American country except Brazil. Population densities in those areas are low.

In conclusion, some areas of Mexico are indeed crowded, but most of Mexico is not.

See this earlier post for a visually dramatic cartogram depicting Mexico’s population distribution.

Mexico’s population distribution and population density are analyzed in chapter 8 of Geo-Mexico: the geography and dynamics of modern Mexico.

May 212010
 

Life expectancy in most European countries has increased steadily over the past couple hundred years at a rate of about 2.5 years per decade (25 years per century). In the developing world, the increase has been higher, between 3 and 5 years per decade.

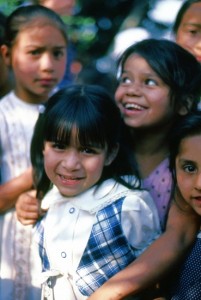
Children in Zitácuaro, Michoacán. Photo: Tony Burton. All rights reserved.

In Mexico, life expectancy in the 1930s was only 37 years. In other words, Mexican children born in the 1930s were only expected to live for 37 years. Of course, many lived far longer, but many died long before they reached age 37. Mexican life expectancy increased rapidly and was up to 54 years in the 1950s. It reached 64 by the mid 1970s and by the mid 1990s, was up to 74. Life expectancy in Mexico today is 77 years. Of course, women live longer than men: the life expectancy today is about 79 years for women and 75 years for men.

If Mexico continues to increase its life expectancy by 2.5 years a decade, today’s average Mexican newborn will have excellent odds of living to be 100 or more. Of course, to reach age 100, these Mexicans will have to avoid obesity and diabetes. Currently, Mexico ranks second to the US in rate of obesity among major countries and is first in rate of diabetes.

Actually, the common definition of life expectancy at birth is rather conservative. It assumes that as babies born in 2010 age, they will die at the same rate as all current cohort groups. For example when babies born in 2010 reach age 80 in 2090, they will die at the same rate as current 80-year-olds. Thus there is no allowance for advances in health care such as cures for cancer, Alzheimer’s, etc. With the current rate of genetic advances, improved cures and treatments for today’s fatal diseases are almost assured. Therefore, we expect the death rate of 80-year-olds in 2090 to be far less than the death rate for 80-year-olds in 2010.

Life expectancy at birth is discussed in chapter 9 of Geo-Mexico: the geography and dynamics of modern Mexico.

Mexico’s population density compared to other countries. Is Mexico too crowded?

 Other, Teaching ideas  Comments Off on Mexico’s population density compared to other countries. Is Mexico too crowded?
May 192010
 

It is sometimes claimed that Mexico is ‘too crowded’ or ‘overpopulated’. Overpopulation, however, is an elusive concept, since it depends on the complex relationships between total population (and/or population density) and the resources available to support that population. In turn, the value of these resources depends in part on the technologies available to utilize them.

Even accepting that Mexico is not over-populated (since it apparently has sufficient resources to support its population), it is still interesting to compare Mexico’s population density with that of other countries.

CountryPopulation Density (persons per sq. km)
Mexico55
Bangladesh1127
India359
Japan337
UK337
Germany229
Italy200
Nigeria167
China 139
Indonesia121
Colombia40
USA31
Venezuela29
Brazil22
Argentina14
Canada3

As the table shows, Mexico’s overall population density of 55 persons per km2 is low, compared to Asian and European countries: Bangladesh (1127), India (359), Japan (337), UK (255) and Germany (229).

On the other hand, it is easily the highest among large countries in the New World like Colombia (40), USA (31), Venezuela (29) and Brazil (22).

Q. What are the implications for development of a country having a high density of population?

In a future post, we will consider whether or not Mexico’s population is evenly distributed across the country.