Instant poverty reduction – just change the baseline

 Mexico's geography in the Press, Updates to Geo-Mexico  Comments Off on Instant poverty reduction – just change the baseline
Jul 282016
 

The latest report on poverty from the National Statistics Agency, INEGI, looks like good news for Mexico’s poorest people but, sadly, this is only a mirage, based on a change in the measurement methods used.

The 2015 edition of INEGI’s Survey of Socioeconomic Conditions showed an overall real increase of 11.9% in household earnings, with an increase of over 30% in some states. According to the report, Mexico’s poor are richer by a third compared to last year, a change that some politicians will no doubt claim is the direct result of their effective policies.

Social activists were stunned by the claims of poverty reduction and Mexico’s National Council for the Evaluation of Social Development Policy (CONEVAL), which measures poverty levels using INEGI’s data, said the changes by the statistics institute were not credible.

According to Jonathan Heath, an independent economic researcher in Mexico City, Inegi is claiming that the previous methods overestimated poverty levels, but the change in methodology, without public consultation, “raises suspicion.”

Quite apart from the misleadingly positive spin on numbers, the change in methodology makes it completely impossible to compare current poverty rates with the rates for previous years.

Related posts:

Jul 252016
 

We drew attention a few years ago to the issue of Empty houses in Mexico, a problem due in part to on-going rural-urban migration, and in part to the construction of millions of new homes across Mexico. Thirty years ago, there were only 15 recognized metropolitan areas in Mexico, today there are 59.

Poor coordination between the various government departments responsible for housing, services and land development has led to some settlements being authorized even in areas where ownership was disputed or that lacked adequate access to highways or basic services.

Three years ago, a Mexico City news report entitled Desorden urbano dejó en el país millones de viviendas fantasmas claimed that as many as 4 million houses, many of them newly built, were standing empty. Other houses have been abandoned for a variety of reasons, ranging from the death of former owners, or owners moving to other areas, or being unable to keep up with mortgage and loan payments.

Infonavit Housing. Credit: Habitat D.F.

Infonavit Housing. Credit: Habitat D.F.

News reports claim that as many as 14 houses in a single street are abandoned in some areas, such as the Mineral de la Reforma district of the rapidly-growing city of Pachuca in the state of Hidalgo, causing problems for neighbors.

Now, the Mexican Workers’ Housing Fund, Infonavit, has set itself the target of reclaiming 30,000 abandoned houses this year. Infonavit has funded hundreds of developments with small, cookie-cutter houses, across Mexico. Members of Infonavit can access a series of housing-related mortgage products, to buy or remodel a new or existing home.

Starting last year, Infonavit began to rescue abandoned houses, renovate them and then auction them off to its members. Initial success was limited, with only about half of the repossessed homes being sold on, but in the first few months of this year, Infonavit has successfully sold off 92% of the first 3,000 houses it has recovered.

This year, Infonavit plans to auction off homes in Chihuahua, Nuevo León, Tamaulipas, Hidalgo and the State of México.

Related posts:

Extreme poverty declined between 2010 and 2012

 Other, Updates to Geo-Mexico  Comments Off on Extreme poverty declined between 2010 and 2012
Feb 012014
 

As we saw in an earlier post – Poverty on the rise in some states in Mexico – the total number of people living in poverty in Mexico continues to rise, though the poverty rate (as a percentage) remains roughly the same.

The measures of poverty used by Mexico’s National Political and Social Development Commission (Coneval) are multidimensional, and not simply based on household or personal income. This map shows the changes in “extreme multidimensional poverty” (a category that includes “the poorest of the poor”)  that occurred in Mexico between 2010 and 2012.

Changes in levels of extreme poverty in Mexico, 2010-2012.

Changes in levels of extreme poverty in Mexico, 2010-2012. Credit: Geo-Mexico; all rights reserved. Data: Coneval

In areas shaded red, a higher percentage of the population experienced “extreme poverty” in 2012 than in 2010; their personal situations and opportunities have presumably become significantly worse. Interestingly, this category includes the prosperous states of Nuevo León (economy based on manufacturing and services) and Quintana Roo (tourism).

The reverse is true for areas shaded blue where the extreme poverty rate has fallen: many of the people living in those areas have moved out of the most extreme category and presumably have seen their fortunes and opportunities improve, even if, in most cases, not sufficiently to have escaped the “poverty” category completely. This category includes more than half of Mexico’s 32 administrative divisions.

The fact that “extreme poverty” has declined in more than half of Mexico is encouraging, and suggests that government policies aimed at poverty reduction, such as Oportunidades are gradually making a difference. It remains to be seen whether or not this trend continues over the next few years.

Related posts:

Incarceration in Mexico: distance decay from California?

 Mexico's geography in the Press  Comments Off on Incarceration in Mexico: distance decay from California?
Jan 072014
 

In a previous post – 2013 Mexico Peace Index: Mexico becoming more peaceful –we reported the work of the Institute for Economics and Peace in devising its inaugural 2013 Mexico Peace Index (MPI).

The interactive online maps that form part of this report repay some exploring. In addition to allowing you to view the pattern for MPI on a state-by-state basis, they also allow you to see the pattern for each of the 7 main indicators:

  • Homicide (includes murder, infanticide and non-negligent manslaughter)
  • Violent crime (includes rape, robbery and aggravated assault)
  • Weapons crime (the proportion of crimes that involve a firearm)
  • Incarceration (the annual number of people per 100,000 people over the age of 18 sentenced to prison)
  • Police funding (proportion of the Federal District Public Security Contribution Fund)
  • Organized crime (includes extortion, kidnapping, and drug related crimes)
  • Justice efficiency (the ratio of sentenced homicides to total number of homicides)

Looking at these maps recently, one curiosity that struck me was that the map for incarceration rates shows a clear distance-decay pattern (the kind of pattern we older geographers love to find, even if we can’t explain it!).

The map is a screenshot of incarceration rates in 2012. The incarceration rate is defined as the number of people /100,000 people over the age of 18 sentenced to prison in that year.

Incarceration rate in Mexico, 2012

Incarceration rate in Mexico, 2012. Credit: Mexican Peace Index. Institute for Economics & Peace

In this case (see map), it appears that the rate of incarceration varies with distance from the US state of California. The closer to California, the higher the incarceration rate. Looking more closely, it becomes apparent that the states along the northwest coast of Mexico, west of the Western Sierra Madre, have higher incarceration rates than those inland or further south. This means that a better description of the pattern might be that states that are closer in travel time, or ease of travel, to California have higher incarceration rates. This has the added attraction of bringing the eastern state of Quintana Roo into the picture given the large number of flights from Los Angeles to Cancún!

Even if a pattern exists, this kind of conjectural analysis is not the same as a causal explanation. In this case, surely it is just a coincidence that incarceration rates happened to arrange themselves like this? Perhaps the analysis of incarceration rates in future years will shed more light on this spatial curiosity!

For other examples of distance decay, see

The full 96-page 2013 Mexico Peace Index report – available here – is well worth reading and offers many more insights into the changes taking place in Mexico.

Related posts:
Jan 022014
 

The total number of people living in poverty in Mexico continues to rise, though the poverty rate (as a percentage) remains roughly the same. According to Mexico’s National Political and Social Development Commission (Spanish language acronym: Coneval), the number of people in poverty has risen steadily for several years, much in line with Mexico’s rising total population. Coneval’s figures are based on a simple multidimensional poverty index, which considers the following criteria:

  • household income
  • access to education
  • access to food
  • access to health care
  • access to social services
  • housing quality
  • access to basic household services (electricity, water, drainage)

According to Coneval, 53.3 million Mexicans (45.5% of the total population) were living in poverty in 2012, compared to 52.8 million (46.1% of the then population) in 2010 and 48.8 million Mexicans (44.5%of the population) in 2008.

Note that poverty statistics prior to 2008 in Mexico were generally based purely on income levels. From 2008, this method was replaced by a multidimensional index. The precise details of the index have been modified slightly since that time, making exact comparisons between 2012 and 2008 more problematic.

While the precise numbers are subject to debate, mainly due to differing definitions of what constitutes “poverty” and how it can be measured, the trend revealed by the Coneval numbers is supported by the Economic Commission for Latin America and the Caribbean (ECLAC) in its “Social Panorama of Latin America 2013“, published in December 2013. The ECLAC report found that Mexico is one of a very few countries where poverty levels rose between 2011 and 2012, from 36.3% of the population to 37.1%, according to its definition.

The dire situation in Mexico compares to a slight decrease in poverty in most larger Latin American countries, including Venezuela, Ecuador, Brazil, Peru, Argentina and Colombia.

In absolute terms, according to ECLAC, 164 million people were found to be living in poverty in Latin America, about 57.4 million (35%) of them in Mexico.

Change in poverty rates in Mexico, 2010-2012.

Change in poverty rates in Mexico, 2010-2012. Credit: Geo-Mexico; all rights reserved. Data: Coneval

The map shows the Coneval data for changes in the poverty rate between 2010 and 2012 by state. It appears that poverty levels increased in many of Mexico’s more prosperous areas and in the longer established industrial areas, as well as in almost all areas where tourism is important. Poverty decreased in some of Mexico’s more rural, and generally poorer, states.

Related posts:

2013 Mexico Peace Index: Mexico becoming more peaceful

 Mexico's geography in the Press  Comments Off on 2013 Mexico Peace Index: Mexico becoming more peaceful
Dec 142013
 

The Institute for Economics and Peace (IEP), an independent, non-profit research organization dedicated to promoting a better understanding of the social and economic factors that develop a more peaceful society, has released its first Mexico Peace Index. The 2013 Mexico Peace Index (MPI) is based on a similar methodology as previous IEP indices, including the United States Peace Index and the United Kingdom Peace Index; however specific measures were included to better reflect the specific Mexican cultural and national context.

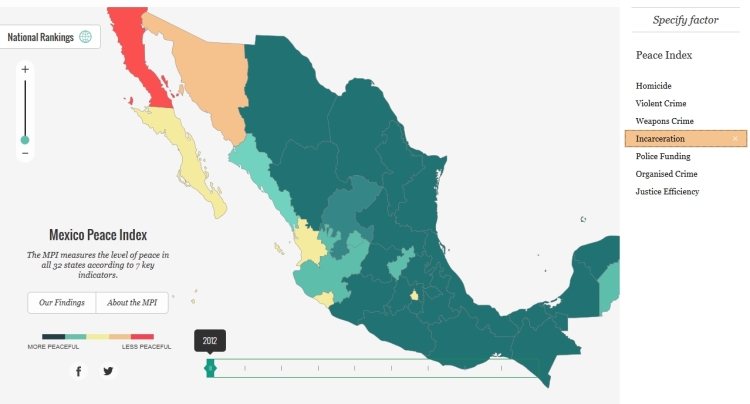
For the Mexico Peace Index, seven indicators were used to analyze peace: homicide rates, violent crime, weapons crime, incarceration, police funding, efficiency of the justice system, and the level of organized crime.

The study was performed with the guidance of an Expert Panel representing various institutions such as IMCO, CIDE, Mexico Evalua and INEGI. The Mexico Peace Index 2013 uses data provided by INEGI and the Executive Secretariat of the National Public Security System (SESNSP).

Mexico Peace Index

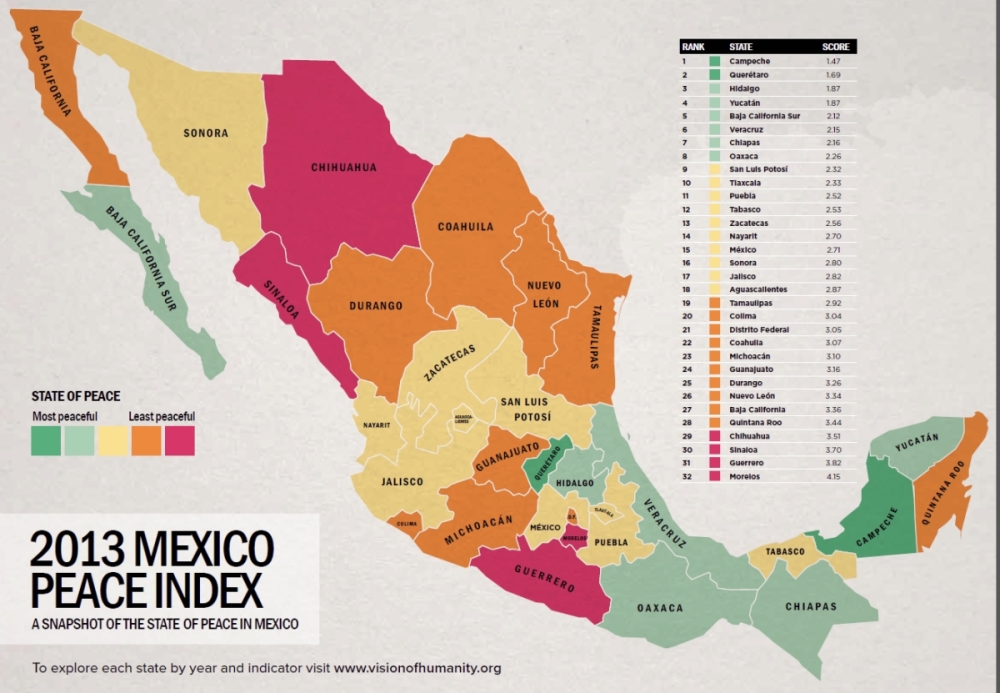
Mexico Peace Index. Credit: Institute for Economics and Peace.

The headlines

  • Mexico Peace Index finds that peace improved 7.4% in past two years
  • The two-year improvement in peace was primarily driven by a 30% decrease in organized crime
  • Most peaceful states experienced an annual GDP growth of more than double the least peaceful states
  • Oaxaca, Chiapas, and Yucatan have the most improved levels of peace in the past decade
  • Mexico has the greatest potential in the world to overcome its current levels of violence and build a more peaceful society, with a strong business environment and high levels of human capital
  • The eastern region of Mexico is the most peaceful; the northern region the least

The 2013 MPI provides a comprehensive assessment of peace in Mexico detailing the level of peace in each of the 32 states over the last 10 years and an analysis of the costs associated with violence as well as the socio-economic dimensions associated with peace.

mpi-coverThe study finds that there was a 7.4% improvement in Mexico’s peace scores in the last two years, driven by decreases in organized crime, violent crime, and weapons crime. However, over the past 10 years Mexico experienced a marked increase in direct violence, with peace declining by 27%. A key factor was the 37% increase in the homicide rate since 2007.

The 2013 MPI presents comparisons between the states and the regions of Mexico, and finds that the states with the highest levels of peace are: Campeche, Queretaro, Hidalgo, Yucatan and Baja California Sur while the five least peaceful states are: Morelos, Guerrero, Sinaloa, Chihuahua, and Quintana Roo.

The study finds that Oaxaca, Chiapas and Yucatan experienced the most substantial increases in their levels of peace during the last decade. Oaxaca improved its score by 22% and Chiapas by 17%.  These states were found to be relatively peaceful in comparison with other areas of Latin America and North America. Campeche, for example, has a level of peace comparable with the states of New Mexico and Delaware in the United States.

Regionally, the research finds that the eastern region of Mexico is the most peaceful, while the northern region is the most violent.

Analysis of federal funding to state police (Fondo de Aportaciones para la Seguridad Publica) finds that increases in police funding are related to crime reporting rates, with increased funding improving the public’s relationship with the police.

The direct cost of violence to the Mexican economy is 3.8% of GDP, while the indirect costs amount to 12% for a total 2.49 trillion pesos (15.8% of GDP). Under optimal conditions, if there was no violence in Mexico, the economy would have the potential to improve by up to 27%. This figure includes direct and indirect costs and the additional flow-on economic activity that would eventuate from new money being added to the economy. The study highlights that if all the states of Mexico were as peaceful as Campeche, the most peaceful state in the country, Mexico would reap an economic benefit of 2.26 trillion pesos.

The most peaceful Mexican states in 2003 experienced the strongest economic performance in 2012. Over the past 10 years, these states’ GDP increased by 9% versus 4% in the least peaceful states.

Steve Killelea, founder and executive chairman of IEP said: “Compared to other countries with a similar level of conflict and development, Mexico has the greatest potential to increase its peace on account of the strength of the structures, attitudes and institutions that sustain peace in the long term.” He added that: “This research aims to provide the evidence base and data for a broader policy debate about how to reduce violence in Mexico”.

Mexico’s standing in regards to positive peace is encouraging: the country has a strong business environment, performs well on measures of human development, and ranks better than world averages on education.

Factors impacting peace in Mexico

It is well known that the increase in the levels of violence in Mexico has been a consequence of the war against drug trafficking, but there are other key factors at play.

The number of firearms smuggled into Mexico increased substantially during the last decade, almost three times higher in the period 2010-2012 than between 1997 and 1999.

As a consequence, the weapons crime indicator, which measures the number of offenses involving the use of weapons, recorded a significant increase of 117% per 100,000 people during the last decade.

The measure of the efficiency of the justice system has recorded a significant deterioration. In some states up to 95% of homicides remain unpunished.

In addition, the public perception of corruption is very high and one of the greatest challenges facing Mexico.

Prison capacity is overstretched with a Mexico Evalua 2013 report stating that 52.4% of prisons in the country are over-crowded and house 74% of the prison population in Mexico.

There is a high level of unreported crime in Mexico. According to data from the National Survey of Victimization and Perception of Public Safety 2012 (ENVIPE), only 19% of theft, 10% of fraud and 10% of extortion cases are reported.

It is important to address all of these key challenges in order to reduce violence and realise the social and economic benefits of peace in Mexico.

This post is the text of a press release from the Institute for Economics and Peace. For more information about the report, visit http://visionofhumanity.org/#/page/news/812 and http://visionofhumanity.org/#/page/indexes/mexico-peace-index

The full 96-page report – available here – is well worth reading and offers many more insights into the changes taking place in Mexico.

Related posts:

Disparities in wealth in Mexico: trends include a growing middle class as well as more millionaires

 Mexico's geography in the Press  Comments Off on Disparities in wealth in Mexico: trends include a growing middle class as well as more millionaires
Jun 242013
 

Two recent studies shed an interesting light on the distribution of wealth in Mexico. The first, carried out by the the National Statistics Agency (INEGI) is that agency’s first ever analysis of Mexico’s social classes. The study found that 12.3 million homes and 44 million people (39% of the total population) were “middle class” in 2010, up from 35% in 2000. In urban areas, 47% of the population was middle class, compared to just 26% in rural areas. Middle class homes had at least one computer, spent about 115 dollars [1,470 pesos] a month on eating and drinking outside the home, had at least one resident with a credit card and one with formal employment. In most cases, the head of household had gained a tertiary qualification. The same report found that almost 60% of Mexico’s population matched the criteria for “lower class”, while only 1.7% of the population could be best described as “upper class”.

However, a second study, by consultancy WealthInsight (“Mexico Wealth Book: Trends in Millionaire Wealth“) provides compelling evidence that the number of wealthy and super-wealthy individuals in Mexico has risen sharply. From 2007 to 2012, during the administration of President Felipe Calderón, the number of millionaires in Mexico rose by 32%, whereas the global average for the same period (which included economic recession in the USA and Europe) declined by 0.3%.

WealthInsight found that in 2012 Mexico had 145,000 individuals with a “High Net Worth” (defined as over a million dollars in assets besides their principal residence). Together these high net worth individuals hold a fortune of $736 billion, equivalent to 43% of Mexico ‘s total individual wealth. This number is well above the worldwide average of 29%, indicating that Mexico has a relatively uneven distribution of wealth. What’s more, WealthInsight expects the trend to continue and predicts that by 2017, the number of millionaires in Mexico will grow a further 47% to reach 213,000.

Included in the figure for millionaires are 2,540 multimillionaires (with individual net assets of $30 million or more), 2272 “affluent millionaires”(net assets between $30
million and $100 million) and 252 “centimillionaires” (net assets between $100 million and $1 billion). Mexico also has 16 billionaires, a number expected to rise to 21 by 2017. Grouped together, these ultra high net worth individuals are worth $364 billion in total combined wealth. By 2017 the total wealth of multimillionaires is projected to increase by 44% to reach $525 billion. The report predicts that the total wealth of Mexican billionaires will grow by 26% to reach $241 billion by the end of 2017.

The Mexican city with most multimillionaires is Mexico City; 43% of them make their home there.

Related articles:

How does Mexico score on the Social Progress Index?

 Books and resources  Comments Off on How does Mexico score on the Social Progress Index?
May 302013
 

The Social Progress Index measures the extent to which countries provide for the social and environmental needs of their citizens. It is a compound index, based on  52 indicators in the areas of Basic Human Needs, Foundations of Wellbeing, and Opportunity that show relative performance in order to elevate the quality of discussion on national priorities and to guide social investment decisions.

Social progress is the capacity of a society to meet the basic human needs of its citizens, establish the building blocks that allow citizens and communities to enhance and sustain the quality of their lives, and create the conditions for all individuals to reach their full potential.

The model used to develop the index is based on asking three key questions that help define social progress:

  1. Does a country provide for its people’s most essential needs? (Basic Human Needs)
  2. Are the building blocks in place for individuals and communities to enhance and sustain wellbeing? (Foundations of Wellbeing)
  3. Is there opportunity for all individuals to reach their full potential? (Opportunity)

In this inaugural Social Progress Index, each of these dimensions is disaggregated into four components, each measured by between two and six specific indicators. Each indicator has been tested for internal validity and geographic availability:

Criteria used to compile Social Progress Index

Criteria used to compile Social Progress Index. Click image to enlarge.

For example the Personal Rights component of Opportunity is comprised of 5 separate variables:

  • Political Rights (Freedom House)
  • Freedom of Speech (CIRI Human Rights Data Project)
  • Freedom of Assembly/Association(CIRI Human Rights Data Project)
  • Private Property Rights (Heritage Foundation)
  • Women`s Property Rights (Economist Intelligence Unit)

How does Mexico score on the Social Progress Index?

Of issues covered by the Basic Human Needs Dimension, Mexico does best in areas including Nutrition and Basic Medical Care and has the greatest opportunity to improve human wellbeing by focusing more on Personal Safety. Of issues covered by the Foundations of Wellbeing Dimension, Mexico excels at providing building blocks for people’s lives such as Health and Wellness but would benefit from greater investment in Access to Information and Communications. Of issues covered by the Opportunity Dimension, Mexico outperforms in providing opportunities for people to improve their position in society and scores highly in Personal Rights yet falls short in Access to Higher Education.

This is how Mexico’s performance stacks up in comparison to the other 49 countries in the survey:

  • Social Progress Index: score 49.7 = rank 25th
  • Basic Human Needs: 49.3 (29th)
  • Foundations of Wellbeing: 50.8 (23rd)
  • Opportunity: 49.1 (25th)

This post is based on a press release from the Social Progress Imperative. For more information about the methodology behind the Social Progress Index, please refer to the inaugural report.

Related posts: