The accuracy of Mexico’s unemployment statistics is frequently questioned in the media but INEGI, Mexico’s National Geography, Statistics and Information Institute, uses internationally accepted methods to compute various different unemployment indices. As in most countries, INEGI surveys are based on samples in urban areas, involving 80,000 interviews in more than 30 towns and cities.
The International Labour Organization defines “unemployed workers” as those members of the workforce currently not working but willing and able to work, who have actively sought work in the past four weeks. Note that the mere act of looking at newspaper or online ads is not considered sufficient evidence of “actively seeking work”.
Mexico’s economically active population in the third quarter of 2013 was 52.3 million people, a very slight (0.01%) increase on the comparable figure for 2012. The figure represents 59% of the total population aged 14 and over.
INEGI statistics show that the under-employed population was 8.5% of all those with jobs. The unemployed population was 2.7 million, 5.2% of the workforce.
Mexico’s workforce is not gender-independent. 77 out of every 100 men are economically active, compared to only 43 of every 100 women. The workforce can be subdivided between primary occupations (6.8 million, 13.8% of the total workforce); secondary occupations (11.9 million, 24%) and the tertiary or services sector (30.6 million, 61.6% of workforce), with the remaining 0.6% undeclared.
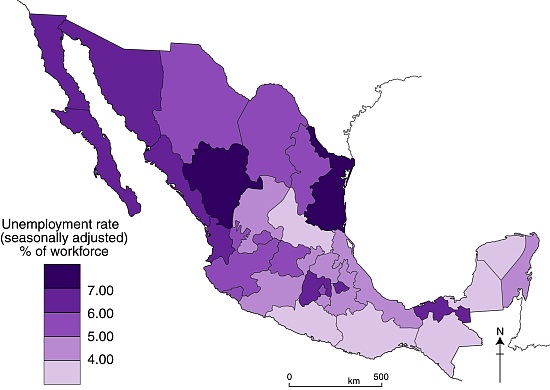
Unemployment in Mexico, third quarter of 2013. Cartography: Tony Burton; all rights reserved
Out-migration from several southern and western states has significantly reduced unemployment. Several southern states are among those with the lowest unemployment rates in the entire country.
The highest rates of unemployment are mainly in northern Mexico, parts of which have seen on-going violence in the war against drugs. Workers flocked to these areas during the boom times of Mexico’s maquiladora program when firms were encouraged to set up “in-bond” factories in these states, enjoying the freedom to import components and export finished products. However, the slow recovery of the US economy has reduced demand for consumer products and many maquiladora factories have reduced their workforce, leading to intense competition for available jobs and a higher rate of unemployment.
What other factors influence unemployment and help explain the patterns shown by the map?
This post describes the spatial pattern of unemployment in the third quarter of 2013. By way of comparison with 2010, see
Mexico’s economy and workforce are analyzed in chapters 14 to 20 of Geo-Mexico: the geography and dynamics of modern Mexico. Ask your library to buy a copy of this handy reference guide to all aspects of Mexico’s geography today! Better yet, order your own copy…
Sorry, the comment form is closed at this time.