Nov 262020
 

We have frequently published international comparisons showing how Mexico fares in comparison with other Latin American countries and major world economies for a wide variety of indicators.

Reliable comparisons for comparing countries on their Covid-19 response have been hard to come by, but here is a link to one compiled by Bloomberg News:

As the article concludes, Mexico’s response to Covid-19 does not bode well for future economic progress. Nor does it bode well for reducing economic and social disparities within Mexico.

Stay safe!

Which are the best states in Mexico for doing business in 2016?

 Mexico's geography in the Press  Comments Off on Which are the best states in Mexico for doing business in 2016?
Sep 232016
 

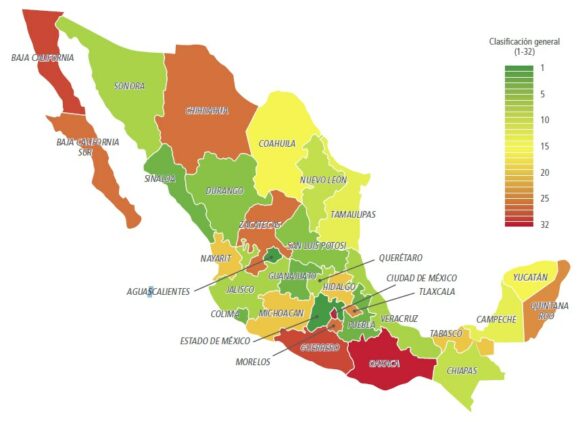
A study just released by the World Bank and the International Finance Corporation, Doing Business en México 2016, compares Mexico’s 32 states for the paperwork, time and costs associated with four major indicators: opening a new business, obtaining construction permits, registering industrial property rights and the resolution of commercial disputes.

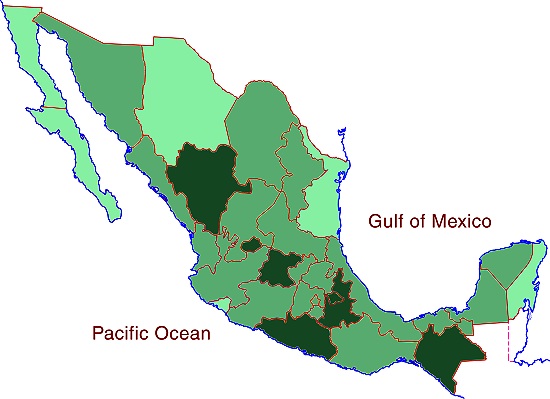
The report concludes that the seven best states in which to do business are Aguascalientes, the State of Mexico, Colima, Puebla, Sinaloa, Guanajuato and Durango, all of which offer a better performance than the average for OECD high income countries.

doing-business-2016-fig-1-2

Overall ranking for Doing Business in Mexico 2016 (Source: Fig 1-2 of World Bank Report)

The three states that have advanced the most towards implementing international best practices since 2014 are Puebla, Jalisco and the State of México.

The map shows the rank order of states for doing business, from green (the best) to red (the lowest ranking). Unlike many maps of state-by-state performance, this map does not show any evidence for the north-south divide we have repeatedly commented on in the past.

Related posts:

Aug 012016
 

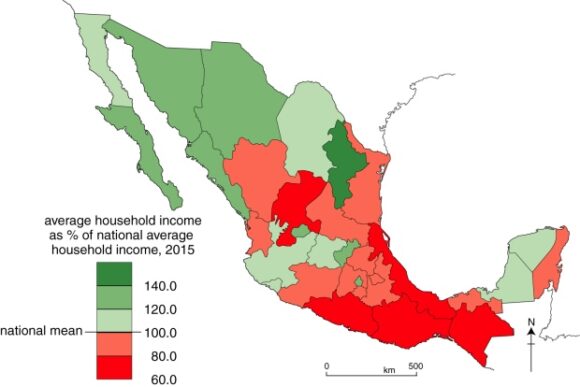
The National Statistics Agency’s (INEGI’s) 2015 Survey of Socioeconomic Conditions includes data for average household incomes in Mexico, on a state-by-state basis. The national average household income (for a three month period) is $45,887 (pesos) . The map below shows how each state’s average household income compares to the national average.

Household income, by state, 2015. Data: INEGI. Cartography: Tony Burton / Geo-Mexico; all rights reserved

Household income, by state, 2015. Data: INEGI. Cartography: Tony Burton / Geo-Mexico

The state with the highest household income is Nuevo León, with $66,836, more than 140% of the national average. The state with the lowest household income is Guerrero ($27,584), where the average household income is only 60.1% of the national average. Guerrero’s average household income is only 41% of the average for Nuevo León.

As we have regularly highlighted in the past, regional differences in Mexico are considerable, and a definite “north-south divide”can be identified for almost every socio-economic variable. Development efforts need to be focused on improving the key indicators for southern Mexico and reducing these regional disparities.

Related posts:

Gender disparities and the value of women’s work in the home

 Mexico's geography in the Press, Updates to Geo-Mexico  Comments Off on Gender disparities and the value of women’s work in the home
Apr 072016
 

In August 2012, in The value in Mexico of unpaid work in the home, we saw that a study by the National Statistics Institute (INEGI) based on 2010 data had calculated that routine work done in the home (almost 80% of the time-value involved comes from women) was worth about 2.9 trillion pesos to the Mexican economy each year, equivalent to more than 20% of Mexico’s GDP. The INEGI calculations included the costs in time/labor needed to meet the demands of the home, and the net salary that would be paid for someone undertaking similar tasks.

INEGI has just published updated statistics on this topic.  In 2014, unpaid work by women in the home was equivalent to 18% of GDP. This figure means that female contributions in the home continue to make a greater contribution to national GDP than manufacturing (16.7%), commerce (15.5%) or education (4.1%).

The latest INEGI figures show that for every 10 hours that women work (paid or unpaid), men work only 8.3 hours. According to INEGI, the average value of unpaid work by women in the home in rural areas amounted to  51,808 pesos a year (about US$4300 at the then rate of exchange). The value for women married or living with a partner was 61,456 pesos, compared to 26,082 pesos for single women. The average in households which included children under 6 years of age was 60,628 pesos.

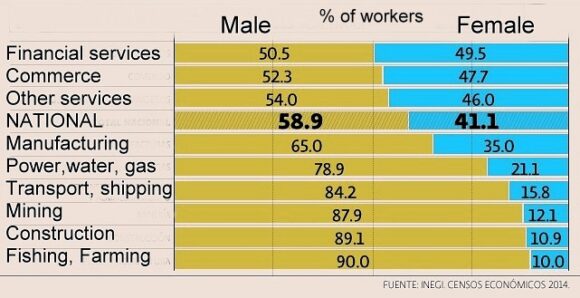
Of 29 million Mexicans in employment (in 5.7 million economic units), women account for 43.8% (graph):

% of women in different sectors of the workforce

% of women in different sectors of the workforce, 2014

The figures do reveal a slight decrease in gender inequality since the employment of women is rising slightly faster than that of men, by about 2.0%/year compared to the overall figure of 1.4%/year. In 2014, about 50% of service workers, 34.5% of manufacturing workers, and 11.0% of construction workers were female.

Related posts:

Historic photo of the month: Mexico City cave-dwellers

 Other  Comments Off on Historic photo of the month: Mexico City cave-dwellers
Jul 232015
 

A shout out to Marcia Ambler for sharing, via email, her memories of Mexico City in the 1950s. Among other things, she recalled how she lived as a child with her family, “in a suburb of Mexico City, where there was a deep barranca with people who lived as cliff dwellers in the barranca walls. There was also a cave nearby with a deep drop which I went in with my friends.”

Her email brought back some fond personal memories of Mexico City from the late 1970s and early 1980s. Shortly after I moved to the city, Time Life published The Great Cities: Mexico City, by John Cottrell. I found this book fascinating at the time, and a quick re-read earlier this week confirms that it still well worth looking for (inexpensive copies available via Abebooks) if you are interested in what makes one of the world’s largest cities tick.

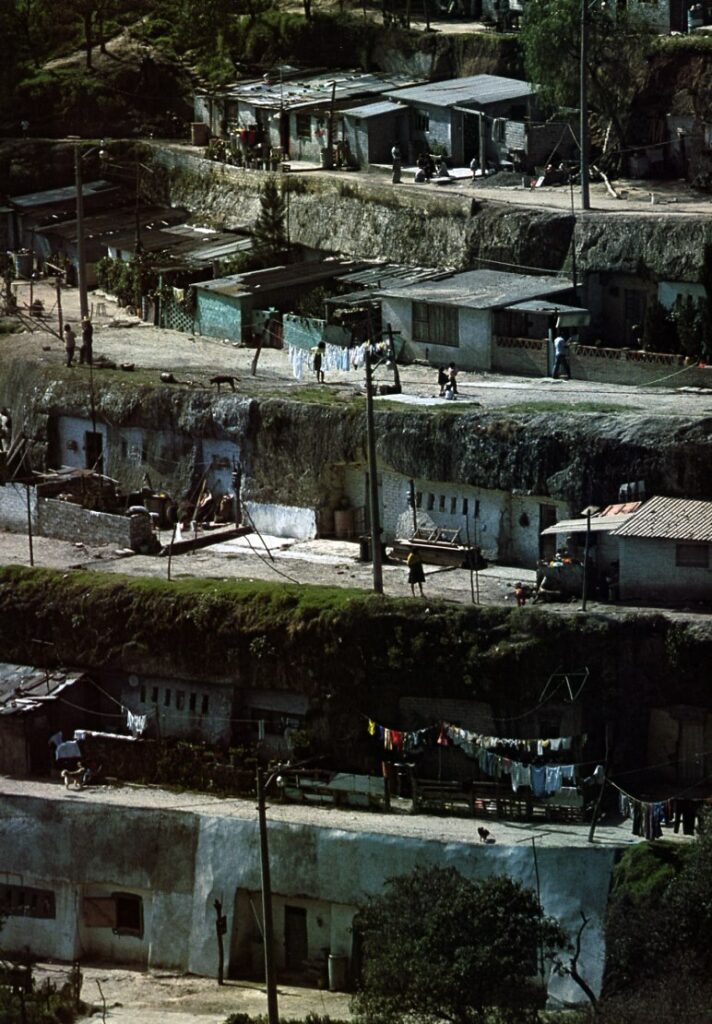
Mexico City cave dwellers. Photo by from The Great Cities: Mexico City" (Time Life books).

Mexico City cave dwellers. Photo by Harold Sund in “The Great Cities: Mexico City” (Time Life, 1979).

Like most Time Life books, it is lavishly illustrated, which brings me back to the caves and cave dwellers, since one of the photos (above), by Harold Sund shows the area that Marcia remembers, and which was also my first introduction to the curious world of relatively modern-day troglodytes in Mexico City.

Sund’s photo shows the Belén de las Flores community, relatively close to western end of Chapultepec Park, though there may well have been, and almost certainly were, several similar settlements elsewhere. This short newspaper article, from the Bangor Daily News in 1978, describes the “year-round comfort” that can be enjoyed in such caves.

I haven’t had the opportunity to revisit this area of Mexico City for more than thirty years, so I’m anxious to know what it looks like now.

Sincere thanks, Marcia, for your message which certainly took me on a trip down memory lane!

Source of photo:

  • John Cottrell. 1979. The Great Cities: Mexico City (Time Life Books, 1979). Photography by Harold Sund.

Related posts:

Which states in Mexico are the most competitive?

 Maps, Mexico's geography in the Press  Comments Off on Which states in Mexico are the most competitive?
Dec 032014
 

The Mexican Institute for Competitiveness (Instituto Mexicano para la Competitividad AC, IMCO) has published its annual analysis of the competitiveness of Mexico’s states. The report provides some interesting insights into which areas of Mexico are “most competitive” in business terms, defined as their capacity to attract and retain investments and a talented workforce.

This suggests a business environment that maximizes the socio-economic potential of both the business entities and individuals residing in a a specific area. It also suggests that any improved well-being (economic and social) will be maintained (sustained).

The index is based on 89 indicators in 10 sub-indices. The 10 major factors include the reliability and objectivity of the legal system, the sustainable management of the natural environment, the stability of macroeconomic policies, the degree to which society is non-divisive, educated and healthy, and the stability and functioning of the political system.

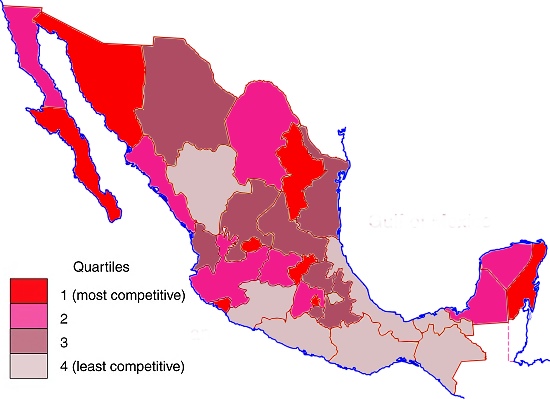
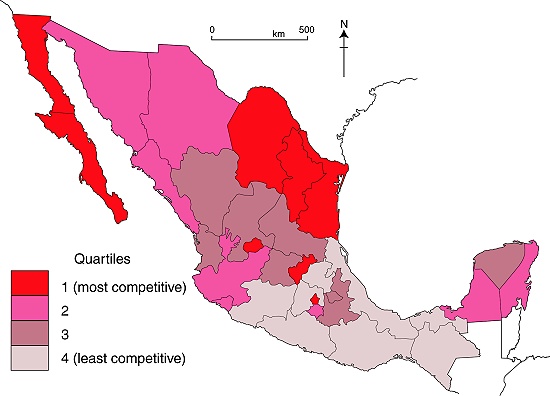
The latest report relies on 2012 data. Mexico’s basic pattern of competitiveness at the state level is shown in the map.

Mexico, 2014. Map: Tony Burton; all rights reserved

Competitiveness in Mexico, 2014. Map: Tony Burton; all rights reserved

The five most competitive states in Mexico are:

  • Federal District (Mexico D.F.)
  • Baja California Sur
  • Aguascalientes
  • Nuevo León
  • Querétaro

While a full analysis of why some states are more competitive than others is beyond the scope of this post, the single most striking aspect of this map is the persistent low degree of competitiveness of several of Mexico’s poorest states, such as Guerrero, Oaxaca and Chiapas.

In general, states in Northern Mexico are noticeably more competitive than those in Southern Mexico. Two areas on opposite coasts where tourism is extremely important to the local and national economy – Baja California Sur and Quintana Roo – are both very competitive.

Mexico’s economy and workforce are analyzed in chapters 14 to 20 of Geo-Mexico: the geography and dynamics of modern Mexico. Ask your library to buy a copy of this handy reference guide to all aspects of Mexico’s geography today! Better yet, order your own copy, which will still arrive in time for Christmas…

Related posts:

Disparities in wealth in Mexico: trends include a growing middle class as well as more millionaires

 Mexico's geography in the Press  Comments Off on Disparities in wealth in Mexico: trends include a growing middle class as well as more millionaires
Jun 242013
 

Two recent studies shed an interesting light on the distribution of wealth in Mexico. The first, carried out by the the National Statistics Agency (INEGI) is that agency’s first ever analysis of Mexico’s social classes. The study found that 12.3 million homes and 44 million people (39% of the total population) were “middle class” in 2010, up from 35% in 2000. In urban areas, 47% of the population was middle class, compared to just 26% in rural areas. Middle class homes had at least one computer, spent about 115 dollars [1,470 pesos] a month on eating and drinking outside the home, had at least one resident with a credit card and one with formal employment. In most cases, the head of household had gained a tertiary qualification. The same report found that almost 60% of Mexico’s population matched the criteria for “lower class”, while only 1.7% of the population could be best described as “upper class”.

However, a second study, by consultancy WealthInsight (“Mexico Wealth Book: Trends in Millionaire Wealth“) provides compelling evidence that the number of wealthy and super-wealthy individuals in Mexico has risen sharply. From 2007 to 2012, during the administration of President Felipe Calderón, the number of millionaires in Mexico rose by 32%, whereas the global average for the same period (which included economic recession in the USA and Europe) declined by 0.3%.

WealthInsight found that in 2012 Mexico had 145,000 individuals with a “High Net Worth” (defined as over a million dollars in assets besides their principal residence). Together these high net worth individuals hold a fortune of $736 billion, equivalent to 43% of Mexico ‘s total individual wealth. This number is well above the worldwide average of 29%, indicating that Mexico has a relatively uneven distribution of wealth. What’s more, WealthInsight expects the trend to continue and predicts that by 2017, the number of millionaires in Mexico will grow a further 47% to reach 213,000.

Included in the figure for millionaires are 2,540 multimillionaires (with individual net assets of $30 million or more), 2272 “affluent millionaires”(net assets between $30
million and $100 million) and 252 “centimillionaires” (net assets between $100 million and $1 billion). Mexico also has 16 billionaires, a number expected to rise to 21 by 2017. Grouped together, these ultra high net worth individuals are worth $364 billion in total combined wealth. By 2017 the total wealth of multimillionaires is projected to increase by 44% to reach $525 billion. The report predicts that the total wealth of Mexican billionaires will grow by 26% to reach $241 billion by the end of 2017.

The Mexican city with most multimillionaires is Mexico City; 43% of them make their home there.

Related articles:

Where are the wealthiest households in Mexico?

 Other  Comments Off on Where are the wealthiest households in Mexico?
Nov 102011
 

A recent publication from the public opinion research consultancy Mitofsky offers some insights into the distribution of different socio-economic groups within Mexico.

The Mitofsky study relies on the AMAI 10×6 system to tabulate the percentage of households in each state that fall into six distinct categories: A/B, C+, C, D+, D and E.

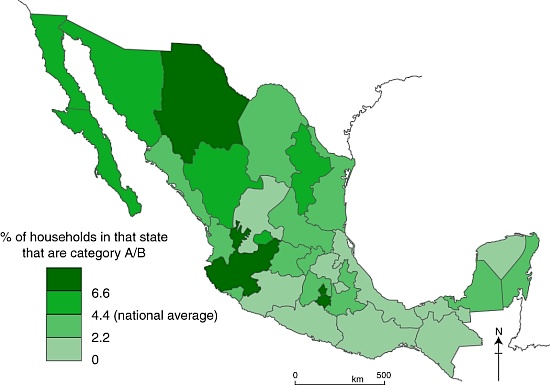
Across Mexico as a whole, 4.4% of households are categorized as A/B (the highest category, see map below), 12.3% as C+, 17.9% as C, 39.1% as D+, 21.6% as D and 4.7% as E (the lowest category).

The data show that, between them, four states–the Federal District (23.4% of all A/B households in Mexico), Jalisco (14.4%), State of México (9.3%) and Nuevo León (5.9%)– account for more than half of all the homes in this category in Mexico

The map shows how the incidence of A/B households (the highest socio-economic category) vary, state by state, across the country.

Distribution of highest socio-economic status households in Mexico.
Households in the highest socio-economic group in Mexico. (Geo-Mexico/Tony Burton; all rights reserved)

Do you live in an A/B household?

1. Housing characteristics:
– average of 6-8 rooms (often 3 bedrooms, 3 bathrooms) built of brick and/or concrete
– floors tiled, hardwood or stone; more likely to have carpets or rugs than lower categories
– most are owner-occupied, not rented

2. Sanitary Infrastructure
– connected to municipal potable water and sewer systems
– all have tub, shower, and water heater (usually using gas)
– two-thirds of these homes have water cisterns and pump to supply water tanks.
– some have air conditioning and/or central heating

3. Practical Infrastructure
– average 2 vehicles
– all have stoves, refrigerators and washing machines
– almost all have microwave ovens, blenders, toasters, coffee-makers and juice extractors

4. Communications and Entertainment Infrastructure
– almost all have fixed line telephones and cell phones
– most have 3 or 4 TVs and  satellite or cable TV
– all have DVDs and stereos/CD players; half have video game consoles
– average more than 1 computers per household; 75% connected to Internet
– many have memberships of private sports clubs and own a second home or time-share.
– more than 50% have traveled by air at least once in last 6 months, and most travel overseas at least once a year

5. Educational and Occupational Profile of Head of Family
– usually has a bachelor’s degree or higher
– work in medium or large companies, as directors, CEOs or other high-ranking professionals

6. Expenditures
– these households save more, but also spend more on education, entertainment, communication and vehicles
– food purchases account for only 7% of total expenditures, well below the average for the total population
– of these food purchases, the proportion spent on dairy products, fruit, and drinks is greater than lower categories

Questions worth thinking about:

  • How does this map compare to other maps on Geo-Mexico of inequalities across the country? (Use the site search feature or tags from the tag cloud on the left hand side of each page to find other inequality maps)
  • To what extent does this map confirm that north-south divide described in several previous posts?

Source:

Niveles socioeconómicos por entidad federativa 2009 – 2010 by Roy Campos and Ana María Hernández; CONSULTA MITOFSKY, December 2010.

Related Posts:

Are Mexicans the world’s hardest-working people or the least productive?

 Books and resources  Comments Off on Are Mexicans the world’s hardest-working people or the least productive?
Jun 042011
 

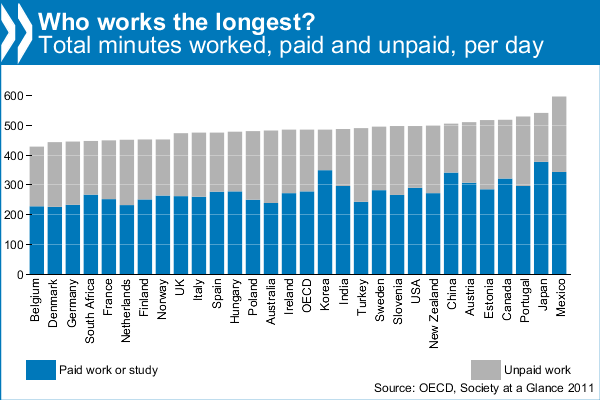
The headline — “Mexicans work longer hours than anyone else” — said it all, or did it? A recent report from the OECD (Organisation for Economic Co-operation and Development) found that Mexicans worked longer hours than people in any other OECD country, devoting 10 hours a day to paid and unpaid work (the latter includes housework and cooking). By contrast, Belgians work the least, only 7 hours. The OECD average is 8 hours a day. Is the positive spin simply because the OECD is currently headed by Mexican economist Dr. Angel Gurría?

The figures come from the latest edition of OECD’s Society at a Glance (2011), which gives an overview of social trends and policy developments in all member countries. Using indicators taken from OECD databases and other sources, it shows how societies are changing over time and how different countries compare.

Most unpaid work is housework. Mexicans do the most, more than 3 hours per day, and Koreans the least, only 79 minutes. Mexicans spend more time cooking than is customary in most other countries. The inhabitants of the USA spend the least time cooking each day, barely 30 minutes, and Turks the most, 74 minutes. Most people spend around 50 minutes a day cooking. Shopping also makes up a big part of unpaid work. The OECD average is 23 minutes a day, with the French spending the most (32 minutes) and the Koreans the least (13 minutes).

OECD: Working Hours

OECD: Working Hours

The report also attempts to estimate how much unpaid work is worth as a percentage of GDP for the 25 OECD countries for which data are available. It finds that the value of unpaid work is considerable, equivalent to about one-third of GDP in OECD countries, ranging from a low of 19% in Korea to a high of 53% in Portugal.

From a Mexican perspective, this may all paint a very rosy picture. However, as other commentators (see, for example, Burro Hall) have pointed out, it could equally well mean that Mexicans have the lowest productivity in the world, since they are working longer hours than other countries, but failing, in most sectors, to out-perform them!

Other highlights from the OECD’s Society at a Glance:

  • The 4 hours and 21 minute difference in unpaid work time between Mexican women and men is the largest in the OECD, where the average gap is 2 hours and 28 minutes
  • Mexicans have the second highest level of income inequality and the highest level of relative poverty in the OECD. One in every five Mexicans are poor, compared to just above one in ten on average across the OECD. Nearly half of Mexicans find it difficult or very difficult to get by on their current income.
  • Mexicans report the third highest positive psychological experiences (feeling rested, smiling, learning, and enjoyment) and lower than average negative experiences (pain, worry, stress, sadness, depression).

Children of Mexico’s indigenous groups are disadvantaged from birth

 Mexico's geography in the Press  Comments Off on Children of Mexico’s indigenous groups are disadvantaged from birth
May 302011
 

About 12% of Mexico’s population belongs to one or other of the numerous indigenous groups in the country. According to Mexico’s National Human Rights Commission (NHRC), Indian children under 5 years old are the group with the most needs in Mexico. They have a mortality rate that is 60% higher than that of non-Indian children.

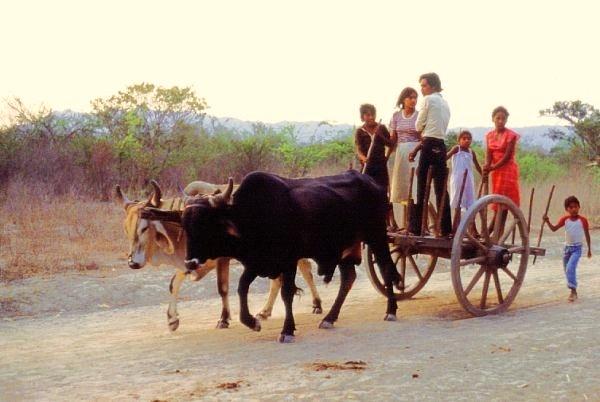
Indigenous children in Mexico

Their disadvantages “increase when they belong to communities characterized by poverty, marginalization and discrimination.” Almost one-third of all children under 5 years of age belonging to Mexico’s indigenous population are below average height and weight. Illiteracy for this group is four times higher than the national average, because many of them leave school early to help their families make ends meet.

Related posts:

Chapter 10 of Geo-Mexico: the geography and dynamics of modern Mexico is devoted to Mexico’s indigenous peoples. Many other chapters of Geo-Mexico include significant discussion of the cultural and development issues facing Mexico’s indigenous groups.

Apr 302011
 

The quality of housing in Mexico has improved significantly in the past two decades. By the 2010 census, 97.8% of Mexican households had access to electricity, compared to 95.0% in 2000 and 87.5% in 1990. That this figure is approaching 100% is a real accomplishment given that many Mexicans live in very isolated mountainous communities. As of mid-2010, 93.5% of rural households had electricity, compared 98.2% for towns between 2,500 and 15,000 and over 99% for larger towns and cities. Anyone who has lived without electricity knows what an incredible improvement it can make to one’s comfort and quality of life.

With smaller family sizes, household crowding has also declined. It went from 5.0 persons per household in 1990 to 4.4 in 2000 and 3.9 in 2010. The percentage of households with dirt floors is now down to 6.2%, compared to 13.2% in 2000 and 19.5% in 1990. In rural areas, 15.1% of houses have dirt floors compared to 7.7% in towns between 2,500 and 15,000.

The vast majority of rural houses now have piped water. In the 125 least developed municipalities in rural Mexico, over 63% of households have piped water, which is one of the most important factors for improved family health. Almost 39% of the households in these poor municipalities have sewers, a convenience that most rural residents now have. However, about half of all rural households still cook with firewood or charcoal.

Rural households are gaining increasing access to modern electrical conveniences. Almost 80% now have a television set, 62% have a refrigerator, 42% have a washing machine, and 36% have a cell phone (only 17 % have a wired telephone line). While these percentages are significantly higher in urban areas (TVs – 97.5%, refrigerators – 91.7%, washing machines – 78.4%, and cell phones – 78.4%.), life in rural Mexico is improving dramatically. However, rural areas are lagging significantly in access to the cyber-age. Only 6.8% have a computer in the house and 2.5% have internet access. Urban access is much higher: 42.7% for home computers and 33.1% for internet access. On the other hand, many rural households gain access to computers and the internet by using cyber-cafes, which have spread rapidly into small Mexican communities.

Local "bus" to the train station, Tehuantepec, 1985

Local "taxi" to the train station, Tehuantepec, Oaxaca, 1985. Photo: Tony Burton; all rights reserved

Access to public transportation has also improved in rural areas (see photo, taken in 1985). In mid-2010, 73% of rural residents had access to public transportation (usually bus or taxi). Access varies with community size. Of those in communities of 1,000 to 2,500, almost 90% have access, while only 37% of those localities of under 250 population had access to public transportation.


Mexico’s cities and towns are analyzed in chapters 21, 22 and 23 of Geo-Mexico: the geography and dynamics of modern Mexico. Rural Mexico is the subject of chapter 24. Living standards, including housing, are discussed in chapter 28. Buy your copy today!!

Apr 282011
 

Literacy levels in Mexico among those over age 15 have increased rather steadily for more than a century, reaching 93.1% in 2010. The Federal District had the highest literacy level, 97.9%, while the lowest levels were in Chiapas, 82.2%; Guerrero, 83.3% and Oaxaca, 83.7%. The gap between the Federal District and Chiapas is quite large at 15.7 percentage points (97.9% – 82.2%). In the decades ahead, do we expect this gap to decline or increase?

To address this question, we can look at the 2010 census which provides data on literacy levels for children aged six to 14 for all 32 states. To compare literacy among states, we can use the data on 14-year-olds, who have higher literacy levels than the younger children. Among 14-year-olds, the Federal District has the highest literacy level at 98.89%. States with the lowest levels are Chiapas, 96.27%; Guerrero, 96.86%; Oaxaca, 97.75%; and Michoacán, 97.79%. The gap between the highest and lowest is only 2.62 percentage points. This gap is far less than the gap of 15.7 percentage points in literacy for those over age 15 discussed earlier.

These data indicate two things:

  • The literacy gap between states is closing and closing rather quickly.
  • Mexico is approaching universal literacy.

A more thorough analysis of geographical literacy gaps would include rural–urban comparisons and levels of literacy for adults and children in various sized communities. In general, literacy rates in Mexico tend to be correlated with community size; they are highest in the large cities, and lowest in rural areas. We will undertake this type of analysis when the appropriate data from the 2010 census become available.

Related post: Females, males and gender inequality in Mexico

2010 Census data show a significant improvement in Mexican education

 Updates to Geo-Mexico  Comments Off on 2010 Census data show a significant improvement in Mexican education
Apr 192011
 

Mexicans over age 15 are now getting 8.6 years of schooling on average, compared to only 7.5 years in 2000 and 6.5 years in 1990. The increase of over a year in the past decade is impressive. While males are still getting more education than females, the gap is closing. Males got 8.8 years of education in 2010 while females got 8.5 years. However, female education has increased by 1.3 years since 2000 compared to 1.1 years for males.

Not surprisingly, educational attainment is not equally distributed among Mexico’s 32 states. The Federal District has the highest level with 10.5 years, followed by Nuevo León with 9.8, Coahuila with 9.5, and Baja California Sur and Sonora both with 9.4. At the other end, Chiapas was lowest with an average of 6.7 years. Other states at this end are Oaxaca with 6.9, Guerrero with 7.3, and Michoacán with 7.4 years.

If we look at Mexico’s 2,442 municipalities, the inequality is even greater. Urban areas tend to have significantly higher education levels than rural areas. The municipalities with the highest levels are Benito Juárez, D.F. with 13.9 years, followed by San Pedro Garza García, N.L. (12.3), Miguel Hidalgo, D.F. (12.3), San Sebastian Tutla, Oax. (12.1), and Coyoacán, D.F. (12.1). By comparison, average educational attainment in the USA and Canada are 12.0 and 11.6 years respectively. It is interesting that two of the municipalities in the top ten for average level of education are in Oaxaca, a state with one of the lowest overall levels of education.

At the bottom end, the municipality with the lowest average level of education is Cochoapa el Grande in Guerrero with 2.3 years, followed by Coicoyán de las Flores, Oax. (2.5), San Martin Peras, Oax. (2.8) and Mixtla de Altamirano, Ver. (2.9). All the lowest ten in terms of educational attainment are predominantly indigenous municipalities.

Though municipalities lagging in educational attainment still have a long way to go, they are making very impressive progress. In the least developed 125 municipalities in Mexico, school attendance for children between 6 and 15 years of age is an impressive 88%. The percentage for the most developed 125 municipalities is 96%. The figures indicate that in the next few decades the gap in adult educational attainment between the highest and lowest municipalities should decline very significantly.

The most competitive states in Mexico

 Other  Comments Off on The most competitive states in Mexico
Dec 192010
 

According to a recent report released by the Mexican Institute for Competitiveness (Instituto Mexicana para la Competitividad, IMCO), the five most competitive states in Mexico are:

  • Federal District (Mexico D.F.)
  • Nuevo León
  • Querétaro
  • Coahuila
  • Aguascalientes

These five states account for:

  • 65% of foreign direct investment (FDI)
  • 53% of patents
  • 49% of researchers
  • 31% of major corporations
  • 29% of national GDP

By comparison, the five least competitive states—the states of Mexico, Tabasco, Guerrero, Chiapas, Oaxaca— account for 4% of foreign direct investment (FDI), 9% of patents, 9% of researchers, 14% of major corporations and 17% of national GDP.

A national map and summary of the methodology behind these rankings is provided in an earlier post:

For full details of the study:

Mexico’s economy and workforce are analyzed in chapters 14 to 20 of Geo-Mexico: the geography and dynamics of modern Mexico. Ask your library to buy a copy of this handy reference guide to all aspects of Mexico’s geography today! Better yet, order your own copy, which will still arrive in time for Christmas…

Dec 122010
 

The map below shows the average number of inhabitants per household (“household size”) for each of Mexico’s states.

The national average household size is 3.9 persons. The middle band on the map shows those states with household size between 3.7 and 4.0 inclusive. The darkest shade shows states with a household size of 4.1 or greater; the lightest shade shows those with a household size of 3.6 or smaller.

Average household size in Mexico, 2010

Average household size in Mexico, 2010. Cartography: Tony Burton; all rights reserved.

Discussion questions:

  • Compare this map with the maps of:
  1. potable water,
  2. GDP/person
  3. infant mortality
  • Discuss the possible reasons for any connections you note between household size, potable water, GDP/person and infant mortality.
  • What other factors might also affect household sizes?
  • What are the drawbacks to using any of these measures (household size, potable water, GDP/person, infant mortality) on their own as a development indicator?

Development indices of various kinds are discussed in chapters 29 and 30 of Geo-Mexico: the geography and dynamics of modern Mexico. Ask your local library to purchase a copy today!

Which states in Mexico are the most competitive in business terms?

 Books and resources, Teaching ideas  Comments Off on Which states in Mexico are the most competitive in business terms?
Nov 012010
 

A recent report from the Mexican Institute for Competitiveness (Instituto Mexicano para la Competitividad, IMCO) provides some interesting insights into which areas of Mexico are “most competitive” in business terms. The latest report relies on 2008 data. The IMCO Competitiveness figures are usually compiled for a major urban area or a state, and international comparisons are also possible at the country level. For example, IMCO found that Mexico ranks 31st in the world for competitiveness, immediately behind Brazil, but ahead of China (rank 38). Mexico’s basic pattern of competitiveness at the state level is shown in the map.

IMCO defines competitiveness as the capacity to attract and retain investment and talent. This suggests a business environment that maximizes the socio-economic potential of both the business entities and individuals residing in a a specific area. It also suggests that any improved well-being (economic and social) will be maintained (sustained).

Map of competitiveness in Mexico, 2008

Competitiveness in Mexico, 2008. Map: Tony Burton; all rights reserved

The IMCO index of competitiveness is based on 120 key variables, grouped into 10 major factors affecting competitiveness. All the variables must be ones which are regularly updated and easy to interpret, with transparent methods of calculation. The 10 major factors include the reliability and objectivity of the legal system, the sustainable management of the natural environment, the stability of macroeconomic policies, the degree to which society is non-divisive, educated and healthy, and the stability and functioning of the political system.

  • Using the map above, how would you describe the pattern of competitiveness in Mexico? (north/south? coastal/inland?, proximity to the USA?)
  • Does the pattern of competitiveness match the pattern of GDP/capita? In what way is the State of Mexico an anomaly in this regard? Are there other anomalies?

A full analysis of why some states are more competitive than others is beyond the scope of this post. However, given its relevance to geographers, we will examine the specific variables that make up the sustainable management of the natural environment in a future post, when we will also take a look at the trends for that indicator.

Mexico’s economy and workforce are analyzed in chapters 14 to 20 of Geo-Mexico: the geography and dynamics of modern Mexico. Ask your library to buy a copy of this handy reference guide to all aspects of Mexico’s geography today! Better yet, order your own copy…

Jul 082010
 

Mexico City’s inner city slums date from the regime of Porfirio Díaz (1877–1910) which stimulated rapid railroad expansion and industrialization north and northwest of the city center. The industrial zone expanded out along the rail lines into the areas now known as Azcapotzalco and Gustavo A. Madero.

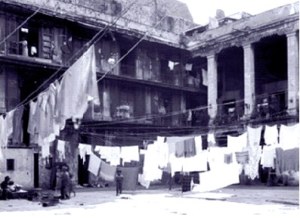
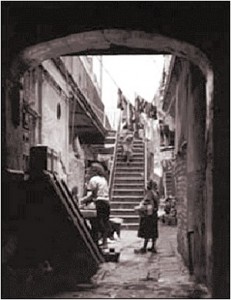
Typical vecindad, Mexico CityWith this expansion, the upper classes sold or abandoned their inner city colonial mansions and moved further west, deliberately avoiding noisy and polluted industrial areas. Their abandoned multi-storied mansions were converted into vecindades, cheap tenements with individual rooms rented to families.

Vecindades, with a shared central court, kitchen and latrines, became Mexico City’s first slums. They encircled the center on the north, east and south; the west side remained upscale. As these eventually became overcrowded, incoming migrants moved into cheap, undesirable housing in the industrial zone or on the urban periphery.

Vecindad, Mexico CityRapid industrialization after World War II brought another massive wave of poor immigrants. They initially headed for the low rent vecindades which had expanded as developers built new tenements using the old vecindades as a model.

Following government-mandated rent control, many investors abandoned the vecindades, depleting an already poor housing stock. Affordable housing emerged as a paramount concern of low-income residents; most were forced into colonias populares either on very steep hillsides or the urban periphery, such as Nezahualcoyotl.

While vecindades are most closely associated with Mexico City, they also emerged in Mexico’s other large cities. About ten percent of Mexico City’s current residents live in vecindades.

Mexico’s cities and towns are analyzed in chapters 21, 22 and 23 of Geo-Mexico: the geography and dynamics of modern Mexico. Buy your copy today!!

Nezahualcoyotl, an irregular settlement which grew into a monster

 Excerpts from Geo-Mexico, Updates to Geo-Mexico  Comments Off on Nezahualcoyotl, an irregular settlement which grew into a monster
Jul 022010
 

Rapid industrialization north of Mexico City after World War II brought a giant wave of immigrants aggravating a serious shortage of low income housing. With the vecindades (inner city slums) severely overcrowded, the only alternative was “irregular housing” or “colonias populares.” These were developed wherever there was vacant land, mostly in the west and north of the city on the dry former lakebed or on very steep slopes. They all followed a development pattern roughly similar to that of Nezahualcoyotl, the largest and best known colonia popular.
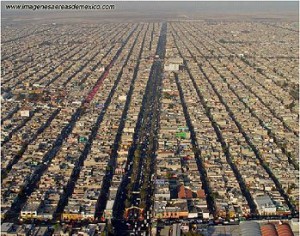
The densely packed housing of Nezahaulcoyotl in all its glory

The densely packed housing of Nezahaulcoyotl in all its glory. Image: imagenesaereasdemexico.com. Follow link at end of post for more Mexico City photos

In the late 1950s, a group of speculators gained de facto possession of roughly 78 square kilometers  (30 square miles) of former lakebed in Nezahualcoyotl just east of the Mexico City airport. They sold nearly 200,000 plots cheaply and on credit, a few dollars down, and a few dollars a month, for 10-20 yrs.

Families bought plots and immediately started to erect shacks. Aside from electricity, which was provided by the national utility, the plots initially lacked basic services such as potable water, sewerage, flood drainage, pavement, schools, etc. Without services, Nezahualcoyotl was illegal under State of Mexico law; but the government tolerated this situation.

The community became an immediate boom town. By 1970, the population was over 600,000, but still over half the area was without paved streets, water supply and drainage. Summer brought floods while the rest of the year it was an arid dust bowl.

Residents became frustrated with the broken promises of the developers, demanded that they be jailed for fraud, and stopped their monthly payments. The feud lasted for years and some developers were actually jailed. Eventually most of the area was “regularized”, meaning that residents got legal deeds and basic services. They continued to improve their houses and communities.
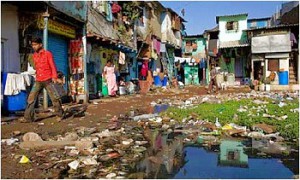
Nezahualcoyotl, the city of dreams

Nezahualcoyotl, the city of dreams

By 1980, the population reached about 1.3 million, making it one of the largest and most densely populated municipalities in the country.

By 2000, Nezahualcoyotl had essentially joined the mainstream. Nearly all residents had electricity and TVs, over 80% had refrigerators, 60% had telephones, nearly one in three had access to an automobile, and almost one in five had a computer. While Nezahualcoyotl has slums, gangs and crime, it also has tree-lined boulevards, parks, a zoo, banks, shopping centers, offices, libraries, hospitals, universities, cinemas, and apartment buildings. It even has a cathedral (since 2000) and an Olympic sports stadium, which hosted some 1986 FIFA World Cup matches. Currently, it is a vital part of metropolitan Mexico City and provides jobs for almost 250,000.

From irregular settlement to massive urban monster; Cd. Nezahualcoyotl has certainly come a long way!

Mexico’s cities and towns are analyzed in chapters 21, 22 and 23 of Geo-Mexico: the geography and dynamics of modern Mexico. Buy your copy today!!
Jun 292010
 

With very rapid growth in the mid-20th century, inner city urban slums could not absorb all the new low income immigrants. The only viable option was so-called “irregular” housing or colonias populares. Irregular housing schemes were initiated by developers who gained ownership of large tracts of contiguous land on the urban periphery. Some of these tracts were illegally obtained ejido properties. Whether ejido or not, the tracts usually consisted of marginal lands, either prone to seasonal flooding or on very steep hillsides.

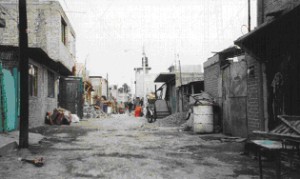
A colonia popular in Mexico

One of Mexico's many "colonias populares"

The land was subdivided into numerous small lots and sold on an installment plan to low-income families, who would construct low cost one room shacks which they called “home.” These neighborhoods were called “irregular” because many residents lacked legal deeds to their lots, their houses did not meet building codes, and they usually lacked important urban services.

Investors could not legally sell building lots without services such as water, drainage, paved streets, electricity and other basic infrastructure. However often investors did little more than mark the services on the property maps and provide “paper” services. Lots with actual services were considerably more expensive and beyond the reach of most of the urban poor. In general, local government tolerated these unserviced and illegal developments, because they helped relieve the low income housing crisis.

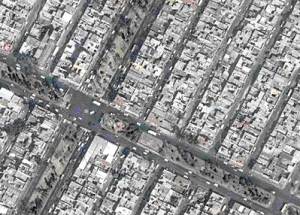
Street plan of a "colonia popular"

Street plan of a "colonia popular"

Developers could make fortunes with these housing schemes. In a one square kilometer piece of land they could sell up to 10,000 lots (each averaging 100 square meters, or 1076 square feet). At $200 a lot, this brought them $2 million. Developers often reneged on their promises to provide services, though their plans did at least provided vacant strips of land between lots, which became known as “paper streets”.

In the beginning, many “irregular” communities lacked running water, sewers, drainage, electricity, and public transport. However, eventually the needed services were provided and the residents upgraded their houses. After a decade or two, most of these communities became completely “regularized” with water, sewers, drainage, electricity, telephones, cable TV, retail stores, schools, bus routes, medical clinics, offices, and even movie theaters, shopping centers, and office buildings. In most large Mexican cities, roughly half of all current housing started as “colonias populares”.

Mexico’s urban geography is analyzed in chapters 21, 22 and 23 of Geo-Mexico: the geography and dynamics of modern Mexico. Buy your copy today, and read more about the fascinating history and structure of Mexico’s cities.