Population change in Jalisco, 2000-2010

 Maps  Comments Off on Population change in Jalisco, 2000-2010
Jan 242017
 

During the ten years between 2000 and 2010, Jalisco’s population increased by over a million from 6,322,002 to 7,350,355. Suburbs around Guadalajara dominated demographic change increasing by 887,301 (43.2%) to 2,940,118 (see Population change in the Guadalajara Metropolitan Area). The greatest growth was in the southern suburb of Tlajomulco which grew 237% from 123,619 to 416,552. Interestingly, the population of the central city of Guadalajara decreased by 152,185 to 1,494,134.

In this post, we look at the pattern of population change for the other municipalities in the state of Jalisco. The map shows the average annual percentage change in population for the period 2000-2010. It is worth noting that the population of a place with an annual growth rate of 3% will double in about 24 years.

Map of population change in Jalisco

Population change in Jalisco, 2000-2010. Copyright Tony Burton. Click image to enlarge.

What other areas of Jalisco are growing fastest?

Puerto Vallarta, the other major urban area in the state, grew by 38% to 255,725. The northern suburbs of Puerto Vallarta in the state of Nayarit grew even faster. The other major ex-pat area around Lake Chapala grew more slowly. Chapala grew by 12.4% to 48,812, Jocotepec by 18.0% to 42,142, while Poncitlan increased by 18.6% to 48,407.

Jalisco grew by 16.3% during the decade or an average increase of about 1.5% per year. But rates of population growth varied greatly from one area to another.

As indicated in the map, many of the isolated rural municipalities in the state actually declined in population (yellow-green and yellow areas). While births in these rural communities generally exceeded deaths, they experienced significant out migration.

In addition, many other rural communities in western Jalisco grew slowly at less than 1% per year (light pink on the map). Most of the communities in eastern Jalisco grew 1 – 2% about the same rate as the state as a whole.

Surprisingly, three of the most isolated municipalities in far northern Jalisco grew rapidly at over 3% per year. These municipalities are home to many indigenous Huichol Indians. Only relatively low numbers of Huichol Indians have migrated away from their ancestral homelands, so out-migration from these municipalities is much lower than from other remote parts of the state. In recent years, mining activity which was the mainstay of the economy of this area in colonial times, has made something of a comeback, thereby increasing local economic activity and opportunities.

Methodological note: The map depicts the municipal boundaries as they existed in the year 2000. Since that time, the municipality of Arandas has been split into two, reducing its territorial extent, and creating the new municipality of San Ignacio Cerro Gordo.

Photos of Mexico’s indigenous peoples

 Books and resources  Comments Off on Photos of Mexico’s indigenous peoples
Jul 212016
 

Mexican photographer Diego Huerta has spent the past four years on a quest to photograph all of the indigenous groups in the country. He publishes select images on his website and on his instagram account and the collection of images makes for compelling viewing, hence articles about him in the press, including one entitled “Photographer Captures The Breathtaking Beauty Of Mexico’s Indigenous Communities” in the Huffington Post.

Related posts

For an introduction to Mexico’s indigenous peoples see An overview of Mexico’s indigenous peoples. Recent research has shown that the indigenous groups are more genetically diverse than was previously thought. They add a very significant diversity to the languages spoken in Mexico. See, for example, The geography of languages in Mexico: Spanish and 62 indigenous languages, and Is the number of speakers of indigenous languages in Mexico increasing? The many indigenous languages have resulted in some very distinctive place names.

At least one of the indigenous languages in Mexico is very unusual – Whistling your way from A to B: the whistled language of the Chinantec people in Oaxaca – and some have no words for “left” or “right”, while others are now spoken by only a very small number of people. The extreme example of this is Only two native speakers remain of Ayapaneco, an indigenous language in Tabasco.

Geo-Mexico has dozens of posts about specific indigenous groups in Mexico. The tag system and the site search engine will locate short articles related to the Huichol, Tarahumara, Aztecs, Maya and several other groups.

Dec 212015
 

The National Statistics Institute (INEGI) has released the results of its inter-census study carried out in March 2015 which involved visits to more than 7 million households across the country.

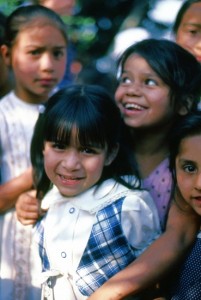
Children in Zitácuaro, Michoacán. Photo: Tony Burton. All rights reserved.

Children in Zitácuaro, Michoacán. Photo: Tony Burton. All rights reserved.

As of March 2015, Mexico’s total population was 119,530,753 (48.6% male, 51.4% female), up from 111,954,660 million in 2010, a growth rate averaging 1.4% a year. This is the first time for 45 years that the rate of growth has not fallen. Analysts had expected a 1.2% growth rate over the period, but attribute the 1.4% figure to a slightly higher fertility rate than anticipated, together with an unexpected fall in the number of young people emigrating from Mexico. [Note that the total population figure is slightly lower than the figure released in July from Mexico’s National Population Council (Conapo) of 121,783,280.]

Since 2010 the proportion of seniors (over age 65) has risen from 6.2% to 7.2% of the total, and the proportion of households headed by a female is up from 25% to 29%. The median age in Mexico is now 27 years. The youngest median age is in Chiapas (23), the oldest in the Federal District (33). Overall, Mexico’s dependency ratio is falling, continuing a period of “demographic dividend“.

INEGI found that the number of households in Mexico is rising 2.4% a year and now totals about 32 million, giving an average number of 3.7 occupants/household. 98.7% of homes have electricity, 74.1% have piped water inside the building, a further 20.4% outside the building but on the property; 75.6% connected to drainage.

Mexico’s most populated states remain the State of Mexico, the Federal District (Mexico City) and Veracruz, while the smallest states in terms of population are Baja California, Campeche and Colima. The most populated municipality is Iztapalapa (1.8 million), followed by Ecatepec (1.7 million) and Tijuana (1.6 million). The most rapidly growing municipality in the entire country is Pesquería, in Nuevo León, which has grown a startling 35.2% a year since 2010, mainly because of the new Kia vehicle factory opening there.

The item of inter-census news that attracted most press attention was INEGI’s so-called discovery that there were 1.4 million black Mexicans. This was hardly news to most demographers, but the inter-census survey was the first time INEGI had included a question aimed at identifying Afro-Mexicans, as a pilot question for the full 2020 census: “Based on your culture, history and traditions, do you consider yourself black, meaning Afro-Mexican or Afro-descendant?”

INEGI did indeed find that about 1.4 million citizens (1.2% of the population) self-identified as “Afro-Mexican” or “Afro-descendant”, with significantly more women opting for the category than men (755,000 women; 677,000 men).

It was no surprise to find that most Afro-Mexicans live in the states of Guerrero, Oaxaca and Veracruz. The survey showed that Mexico’s self-identified black population is not currently disadvantaged in terms of access to education and health services or work opportunities, putting it well ahead of Mexico’s indigenous population in that regard.

Afro-Mexican activists welcomed the inter-census question and results, but called for Mexico’s history books to reflect their contribution. Benigno Gallardo, an Afro-Mexican activist in Guerrero, pointed out that, “In school they teach our children about Europeans and indigenous natives, but the history books practically don’t recognize our history.”

Certainly more awareness of the long history of Afro-Mexicans is badly needed. For example, how many people realize that Blacks outnumbered Spaniards in Mexico until after 1810 or that Vasconcelas’ “Cosmic Race” (La “Raza Cósmica”) excluded Mexico’s African heritage?

Want to learn more? A good place to start is Bobby Vaughn’s website Afro-Mexico or his Black Mexico Home Page, Afro-Mexicans of the Costa Chica, on MexConnect, which provide links to several of his articles including Blacks in Mexico. A Brief Overview.

Related posts:

Nov 072015
 

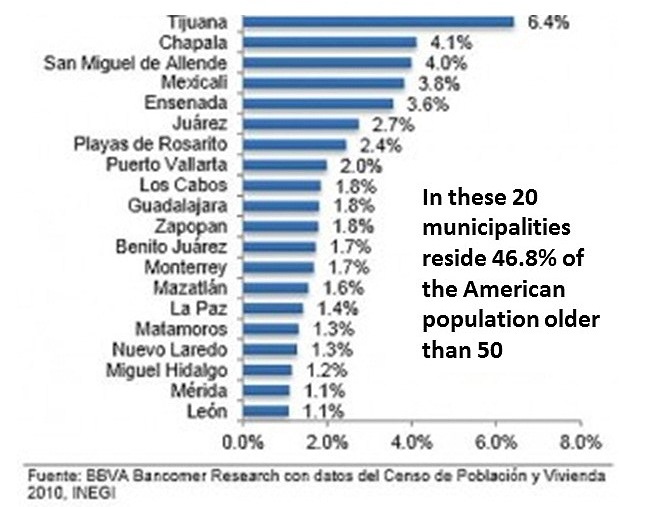
A BBVA-Bancomer report, based on Mexico’s 2010 census data includes an interesting graph showing where “Americans older than 50” live in Mexico. The data is based on place of birth, so some of the “Americans” in the data are of Mexican heritage – they were born in the USA, to parents who were born in Mexico, and have since relocated to Mexico.

americans-in-mexico-2010-graph

As the graph highlights, almost half of all Americans living in Mexico live in one of just 20 municipalities. Tijuana, just across the border from San Diego, leads the way, with 6.4% of all the Americans over age 50 living in Mexico, followed by Chapala and San Miguel de Allende, the only two non-border municipalities in the top seven locations for older Americans.

Perhaps no surprise, then, that both these areas have weekly English-language newspapers. The Chapala area is served by The Guadalajara Reporter which covers Guadalajara, Zapopan, Chapala and (to a lesser extent) Puerto Vallarta, potentially reaching 9.7% of all Americans over the age of 50 in Mexico. For its part, San Miguel de Allende has Atención San Miguel. Both locations are popular choices for retirement.

Kudos to “Madeline”, who points out in a comment (below), that there are several other English-language papers in Mexico. They include two in Puerto Vallarta: PV Mirror and the Vallarta Tribune. In Quintana Roo, Playa del Carmen has the Playa Times. In Baja California, there is the biweekly Baja Times and no doubt there are a few others, which we will add in due course! [Based in Mexico City, The News – thenews.mx – was the closest thing to a national daily in English, with distribution points in many parts of the country, but ceased publication in early 2016.]

Related posts:

Mexico has a 2015 population of 121 million people

 Updates to Geo-Mexico  Comments Off on Mexico has a 2015 population of 121 million people
Jul 162015
 

The latest population estimates released by the National Population Council (Conapo) to coincide with World Population Day show that Mexico has a population in mid-2015 of 121,783,280. Of this total, almost 43 million (35.4%) are adolescents, between 10 and 29 years of age.

A spokesperson for Conapo drew attention to the fact that Mexico still needs to do more to overcome gender inequality in fields such as education, salaries and working conditions.

Related posts:

Slight decrease in the number of “Los Ninis” in Mexico

 Mexico's geography in the Press, Updates to Geo-Mexico  Comments Off on Slight decrease in the number of “Los Ninis” in Mexico
Feb 092015
 

Los ninis are young people (aged 15-29) that “ni trabaja, ni estudia” (neither work nor study). They have become the focus of much press attention in the past few years, often accompanied by the phrase “Mexico’s lost generation”.

nini-logo

According to a recent OECD report, “Education at Glance 2015”, two out of every ten Mexicans in the 15-29 age group neither studied nor worked in 2013, the latest year for which there is data. The report found that 22.3% of Mexican in that age category were ninis, a slight decrease compared to 25.0% in 2011. After population increase is taken into account, Mexico has about 200,000 fewer ninis than in 2011.

Mexico’s percentage of ninis is above the average for all 34 OECD member countries, and is the fifth highest among OECD members, after Turkey (31.3%), Greece (28.5 %), Spain (26.8 %) and Italy (26.1 %). Very few of Mexico’s 7.3 million ninis (only 3.8%) are technically “unemployed”; most ninis have not actively sought work and are therefore considered “inactive”.

In Mexico, most ninis are female. For example, in the 20-24 age group, around 10% of males are ninis, compared to 40% of females.

The figure of 7.3 million will no doubt again be disputed by Mexico’s Secretariats of Education (SE) and of Labor and Social Welfare. In 2011, the Secretariats issued a joint rebuttal of the OECD figure, and claimed that 78% of those reported by OECD as ninis were young married women, with children, who dedicated themselves to home-making. The Secretariats emphasized that the figures revealed a gender inequality in access to educational and economic opportunities, linked to cultural patterns where many young women still saw marriage and motherhood as their preferred or only option.

Related posts:

Mexico’s 2014 population update: 118.4 million

 Updates to Geo-Mexico  Comments Off on Mexico’s 2014 population update: 118.4 million
Jul 112014
 

The National Statistics Institute (INEGI) has released population updates to coincide with today’s celebration of World Population Day (11 July). According to INEGI, Mexico currently has 118.4 million people, and is the 11th most populous country in the world.

The total world population is estimated at 7.2 billion, with slightly over half that number living in one of just 6 countries: China, India, USA, Indonesia, Brazil and Pakistan. The total fertility rate (globally) fell from 3.04 children/woman (1990-1995) to 2.53 children/woman (2005-2010). In 2010, the global life expectancy stood at 68.7 years.

Projections made by Mexico’s National Population Council (CONAPO) put Mexico’s 2013 fertility rate at just 2.2 children/woman, while life expectancy has risen (slightly) to 74.5 years. The reduction of fertility rate in Mexico is occurring in a society where the average level of schooling is increasing and where women report greater economic, social and political participation.

Between 1990 and 2011, maternal mortality in Mexico was reduced by 51.5%. Infant mortality over that period also fell, from 88 to 43 deaths/100,000 live births.

The percentage of the population that is aged 30 to 59 years increased between 1990 and 2011 from 25.5 to 35.7 %, while the percentage aged 60 and older rose from 6.2 to 9.5%. The proportion of Mexico’s population that is aged 60 and older is expected to continue rising and is predicted to reach 14.8% of the total population in 2030 and 21.5% in 2050.

INEGI also reported that the four leading causes of death among Mexicans are:

  • Diabetes mellitus (14.1% of all deaths)
  • Ischaemic heart disease (12.3%)
  • Liver diseases (5.5%)
  • Cerebrovascular diseases (5.3%)

Taken together, these four diseases, classified as chronic degenerative diseases, account for 37.2% of all deaths. Clearly while life expectancy in Mexico is increasing, it is accompanied by higher levels of obesity and physical inactivity. This will place a massive strain on health care budgets in the future.

Related posts:

Study finds indigenous Mexicans far more diverse than previously thought

 Other  Comments Off on Study finds indigenous Mexicans far more diverse than previously thought
Jun 262014
 

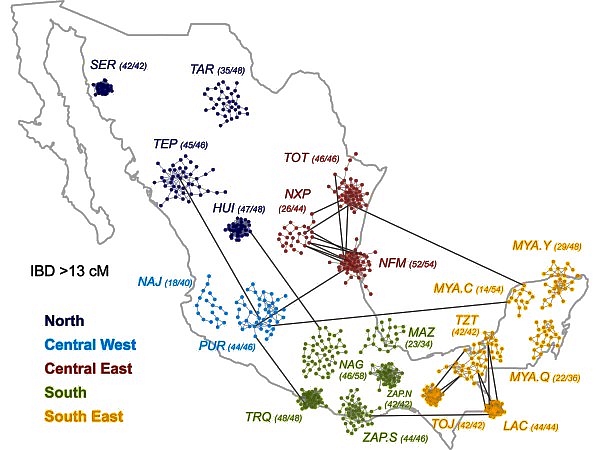
A recently released study [1] indicates that genetic diversity among indigenous Mexicans is far greater than previously thought. Ethnic Seri living in isolated parts of Sonora are as genetically different from isolated Lacandon living near the Guatemala border as Europeans are from Chinese. These differences must have existed for thousands of years before Europeans arrived in the New World. The differences are also reflected in mestizos living in geographically separated parts of Mexico.

Source: A. MORENO-ESTRADA ET AL., SCIENCE (2014)

Source: Moreno-Estrada et al. Science (2014)

The study in the June 13 issue of Science was conducted by researchers from the University of California, San Francisco and Stanford. They studied the genomic data from 511 native Mexicans from 20 of Mexico’s 65 indigenous groups scattered throughout Mexico (see map) from the Seri (SER) and Tarahumara (TAR) in the northwest, to the Purépecha (PUR) in the west, Trique (TRQ) and Zapotec (ZAP)in the south as well as three subgroups of Maya (MYA) on the Yucatán Peninsula [2]. They also analyzed similar data from 500 mestizos from ten Mexican states as well as some from Guadalajara and Los Angeles.

The findings have great implications for the study of diseases in these populations [3]. For example a lung capacity test can indicate a disease in one indigenous group while the same test results would be normal in a different indigenous group.

References:

[1] Moreno-Estrada et al. “The genetics of Mexico recapitulates Native American substructure and affects biomedical traits”, Science 13 June 2014; Vol 344 no.6189, p. 1301.

[2] Lizzie Wade. “People from Mexico show stunning amount of genetic diversity”, ScienceMag.org, June 12, 2014.

[3] Karen Weintaub,”Mexico’s Natives didn’t mix much, new study shows”, National Geographic, June 12, 2014.

Related posts:

Dec 052013
 

After studying 22 countries with sizable retirement communities, International Living (a consultancy group) rated Mexico as the fourth most attractive country for foreigners to retire to in 2013, after Ecuador, Panama and Malaysia. The study looked at eight factors: real estate, benefits for retired people, cost of living, integration, entertainment, health, infrastructure and climate.

According to the US Census Bureau, there are 41 million people of retirement age in the USA. More than half of them have annual incomes of between 70,000 and 150,000 dollars, and they are expected, on average, to live to the age of 83; 80% are home owners. This number will swell to 72.8 million by 2030, 40% of whom may have difficulties maintaining their previous lifestyles during retirement. Given its proximity, this makes Mexico an attractive destination for many baby-boomers seeking a comfortable retirement lifestyle.

But where in Mexico will these retirees choose to live?

According to this analysis by the consultancy Aregional, there are 36 specific areas in Mexico where the real estate market is targeting US baby boomers seeking a place to retire. About half of these locations (see map) are in central and western Mexico. Locations in these regions include Guanajuato and San Miguel de Allende (both in the state of Guanajuato), Colima, Comala and Manzanillo (Colima); Chapala, Ajijic and Puerto Vallarta (Jalisco); and Nuevo Vallarta and Punta Mita (Nayarit).

Locations of retiree real estate developments. Credit: Aregional

Locations of retiree real estate developments. Credit: Aregional

Locations in northern Mexico important for retiree real estate include Rosarito, Ensenada and Los Algodones (Baja California); Los Cabos, La Paz and Loreto (Baja California Sur); Puerto Peñasco (Sonora) and Mazatlán (Sinaloa). [Kudos to RickS for noticing that Puerto Peñasco is not located very accurately!]

Retiree real estate is also prominent in several places in the south and south-east of Mexico, including  Acapulco and Punta Ixtapa (Guerrero); Huatulco (Oaxaca); Playa del Carmen and Cancún  (Quintana Roo); Puerto Progreso (Yucatán), as well as the cities of Campeche and Veracruz.

It is not known how many US retirees have already chosen to live in Mexico. While it is relatively easy to quantify the number of retiree tourists (those staying more than one night, but less than six months), it is impossible to accurately quantify the number of non-working, non-Mexicans who have chosen to relocate full-time to Mexico. Technically, these “residential tourists” are not really tourists at all but longer-term migrants holding residency visas.

Residential tourists already form a very distinct group in several Mexican towns and cities, with lifestyle needs and spending patterns that are very different from those of regular tourists. Their additional economic impact is believed to exceed $500 million a year.

A case study of residential tourism, and its pros and cons, in Chapala-Ajijic on the northern shore of Lake Chapala is an integral part of chapter 19 of Geo-Mexico: the geography and dynamics of modern Mexico.

Posts related to retirees in Mexico:

“Los que llegaron”, Spanish language videos about Mexico’s immigrant groups

 Books and resources, Teaching ideas  Comments Off on “Los que llegaron”, Spanish language videos about Mexico’s immigrant groups
Oct 052013
 

Once TV México (“Eleven TV Mexico”) is an educational TV network owned by the National Polytechnic Institute (Instituto Politecnico Nacional) in Mexico City. Over the years, Once TV México programs have won numerous national and international awards.

Many of its programs are available as webcasts or on Youtube. Once TV México has made hundreds of programs that provide valuable resources for Spanish-language geography classes or for students of Spanish or anyone wanting to improve their Spanish-language skills. For example, their long-running program “Aquí nos tocó vivir” (“Here We Live”) has explored all manner of places throughout Mexico over the past 35 years, and has received UNESCO recognition for its excellence.

Of particular interest to us is “Los que llegaron” (“Those Who Arrived”), a series of programs looking at different immigrant groups in Mexico. Each 20-25 minute program focuses on a different group and explores the history of their migration to Mexico, their adaptation to Mexican life, their integration into society, the areas where they chose to settle, and the links between their home countries and Mexico.

Mexico has a long history of welcoming people from other countries, including political refugees. Each of these programs offers some fascinating insights into the challenges faced by migrants arriving in Mexico for the first time.

Sister city of Segusino, Italy

Sister city of Segusino, Italy

For instance, the program about Italian immigration to Mexico (above), explains why Mexico was seeking colonizers in the middle of the 19th century in order to populate and develop rural areas. One group of Italians settled in Veracruz (in present-day Gutiérrez Zamora); another group, 3,000 strong, and from the Veneto region in northern Italy, settled in Chipilo, near the city of Puebla. (For anyone not familiar with Chipilo, one of our favorite bloggers, Daniel Hernandez, has penned this short but memorable description of a typical Sunday morning there: Cruising in Chipilo, an Italian village in Mexico).

Italian immigration increased dramatically after the 1914-1918 war. Today, according to the program, there are approximately 13,000 Italian citizens residing in Mexico and an estimated 85,000 Mexicans of Italian descent. Note, though, that most sources quote a much higher figure for the latter category, perhaps as high as 450,000.

[Aside: In chapter 4 of “Mexican National Identity, Memory, Innuendo and Popular Culture”, William H. Beezley looks at the role of itinerant puppet theater in molding Mexico’s national identity. The largest and most famous single troupe of all was the Rosete Aranda troupe, formed by two Italian immigrants in 1850. The troupes went from strength to strength in the next half-century. By 1880, the Rosete Aranda company had 1,300 marionettes and by 1900 a staggering 5,104. Their annual tours around the country helped influence national opinions and attitudes.]

Program list for the “Los que llegaron” series:

  • Españoles (Spaniards)
  • Alemanes (Germans)
  • Húngaros (Hungarians)
  • Italianos (Italians)
  • Argentinos (Argentines)
  • Ingleses (English)
  • Japoneses (Japanese)
  • Estadounidenses (Americans)
  • Coreanos (Koreans)
  • Franceses (French)
  • Chinos (Chinese)
  • Libaneses (Lebanese)
  • Rusos y Ucranianos (Russians and Ukrainians)

Related posts:

Where do most Hispanics in the USA live?

 Other  Comments Off on Where do most Hispanics in the USA live?
Sep 232013
 

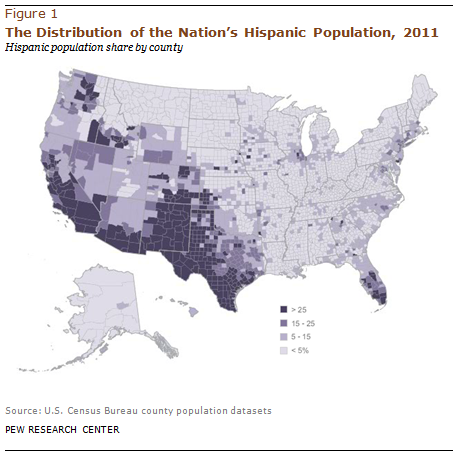
A recent study by Pew Research analyzes the geographical distribution of the over 53 million Hispanics who currently live in the USA. The “Hispanic” or “Latino” population is composed of many different segments. It includes families that have lived in the USA for numerous generations as well as recent immigrants from many countries. Mexicans are by far the largest Hispanic origin group. There are 34.7 million Mexicans in the USA accounting for 64% of all Hispanics. A future post will look at the geographic distribution of Mexicans in the USA. Several previous posts, including “Recent trends for Mexicans living in the USA”, have investigated the socio-economic characteristics of Mexicans living in the USA.

Though Hispanics are spreading throughout the country, they still tend to be concentrated in the west, particularly states that border Mexico [see map]. Almost half (46%) of Hispanics live in California (14.4 million) or Texas (9.8). Other states with relatively large Hispanic populations include Florida (3.5m), Illinois (2.1m) and Arizona (1.9m). Almost 47% of New Mexico’s population is Hispanic compared to 38% in both California and Texas.

Map of Hispanic population in USAFully 44% of Hispanics live in only 10 metropolitan areas. Almost half (46%) of the Greater Los Angeles population is Hispanic. The Los Angeles–Long Beach metro area has 5.8 million Hispanics and the neighboring Riverside–San Bernadino metro area has another 2.1 million, giving Greater Los Angeles 7.9 million Hispanics, 15% of the USA total. The New York–Northeastern New Jersey metropolitan area is next with 4.3 million Hispanics. Other metro areas with large Hispanic populations include Houston (2.1m), Chicago (2.0m), Dallas (1.8m), Miami (1.6m), San Francisco–San Jose (1.6), Phoenix (1.2m), San Antonio (1.1m) and San Diego (1.0m).

Over 80% of the Greater Los Angeles Hispanic population is Mexican. Mexicans also dominate the Hispanic populations in Houston (78%), Chicago (79%), Dallas (85%) as well as most other metro areas in the USA. In metro New York, Puerto Ricans are most numerous among Hispanics (28%) followed by Dominicans (21%) and Mexicans (12%). Puerto Ricans are also most numerous in Orlando (51%), Tampa–St Petersburg (34%), Philadelphia (56%), Boston (29%) and Hartford (69%). Cubans dominate the Hispanic population in Miami (55%), Fort Lauderdale (21%) and West Palm Beach (21%). In metro Washington DC, Salvadorians are most numerous among Hispanics (32%).

Roughly one third (36%) of all Hispanics in the USA are foreign-born; the rest were all born in the USA. Miami has the highest proportion of foreign-born Hispanics with 66%. No other metro area with over a million Hispanics has more than 43% foreign-born. On the other hand, only 17% of Hispanics in the San Antonio area are foreign-born with 83% born in the USA.

Source of data:

Related posts:

Mexico’s position among the most populous countries to 2100

 Updates to Geo-Mexico  Comments Off on Mexico’s position among the most populous countries to 2100
Aug 122013
 

How does Mexico compare with the world’s most populous countries? Available information suggests that in 1500, before the Spaniards arrived, the population of the area that is now Mexico was roughly 15 to 20 million (McCaa 1997). At that time Mexico may have been the third most populous country behind only China and India. However, by 1600 the population had crashed to about 1.6 million, one of the most dramatic population collapses in human history. Mexico did not regain its pre-Columbian population level until about 1900. But the population declined by about 6% during the Mexican Revolution, 1910-1920.

Children in Zitácuaro, Michoacán. Photo: Tony Burton. All rights reserved.

Photo: Tony Burton. All rights reserved.

A recently published UN study, World Population Prospects, The 2012 Revision, enables us to compare Mexico’s population with that of other countries for 1950, 2013, 2050 and 2100. Slow but steady growth brought Mexico’s population up to 28 million by 1950, ranking Mexico 16th just ahead of Spain and right behind the Ukraine. Very rapid growth peaking in the 1970s increased Mexico’s population to about 120 million by 2013. [The UN report quotes Mexico’s 2013 population as 122 million, whereas Mexico’s CONAPO (National Population Commission) estimates the current population is 118.4 million, the difference perhaps due to differing assumptions about international migration.]

This ranked Mexico 11th in the world just behind Japan, but ahead of the Philippines. [The 15 most populous countries in 2013 are China (1,386m), India (1,252m), USA (320m), Indonesia (250m), Brazil (200m), Pakistan (182m), Nigeria (174m), Russia (143m), Japan (127m), Mexico (122m), Philippines (98m), Ethiopia 94m), Vietnam (92m) and Germany (83m)]

By 2020, Mexico will pass Japan to become 10th, the highest it will ever rank except for during the pre-Columbian era.

The UN study forecasts that the Mexican population will grow to 156 million by 2050. This is considerably higher that the Mexico’s National Population Commission (CONAPO) forecast, which uses higher rates of out-migration. In 2050 Mexico will be back in 11th place, having jumped ahead of Russia, but having been passed by Ethiopia and the Philippines. According to the UN study by 2050 India will have passed China, and Nigeria will have replaced the USA as the 3rd most populous.

By 2100 Mexico’s population will be down to 140 million, putting it in 16th place behind Nigeria and five other very rapidly growing African countries: Tanzania, Congo, Uganda, Niger and Kenya. Interestingly, between 2050 and 2100 all of the 31 largest countries are expected to lose population except the USA, the Philippines, and 12 African countries. The world’s total population will have essentially leveled off by 2100 at about 10.9 billion with African countries continuing to grow while European and Asian countries experience population declines. Of course many unexpected demographic changes may occur between now and 2100.

According to the study, Mexico’s life expectancy at birth will be 90.0 years in 2100, above the USA’s level of 88.8 years, but behind Canada at 91.2 years. Mexico’s total fertility rate is forecast by the UN at 1.99 children per women in 2100 which is considerably higher than rates forecast by Mexico’s CONAPO and other demographers.

Reference:

Robert McCaa, Robert. 1997. “The Peopling of Mexico from Origins to Revolution”, preliminary draft for Richard Steckel & Michael Haines (eds.), The Population History of North America, Cambridge University Press, 1997.

Related posts:

Mexico’s population: now over 117 million and expected to peak at about 138 million

 Updates to Geo-Mexico  Comments Off on Mexico’s population: now over 117 million and expected to peak at about 138 million
Feb 282013
 

Mexico’s population in January 2013 was 117.4 million; 57.3 million males (48.8%) and 60.1million (51.2%) females according to a December 10, 2012 report by CONAPO (Consejo Nacional de Población) in Proyecciones de la población de México 2010-2050”. By January 2014 it will grow by over a million to 118.6 million. However demographic trends indicate that population growth in Mexico is declining significantly.

The birth rate is expected to fall from 19.7 births per 1,000 population in 2010 to 14.0 in 2050. As the Mexican population ages the death rate is projected to increase from 5.6 per 1,000 in 2010 to 9.2 in 2050. Consequently the annual rate of natural population growth is expected to decline from 1.41% in 2010 to 0.48% in 2050. Extrapolating the trends from the CONAPO projection suggests that death rates will surpass birth rates sometime in the by 2070s and natural population change will become negative. Of course, we must also take emigration into account.

According to the CONAPO report net emigration from Mexico was 321,000 in 2012, though some have noted that due to the Great Recession net emigration to the USA is near zero or less [Pew Research Center’s “Net Migration from Mexico Falls to Zero – and Perhaps Less”]. CONAPO expects net emigration to peak at about 689,000 by 2020 and then gradually decline to 590,000 by 2050. Given the current low levels of emigration to the USA and the rapid growth of the Mexican economy, some feel that these levels are rather high.

As a result of trends in birth rates, death rates and emigration, Mexico’s population growth rate is declining. Annual population growth is expected to fall below a million in 2017, below 500,000 in 2032 and below 100,000 by 2049. Extrapolating the rates in the CONAPO projection, Mexico’s population growth is expected to peak in 2053 at 137.6 million and then start to gradually decline. Of course, it is very difficult to accurately project emigration figures. If emigration is a third less than projected by CONAPO, then Mexico’s population could peak at 145 million.

Related posts:


The spatial distribution of Mexico’s GDP

 Other  Comments Off on The spatial distribution of Mexico’s GDP
Dec 062012
 

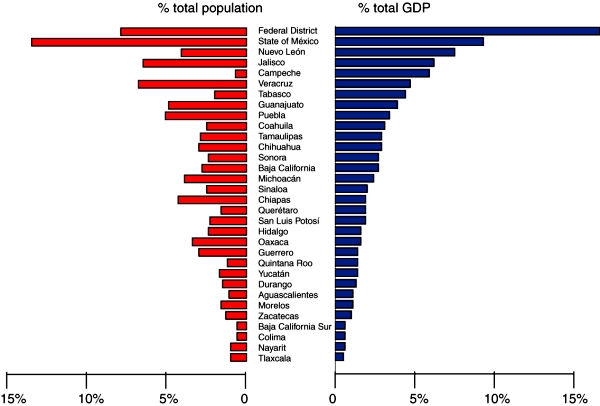
Mexico’s National Statistics Agency recently released a breakdown of GDP by state for 2011. The data allow for an analysis of the spatial distribution of Mexico’s GDP. The graph below shows each state’s contribution to GDP (blue bars) and their share of Mexico’s total population (red bars):

Population & GDP by state, 2011

Population & GDP by state, 2011. Data: INEGI. Credit: Tony Burton / Geo-Mexico; all rights reserved

In general, Mexico’s larger states (in terms of population) contribute more towards national GDP than its smaller states. Equally, even after population is taken into account, it is clear that some states contribute far more than others to Mexico’s GDP. The states of Campeche and  Tabasco both stand out as contributing far more than their fair share towards national GDP; this is on account of their oil and gas reserves. The Federal District, Nuevo León, Quintana Roo and Querétaro also outperform in terms of economic output. On the other hand, Michoacán, Chiapas, Oaxaca and Guerrero all stand out for contributing less to Mexico’s GDP than the size of their population would suggest.

The economic disparities revealed by the data are closely matched by other indicators of economic disparity such as differences in poverty rates and the distribution of the wealthiest households. For more about these topics, start with the related posts listed below.

Related posts:

Nov 152012
 

In a previous post, we quoted a press release from the Pew Hispanic Center suggesting that the net migration flow from Mexico to the USA had slowed down to a trickle, and possibly even gone into reverse (ie with more migrants moving from USA to Mexico than in the opposite direction):

We also looked at data related to the vexed question of which Mexicans, if any, may still want to move to the USA:

There are some slight signs now that the net migration flow northwards is on the increase again. According to this press article, the National Statistics Institute (INEGI) has reported that out-migration from Mexico started to rise again in the second quarter of this year.

During the second quarter, international immigration into Mexico was estimated (based on survey evidence) at 14.3 / 10,000 total population, and emigration from Mexico to another country at 41.9 / 10,000, meaning a net migration outflow from Mexico of 27.6 / 10,000.

It seems like the average age of migrants is also slowly rising. For instance, INEGI data suggest that 31% of emigrants were between 30 and 49 years of age during the period from 2006 to 2008, compared to 35% for the 2009-2011 period.

It is still far too early to say whether or not the flow of migrants from Mexico to the USA will become as strong, and involve as many people, as in the 1990s and 2000s, but watch this space.

Related posts:

Aug 302012
 

Veteran blogger Matt Osborne has unearthed a real gem! This 1977 BBC documentary was the tenth episode of The Age of Uncertainty, John Kenneth Galbraith’s history of economic thought. In this episode, Galbraith examines the economics of poverty and inequality.

The section of greatest interest to Geo-Mexico readers is his overview of the changing relationships between land and people in Mexico from precolonial times to the 1970s. [This ten minute segment starts at minute 4:33 of the video].

Galbraith does confuse his Teotihuacanos with his Aztecs, and clearly many things have changed since 1977, but this video is a great and straightforward introduction to the complex issues of land resources and population, suitable as the starting point for many discussions at high school or college level about land clearance, the financing of land improvement, the Green Revolution, population growth and social organization.

Related posts:

Interactive graph of changes in GDP/person and life expectancy in Mexico since 1800

 Books and resources, Teaching ideas  Comments Off on Interactive graph of changes in GDP/person and life expectancy in Mexico since 1800
Aug 252012
 

Gapminder is a wonderful resource for an overview of all manner of things geographic. The link below will take a few minutes to load, but should then show how Mexico’s GDP/person (on a purchasing power parity basis) and life expectancy have changed since 1800. The size of the yellow circle for each year is proportional to Mexico’s total population, with a scale that can be user-modified at the bottom right of the graph. Hover your mouse over a circle for the year to be identified.

The early figures for GDP/person are unlikely to be very reliable, but once we reach the 20th century, the figures are based on better assumptions and data. After falls in GDP/person and life expectancy in the early stages of the Mexican Revolution (which began in 1910), both variables increased steadily until about 1926. While life expectancy has continued to rise since then, with the occasional dip, GDP/person shows some obvious “blips” such as the early 1950s when it fell quite sharply.

It is interesting to play with the chart and look at how GDP/person and life expectancy have changed for other countries.

To do this:

  1. Select one or more countries by clicking on them [each country is identified when your mouse hovers over it]
  2. Use the slider at the bottom of the chart to select the time period of interest
  3. Sit back and prepare to get engrossed in the world of Gapminder!

Is Mexico experiencing a demographic dividend?

 Other  Comments Off on Is Mexico experiencing a demographic dividend?
Jul 232012
 

Mexico’s 2010 population of 112 million makes it the world’s 11th largest country in terms of population. The rate of population increase is now slowing down as fertility rates fall. The rate of increase, which was 2.63%/yr for the period 1970-1990, fell to 1.61%/yr for the period 1990-2010.

Even as the total population continues to grow over the next few decades, some very important changes are underway in Mexico’s population structure.

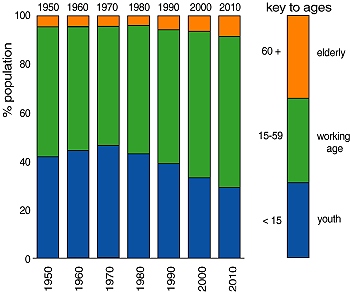
The graph divides Mexico’s population into three age categories: under 15 (youth), 15-59 (working age) and 60+ (elderly).

Mexico's population structure, 1970-2010

Mexico’s population structure, 1950-2010

The percentage of the total population of youthful age peaked in about 1970 at 46.2% and has since fallen to 29.3% in 2010. Over the same time period, the percentage of working age population has risen from 48.2% to 61.6%, while the percentage of elderly has gone from 5.6% to 9.1%.

Why is this important?

Perhaps the most obvious change is that government spending on schools and services for youth needs to shift towards spending on health care, pensions and services for the elderly. There are already some suburbs of the Mexico City Metropolitan Area that have experienced a dramatic shift in average age. Perhaps the most notable example is the Ciudad Satelite area, an area originally intended to be, and planned as, a genuine satellite settlement. A few decades later, the urban expansion of Mexico City had swallowed it up. An area which once had many young families now has very few children. The homeowners association of Ciudad Satelite estimates that 75% of the area’s 50,000 inhabitants is now elderly.

The major benefit of the changing population structure would appear to be that, in 2010, there are more wage-earners (and tax payers) for every person of non-working age (assumed for simplicity to be youth under 15, and the elderly aged 60+) than at any previous time. In other words, the total dependency rate is lower than ever before.

Economists argue that this “demographic dividend” should raise GDP, and could offer many significant advantages, such as enabling greater government expenditures on infrastructure or on social services. They point to several countries in East Asia as examples where economic growth spurts went hand-in-hand with a period of demographic dividend.

Despite the claims of economists, I’m not convinced that Mexico will prove to be an equally good example of the benefits of a demographic dividend. In Mexico’s case, the early phase of higher youthful population (and considerable economic growth) was accompanied by a high rate of emigration of working age Mexicans to the USA. Admittedly, emigration has now slowed, or stopped.

As Aaron Terrazas and his co-authors point out in Evolving Demographic and Human-Capital Trends in Mexico and Central America and Their Implications for Regional Migration [pdf file],

“But across Latin America, and in sharp contrast to East Asia, favorable demographic change has failed to translate into economic growth and prosperity. National income per capita has increased only modestly since the start of the demographic dividend, with Mexico outperforming its southern neighbors at comparable points in time. And emigration from the region has continued to grow despite the demographic transitions in Mexico and El Salvador, with the United States absorbing between one-fifth and one-quarter of the region’s annual population growth.”

Whether or not Mexico experiences a demographic dividend, it will not last for ever. In Mexico’s case, it looks set to last only about about 20 years. By 2050, according to current predictions, about 26.4% of the Mexico’s population will be youthful, and 27.7% elderly, while the percentage of working age will have fallen to 45.9%.

Related posts:


May 102012
 

Linked to Mother’s Day [10 May in Mexico], Save the Children just published their 13th annual report on the“State of the World’s Mothers”.

The report investigates childhood malnutrition and relates it to the well-being of mothers. The focus is on the first 1,000 days from the time of conception to the child’s second birthday. Proper nutrition and health care during these 1,000 days are critically important to brain development and the welfare of the child throughout its lifetime.

Mother and child in a Mexican market

Mother and child in a Mexican market. Photo: Tony Burton.

For decades, development experts have recognized that health, education and economic opportunity of mothers are crucially important to the quality of life of their children. Mothers’ level of education is often the most important factor.

The impacts last for numerous generations. Not only do the children of more educated mothers do better, but their grandchildren and great grandchildren also do better. On the other hand, malnourishment during the first 1,000 days is linked to low education and economic opportunity for the child. It can result in daughters getting pregnant earlier and having less healthy children. This vicious circle can continue for generations.

How does Mexico stack up with other major countries around the world? The results for Mexico are a bit mixed. From 1990 to 2010 Mexico recorded an impressive decrease in malnutrition of 3.1% per year. (The measure of malnutrition used in this comparison was children too short for their age, “stunting”). Mexico has cut malnutrition almost in half (47%) since 1990. This decrease ranks it 11th among the 165 countries analyzed. Much of this progress is associated with Mexico’s Oportunidades Program. The ten countries that did better than Mexico include China (6.3%), Brazil (5.5%), and Vietnam (4.3%). Fifteen countries suffered increases in malnutrition during the 20 year period, including Somalia (6.3%/year), Afghanistan (1.6%/year) and Yemen (1.0%/year).

On the other hand, the study points out that, given its level of Gross Domestic Product (GDP) per capita, Mexico’s level of malnutrition is higher than it should be. Other under-performers include the USA, Singapore, India, Indonesia, Guatemala, Peru, South Africa and Venezuela. These countries tend to have very inequitable distributions of income. Surprisingly, Brazil, with one of the worst levels of income inequality, was among the group of countries with lower malnutrition than expected given their GDP per capita. Other over-performers include Chile, Ukraine, China and Vietnam. Obviously, in all countries malnutrition is much worse among the poor.

The study divides the 165 countries into the three Tiers used by the United Nations. The Tiers are labeled I-“more developed”, II – “less developed” and III – “least developed”. Tier I is limited to Japan and European countries. Mexico is one of 80 countries in Tier II (“less developed” countries).

The UN has a “Women’s Health Index” for Tier II, comprised of lifetime risk of maternal death, percent of women using modern contraception, percent of births attended skilled attendant, and female life expectancy at birth. Within this group, Mexico ranks 19th in “Mother’s (Health) Index” compared to Cuba (ranked 1st), Argentina (4th), Brazil (12th), China (14th), South Africa (33rd), Turkey (47th), Iran (50th), Philippines (52nd), Indonesia (59th), Saudi Arabia (63rd), Egypt (65th), Guatemala (68th), India (76th), Pakistan 78th) and Nigeria (80th).

The differences between ranks appear to overstate the real differences. For example, the scores on the individual variables for Mexico (19th) and Argentina (4th) are relatively close. The chance of maternal birth-related death is one in 500 for Mexico versus 600 in Argentina. In Mexico 95% of births are attended by a trained worker compared to 98% in Argentina. Two thirds (67%) of Mexican women use modern contraception methods compared to 64% in Argentina. Life expectancy for women is 80 years in both countries.

The UN “Children’s Health Index” for Tier II is comprised of under age five mortality rate, percent of children under 5 moderately or severely underweight for age, gross primary enrollment ratio, gross secondary enrollment ratio and percent of population with access to safe drinking water.

Mexico ranks 18th among Tier II countries in terms of “Children’s (Health) Index” compared to Cyprus (1st), South Korea (2nd), Brazil (7th), Argentina (8th), Turkey (10th), Egypt (21st), Iran (26th), China (34th), South Africa (56th), Guatemala (63rd), Philippines (64th), Indonesia (70th), Pakistan (76th), India (77th) and Nigeria (82th). Here again, the differences between ranks appear to overstate the real differences.

While Mexico has made impressive progress concerning mother’s and baby’s health, it still lags behind Argentina and Brazil not to mention virtually all European countries. The biggest concern is rural areas of Mexico, especially southern Mexico, which seriously trail urban Mexico in terms women’s and child’s health. For example, infant mortality rates are highest in Chiapas, Oaxaca and Guerrero, followed by Veracruz, Hidalgo and Puebla. On the bright side, rural areas are making great progress thanks to programs like Oportunidades.

Happy Mother’s Day!


Net migration flow from Mexico to the USA falls close to zero or has possibly reversed

 Books and resources, Updates to Geo-Mexico  Comments Off on Net migration flow from Mexico to the USA falls close to zero or has possibly reversed
Apr 262012
 

The following are extracts from the text of a press release from the Pew Hispanic Center entitled “Net Migration from Mexico Falls to Zero—and Perhaps Less“, by Jeffrey Passel, D’Vera Cohn and Ana Gonzalez-Barrera:

The largest wave of immigration in history from a single country to the United States has come to a standstill. After four decades that brought 12 million current immigrants—more than half of whom came illegally—the net migration flow from Mexico to the United States has stopped—and may have reversed, according to a new analysis by the Pew Hispanic Center of multiple government data sets from both countries. The report is based on the Center’s analysis of data from five different Mexican government sources and four U.S. government sources. [see original article for sources]

The standstill appears to be the result of many factors, including the weakened U.S. job and housing construction markets, heightened border enforcement, a rise in deportations, the growing dangers associated with illegal border crossings, the long-term decline in Mexico’s birth rates and changing economic conditions in Mexico.

Among the report’s key findings:

  • In the five-year period from 2005 to 2010, about 1.4 million Mexicans immigrated to the United States and about 1.4 million Mexican immigrants and their U.S.-born children moved from the United States to Mexico.
  • In the five-year period a decade earlier (1995 to 2000), about 3 million Mexicans had immigrated to the U.S. and fewer than 700,000 Mexicans and their U.S. born-children had moved from the U.S. to Mexico.
  • This sharp downward trend in net migration has led to the first significant decrease in at least two decades in the number of unauthorized Mexican immigrants living in the U.S.—to 6.1 million in 2011, down from a peak of nearly 7 million in 2007.
  • Mexicans now comprise about 58% of the unauthorized immigrants living in the United States. They also account for 30% of all U.S. immigrants.
  • Apprehensions of Mexicans trying to cross the border illegally have plummeted by more than 70% in recent years, from more than 1 million in 2005 to 286,000 in 2011—a likely indication that fewer unauthorized immigrants are trying to cross.
  • As apprehensions at the border have declined, deportations of unauthorized Mexican immigrants—some of them picked up at work or after being arrested for other criminal violations—have risen to record levels. In 2010, nearly 400,000 unauthorized immigrants—73% of them Mexicans—were deported by U.S. authorities.
  • Looking back over the entire span of U.S. history, no country has ever sent as many immigrants to this country as Mexico has in the past four decades. However, when measured not in absolute numbers but as a share of the immigrant population at the time, immigration waves from Germany and Ireland in the late 19th century equaled or exceeded the modern wave from Mexico.

– – – end of quotations from press release – – –

Related posts:

Jan 092012
 

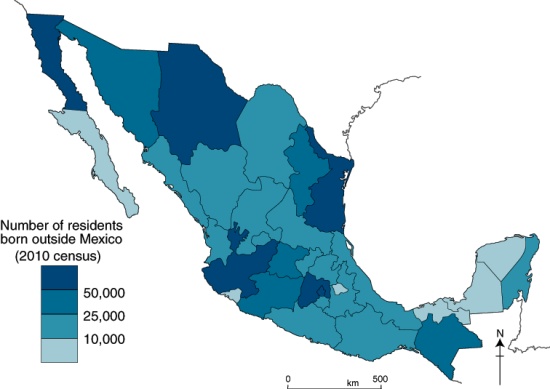
Mexico’s 2010 census found that 961,121 individuals living in Mexico had been born outside the country. In 2000 there were only about half as many (492,617). The 2010 figure is less than 1% of Mexico’s total population of 112 million. (Compare Canada where 21% are foreign-born and USA where 13% are foreign born). Of the total number of foreign-born residents in Mexico, 76.6% were born in the USA. Sadly, INEGI has not released any information relating to the country of birth of current residents who were born in countries other than the USA.

The map below shows the total number of foreign-born residents for each state.

Map of foreign-born residents of Mexico in 2010

Foreign-born residents of Mexico in 2010. Credit: Tony Burton/Geo-Mexico.

As can be seen on the map, the states with most foreigners are Baja California (about 123,000), Jalisco (84,000), Chihuahua (80,000), the Federal District (72,000) and Tamaulipas. The two states with fewest are Tlaxcala and Tabasco. (These are absolute numbers, and are heavily influenced by the relative size of each state).

Which states experienced the largest increases in foreigners between 2000 and 2010? The number of foreigners grew fastest in those states with relatively few foreigners in 2000, namely Hidalgo (up 402% over the decade), Tlaxcala (333%), Tabasco (281%), and Veracruz and Oaxaca (both with 272%).

Related posts:

Are homicide rates in Mexico increasing? Perhaps, but…

 Other  Comments Off on Are homicide rates in Mexico increasing? Perhaps, but…
Aug 252011
 

This question is far more complicated to answer than might initially appear. To start with there are two primary sources of homicide data in Mexico which provide very different results and vary significantly from state to state and year to year.  The National System of Public Security (SNSP) compiles homicide statistics from police reports and investigations.  The National Institute of Statistics and Geography (INEGI) obtains homicide data from death certificates reported through the Ministry of Health. For 2010, SNSP reported 35,053 homicides in Mexico, while INEGI – Reporta el INEGI más de 24 mil muertes en 2010 – reported 24,374 homicides.

For a very interesting comparison (in Spanish) of trends over time for these two data sources, including a detailed look at the trends in some individual states, see:

For two earlier posts using SNSP data, see:

What factors may explain why the data is so different?

The terminology associated with homicides is very complex. This is equally true in English and Spanish. Even the basic subcategories do not necessarily match closely from the legal system in one country to that in another. Legal definitions and classifications depend in part on subjective decisions by officials concerning such things as the perpetrator’s motive, intent and state of mind.

In general terms, homicide (homicidio) means the deliberate killing of one person by another. A homicide may be either an:

  • intentional homicide or murder (homicidio doloso) or an
  • involuntary homicide, negligent homicide or case of manslaughter (homicidio culposo)

In some jurisdictions, intentional homicides are further divided into such categories as “first degree murder” and “second degree murder”.

The data associated with homicides are at least as complicated as the legal definitions. Statistics originating from police records will never exactly match those coming from death certificates or public records. For instance, some individuals may have been recorded originally as dying from accidents, natural causes or suicide on their death certificates, but then shown later to have been intentionally killed (murdered) and therefore counted in police records as murder victims. There are numerous possible scenarios in which the police data will differ from the data recorded on death certificates.

Differences in terminology, definitions and application may explain some of the differences in the two data sets, but is very unlikely to explain 100% of such significant differences, so care is needed before drawing any conclusions about Mexico’s homicide rate.

What do the figures for homicides suggest?

In 2000, INEGI, Mexico’s National Statistics Agency, recorded 10,743 homicides in Mexico. This number dropped gradually to 8,897 in 2007 before jumping up to 14,006 in 2008, 19,803 in 2009 and leaping  23% in 2010 to 24,374. Current information suggests the number of homicides will be at least as high in 2011.

The SNSP data have become significantly higher than INEGI data in recent years. They also show an increase in the number of homicides in 2010 (compared to 2009), but of only 11%.  Both data sets indicate a rapid increase. This is especially troublesome given that murder rates had declined rather steadily up until the “drugs war” started in earnest in 2007.

If we average the INEGI and SNSP numbers, it suggests that the overall 2010 homicide rate was about 27 per 100,000 population.

How does Mexico’s murder (intentional homicide) rate compare to that in other countries?

Wikipedia’s list of intentional homicide (murder) rates claims that Mexico’s murder rate in 2010 was 15 per 100,000. SNSP data for Mexico show 2010 figures of 18 per 100,000. Either of these figures is very high compared to Canada (1.6 per 100,000), Peru (3.2) or the USA (5). On the other hand, Mexico’s homicide rate is rather low compared to Honduras (78), El Salvador (65), Venezuela (48), South Africa (34) and Brazil (25). In 2007, Mexico’s murder rate was about 8.4 per 100,000, very close to the world average.

How many of Mexico’s murders are drug-war related?

Data released last January by the Mexican government indicated that drug-war deaths increased in 2010 by 5,659 from 9,614 to 15,273. These data suggest that 63% of Mexico’s intentional homicides in 2010 were related to drug violence compared to only 49% in 2009, 28% 2007 and roughly 10% in 2006. In fact, non-drug-war-related intentional homicides in Mexico appear to have declined 11% from 10,189 in 2009 to 9,101 in 2010, less than the total number of homicides in any year from 2000 through 2006.

This brings us back to our original question, “Are homicide rates in Mexico increasing?” Yes, they are increasing, but only as a result of the much publicized “war on drugs”. It is likely that if there was no drugs war, then Mexico’s homicide rate would be continuing to decline, consistent with its long-term trend.

Related posts, relying on data issued by the Office of the President of Mexico:

The Transnational Metropolitan Areas of Mexico-USA

 Other  Comments Off on The Transnational Metropolitan Areas of Mexico-USA
Aug 092011
 

Mexico shares a 3,169 km (1,969 miles) border with the USA. This is one of the most heavily guarded and frequently patrolled  land borders in the world, and a rare example of a land border that separates two countries with very different levels of economic development. These differences in development have, of course, prompted many Mexicans to migrate to the USA, either as seasonal or permanent migrants, and whether “legal” or undocumented.

Some regional geographers have even proposed that a regional division of North America should include a distinctive “border region”,  an international region straddling the boundary and including all border crossings and many notable cities. This region experienced rapid economic growth following the signing of NAFTA, when many companies moved to northern Mexico, setting up maquiladora manufacturing plants. The border area has long been a major focus of drugs-smuggling, with border transport of illegal narcotics getting ever more inventive. In recent years, sadly, this same area has become the scene of some of the worst drugs-related violence in the world.

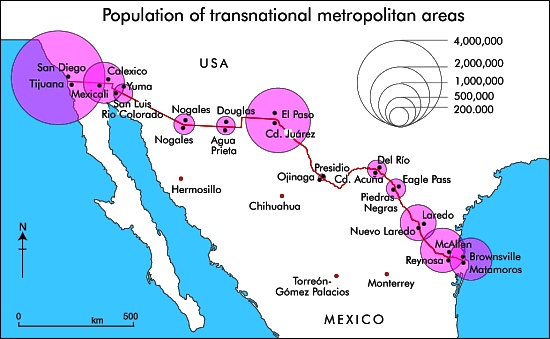
Population of Mexico-USA Transnational Metropolitan Areas.

Population of Mexico-USA Transnational Metropolitan Areas. Credit: Tony Burton; all rights reserved

The map shows the 2010 population of the major transnational metropolitan areas of Mexico-USA. The diameter of each circle represents the combined population of the twin cities that have grown up either side of the border. The pattern closely reflects the volumes of overland transport links (road and rail) between the two countries, as well as of commuters who live one side of the border, but work on the other side and cross daily.

The easternmost part of the boundary between Mexico and the USA follows the Río Bravo (Grande). Inevitably, there have been disputes when the river changed its course. Part of the western boundary follows the course of the Colorado River, from which so much water is taken that it now rarely flows into its delta region in Baja California. All the varied boundary and water-rights treaties and agreements between Mexico and the USA are decided via the International Boundary and Water Commission.

Related posts:

Aug 062011
 

The 2010 censuses in the USA and Mexico have led to numerous reports on either side of the border. This post looks mainly at recent reports from the Pew Hispanic Center, a project of Pew Research Center, which describes itself as”a nonpartisan ‘fact tank’ that provides information on the issues, attitudes and trends shaping America and the world.”

The total US population in 2010 was 308.7 million. The Pew report entitled U.S. Hispanic Country of Origin Counts for Nation, Top 30 Metropolitan Areas says the the USA had 50.5 million Hispanics in 2010, including 31.8 million of Mexican origin (63% of all Hispanics). [The categories are based on self-described family ancestry or place of birth in response to questions in the 2010 Census and the 2009 American Community Survey.] The population of Mexican-origin grew by 54% (11.2 million) between 2000 and 2010. Mexicans are the dominant Hispanic group in many major metropolitan areas, from Los Angeles to Chicago, and San Antonio to Atlanta, with some exceptions in the East, including Miami (Cubans) and New York (Puerto Ricans).

The report is accompanied by detailed statistical profiles, including Statistical Profile: Hispanics of Mexican Origin in the United States, 2009 that provides a concise summary of all the key data about the Mexican diaspora in the USA.

The Pew Hispanic Center has also updated its interactive maps and database on the USA’s Latino population. Data can be viewed by county for 1980, 1990, 2000 and 2009 and reveal the shifting patterns of residence of the Hispanic population since 1980.

Another Pew report, The Mexican-American Boom: Births Overtake Immigration shows that, since 2000, births have overtaken immigration as the main driver for the dynamic growth of the Mexican population in the USA. This is because:

  • Mexican-Americans are younger (on average) and have higher fertility than other US groups, and
  • The numbers of Mexicans migrating to the USA has fallen. Mexico’s 2010 census revealed that emigration from Mexico to the USA has dropped significantly in recent years, from an average of 480,000/year in 2000—2005 to around 145,000/year for 2005—2010.

Hispanics in the USA lag behind the rest of the population in terms of education. For example, only 9% of Mexicans in the USA aged 25 and over have at least a  Bachelor’s degree, compared with 13% of all Hispanics in the USA and over 20% for the US population as a whole. This is reflected in median earnings, where the average personal earnings for Mexicans in the USA aged 16 and over was $20,000 in 2009, compared to $28.900 for the US population as a whole.

A Presidential Advisory Commission has been formed to look at ways to improve the academic achievement of Hispanics, the largest and fastest-growing minority in the public education system.

The growing number of Hispanics in the USA has meant that Hispanics are now looking to have a greater say in politics. This has led to the formation of the Tequila Party, a nonpartisan movement launched on 5 May (Cinco de Mayo) 2011. Their first political rally, a call to “get out and vote”, accompanied by mariachis, was held in Tucson, Arizona.

How will reduced out-migration impact Mexico’s total population?

 Updates to Geo-Mexico  Comments Off on How will reduced out-migration impact Mexico’s total population?
Jul 192011
 

As described in an earlier post –Is massive Mexican migration to the USA a thing of the past?– we examined a 6 July 2011 New York Times article which indicated that Mexican migration to the USA had slowed to barely a trickle. If this is correct, Mexico’s population will be considerably higher in future years. This post estimates what this impact will be.

In another post –Projecting Mexico’s population: when, if ever, will it stop growing? – we incorporated the results of Mexico’s 2010 census and 2008 migration estimates into the most recent official population projection available from the Mexican Government’s CONAPO (Spanish acronym for National Population Commission). This analysis indicated that Mexico’s population would peak at 140.5 million in 2043, rather than the 130.3 million indicated in the older CONAPO projection.

If net migration becomes zero in the future, as suggested in the New York Times article, Mexico’s population will peak at 149.3 million in 2051. If net migration in future years is between the 2008 estimate of 203,000/year and zero, say 100,000/year, then the Mexican population will peak at 144.9 million in 2049. Clearly, the variation in these projections of almost nine million (149.3 verses 140.5) is quite significant. Given these different projections, our current thinking is that Mexico’s population will probably peak at around 145 million about mid-century.

Though population projections based on birth and deaths rates tend to be fairly accurate, net migration projections are far more precarious. Actual net migration between the two countries will depend on a wide range of future socio-economic variables for both countries. The most obvious of these variables will be fertility rates, growth of the working age population, education opportunities, economic growth, trade regulations and trends, job availability, unemployment rates, and personal preferences of both workers and retired people. There undoubtedly will be surprises such as technology changes or climate change. Some of these may have very profound impacts on migration, and therefore on total population levels.

Migration between Mexico and the USA is the focus of chapters 26 and 27 of Geo-Mexico: the geography and dynamics of modern Mexico. Explore the book using Amazon.com’s Look Inside feature; buy your copy today!

Jul 112011
 

Many Chicano activists refer to Mexicans as “La Raza”, literally “the race”. “Dia de la Raza” is celebrated on Columbus Day (October 12) as the day the Mexican indigenous population started their resistance against the European invasion.

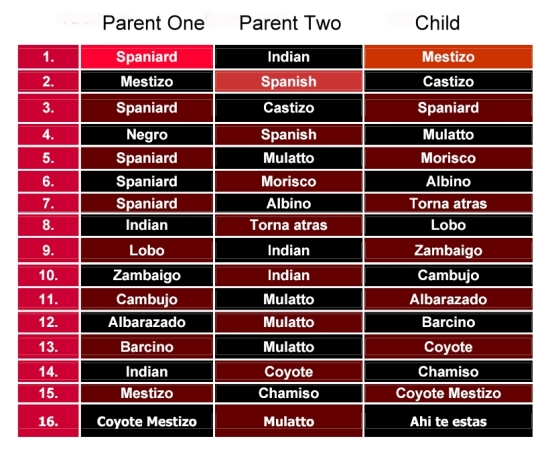
Racial classification in colonial times

Racial classification in colonial times (Click to enlarge)

The term “La Raza” derives from a 1948 book “La Raza Cósmica.” The author Jose Vasconcelos’ thesis is that Mexicans (who he defines as a combination of indigenous and European bloodlines) are a new superior race. In developing his thesis, Vasconcelos draws upon many concepts including Marxism; he felt Europeans were too materialistic and capitalistic. He suggested that Mexicans have evolved (à la Darwin) into a new race that would be a world leader in the years ahead. The Government of Mexico tacitly agreed with this approach which engendered national pride. It was also consistent with the government’s post Mexican Revolution view that all ethnic groups should be combined into a common Mexican national identity.

According to the 2010 census, about 15% consider themselves indigenous, though about 58% of these do not speak any indigenous language. Assuming the “white” and “other” categories are still about 10% and 2% respectively, this suggests that today about 73% are mestizos. Almost all people in Mexico refer to themselves simply as “Mexicans”, not as indigenous Mexicans or mestizos or whites.

Vasconcelos’ “Raza Cósmica” and most Mexicans overlook the historical fact that Mexicans have an important African heritage. Between 100,000 to 200,000 African slaves were brought into Mexico during the 16th through 18th centuries, nearly a quarter the number brought to the USA. In 1646 there were 35,000 African slaves in Mexico, more than 2.5 times the white population [see Blacks outnumbered Spaniards in Mexico until after 1810]. These slaves represented about 12% of the total population, roughly equal to the percentage of slaves in the USA before 1860.

Mexico’s second president, Vicente Guerrero, whose mother was partially Black, abolished slavery in 1829. Thousands of Blacks moved into Mexico from the USA before it abolished slavery in 1865. However, today there are very very few black faces in Mexico. One can spend weeks in Mexico’s major cities without seeing a Black Mexican. If one pays close attention, they can identify people of African heritage in a few selected communities in Veracruz and along the Costa Chica in Guerrero and Oaxaca [Bobby Vaughn’s homepage: Afro-Mexicans of Costa Chica ].

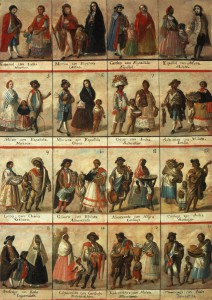
What happened to all the Blacks in Mexico?  [Blacks in Mexico] In a word they assimilated by having offspring with other racial groups. In colonial times, the Catholic Church went to great lengths to categorize intermixed races for marital and baptism purposes:

The terminology for racial mixes

Complex terminology for racial mixes

Before too long, nobody could keep all the combinations straight! Eventually, everyone of mixed race was considered a mestizo. The African portion was purposely or accidentally dropped.

Modern research, based on DNA, indicates that Mexican mestizos are genetically about one-eighth African [mtDNA Affinities of the Peoples of North-Central Mexico]. While Brazil is often identified as the world’s foremost melting pot, the evidence suggests that in Mexico the races have melted more than in any other country.

While there are very few black faces in Mexico, there is a great deal of African heritage represented in art, music, dance, food, and even in fishing and agricultural practices. Did you know that the popular Mexican song “La Bamba” recorded by Richie Valens, Los Lobos and others can be traced back to the Bamba district of Angola? As part of the 500th anniversary of Columbus’ famous voyage, the Government of Mexico finally acknowledged officially that Africa was Mexico’s “Third Root”.

Mexico’s role in the birth control revolution

 Other  Comments Off on Mexico’s role in the birth control revolution
Jun 212011
 

The oral contraceptive pill, often referred to simply as “the Pill” will be officially sixty years old on October 15, 2011. In the words of The Economist: it “was arguably the first lifestyle drug to control a normal bodily function—fertility—rather than a dread disorder. It transformed the lives of millions and helped reshape the role of medicine in reproduction.” Its social impact was massive, helping to foment the sexual and feminist revolutions.

From a geographic perspective, the Pill coincided with ever-increasing concern about the rate of world population growth, and its impact on resources –  the start of an era which led to such seminal works as The Population Bomb and The Limits of Growth.

Initially, the development of the Pill was met by medical, religious and social furor, much of which has since subsided. Even though its popularity has declined since the 1960s, because of concerns about possible side effects, it is estimated that it is still used, in one form or another, by more than 80 million women worldwide.

Curiously, the synthetic female sex hormone called norethindrone was first synthesized from, believe it or not… Mexican-grown yams!

Equally interestingly, the Pill was not developed in a huge laboratory belonging to a major pharmaceutical company but in a relatively humble laboratory in Mexico City, belonging to a small company called Syntex. Syntex specialized in making steroids from Mexican yams, using methods of synthesis invented by a maverick biochemist, Russell Marker. Marker had published various studies on diosgenin, a saponin isolated from a Mexican yam species of the genus Dioscorea, and had discovered how to synthesize the human hormone testosterone and progesterone from diosgenin. After having his proposals for the large-scale production of human steroids from diosgenin turned down by U.S. pharmaceutical companies, Marker moved to Mexico and began his own, home-based, small scale production. This was so successful that a new company, Syntex, was soon born, specifically to make steroids from Mexican yams. Syntex quickly became the world’s largest producer of progesterone, as well as making testosterone and the female hormone esterone.

Enter Carl Djerassi. Djerassi was an Austrian-born chemist who had completed his PhD at the University of Wisconsin (1945) by researching the synthesis and transformation of steroids, including sex hormones. After working four years as a research chemist with CIBA Pharmaceutical Co. in Summit, New Jersey, he decided on a strategic move, in 1949, to join Syntex, in Mexico City, as associate director of chemical research.

At Syntex, Djerassi set out to see if diosgenin could be made to yield other steroids, which do not actually exist in nature, but which retain the biological activities of progesterone and are also orally active. The original aim of his team was to develop a drug for infertility and menstrual disorders that could be swallowed, as opposed to injected. Only two years later, on October 15, 1951, the group led by the then 28-year-old Djerassi, had synthesized norethindrone, a “super-potent orally active progestational agent”, which turned out to be the key ingredient in The Pill. (Chemically, norethindrone is 17a-ethinyl-19-nortestosterone; its generic name in Europe is norethisterone).

Later, the drug’s ability to suppress ovulation was demonstrated by Gregory Pingus at the Worcester Foundation in Massachusetts and clinical trials began. The rest, as they say, is history!

Djerassi is Emeritus Professor of Chemistry at Stanford University with an extremely distinguished scientific record, holding no fewer than 19 honorary doctorates in addition to numerous other honors. He is also one of only a handful of American scientists to have been awarded both the National Medal of Science (1973, for the first synthesis of a steroid contraceptive, The Pill) and the National Medal of Technology (1991, for promoting new approaches to insect control).

In medicinal chemistry he will be forever associated with the initial developments in the fields of oral contraceptives (Norethindrone), antihistamines (Pyribenzamine) and topical corticosteroids (Synalar).

They say that the well-rounded man combines scientific inquiry with artistic appreciation, and Djerassi is certainly no exception, having turned, in later life, to science fiction writing, examining the human side of scientists and the personal conflicts they face in their quest for knowledge, personal recognition, and financial rewards. One of his plays, “An Immaculate Misconception,” premiered in 1998 at the Edinburgh Fringe Festival and has since been performed in London, San Francisco, Sweden, Vienna and Cologne. It was also broadcast on BBC World Service Radio in May 2000.

Sources:

The idea for this post originated from a review in The Economist (October 13, 2001) of two books: Sexual Chemistry: A History of the Contraceptive Pill (Lara Marks, Yale) and This Man’s Pill. Reflections on the 50th Birthday of the Pill. (Carl Djerassi, Oxford University Press).

Several chapters of Geo-Mexico: the geography and dynamics of modern Mexico discuss Mexico’s population dynamics and trends, and their implications for future development. An earlier post here links to a pdf file showing Mexico’s population pyramid in 1990, and the predicted pyramid for 2050.

Key geographic indicators from Mexico’s 2010 Census

 Updates to Geo-Mexico  Comments Off on Key geographic indicators from Mexico’s 2010 Census
Jun 202011
 

This post summarizes some important characteristics of Mexico’s population and households, as revealed by the definitive results of the 2010 population census.

Literacy

5.3 million Mexicans over the age of 15 are unable to read and write a simple message (i.e. they are functionally illiterate). The highest rates of illiteracy are in Chiapas (17.0%), Guerrero (16.7%) and Oaxaca (16.3%), with the lowest rates in Mexico City (2.1%), Nuevo León (2.2%) and Baja California and Coahuila (both 2.6%).

Average Age

The average age of Mexico’s population has risen from 22 years in 2000 to 26 years in 2010. In 2010, 29% of the population was under the age of 15 (compared to 34% in 2000) and 6.3% was in the 65+ age group (compared to 5.0% in 2000).

Dependency ratios

The dependency ratio of a population is worked out by comparing the number of people of working age (normally taken to be 15-64 years old) with the number of young people (under age 15) and elderly (65+ years old). The dependency ratio has shifted from 64 dependents in every 100 people (64/100) in 2000 to 55/100 in 2010. More significantly, of the 64 dependents in 2000, 56 were children and 8 were elderly, whereas of the 55 in 2010, 45 were children and 10 were elderly. This is a clear shift towards an “elderly-dependent” population.

Fertility and education

The 2010 census shows that women of child-bearing age (15-49) have had an average of 1.7 children each, compared to 2.0 children in 2000. The averages mask enormous differences in rates. For example, women with a senior high school (preparatoria) education have 1.1 children on average, compared with 2.5 children for women who only completed secondary school, 3.3 children for those who completed primary education, and 3.5 children for those without any formal education.

Household possessions

Almost all (93%) of Mexico’s 35.6 million households have at least one TV, 82.1% have refrigerators, 65% cell phones, 45% have a vehicle, 43% a fixed telephone line, 29% a computer, and 21% have Internet access.

How did Mexico get to be the world’s 11th most populous country?

 Other  Comments Off on How did Mexico get to be the world’s 11th most populous country?
Jun 112011
 

Mexico is currently the world’s 11th most populous country. While it has not always held this position, Mexico has been among the world’s population leaders for the last two thousand years. Worldmapper.org provides data on the estimated population occupying the areas of current countries for various years starting in the year one, when India (62 million) and China (60 million) had more than half of world’s total population of 231 million. No other country had more than eight million. Mexico ranked 17th with an estimated two million inhabitants. According to available data eight countries have always been more populous than Mexico: China, India, Bangladesh, Russia, Pakistan, Japan and Indonesia.

The next data point is the year 1500, when Mexico ranked 13th with an estimated population of seven million. This estimate seems reasonable, though some feel that Mexico’s population might have been as large as 15 million which would have made Mexico the third most populous country on the planet behind only China and India. Between year 1 and 1500, Mexico surpassed Turkey, Spain, Egypt, Iran, and the Ukraine; but was passed by Germany.

Mexico’s total population plunged after the Spanish arrived bringing small pox, other diseases and major social disruption. By 1600, Mexico’s population was down to 2.5 million, but it was still the most populous country in the New World, according to data provided by gapminder.org. It ranked 22nd tied with Austria and behind such countries as Czechoslovakia, Poland, Sudan, and Yugoslavia.

In 1700 Mexico’s population was 4.5 million, ranking it 18th. By 1820 the USA had moved past Mexico’s population of 6.6 million to become the most populous country in the New World. Mexico maintained its 19th ranking until 1870 when Brazil surpassed Mexico’s population of 9.2 million to become the most populous country in Latin America. It is interesting that there were relatively few changes in the ranks of the top 20 countries during the 170 year period between 1700 and 1870, except for the USA which went from 40th to 4th.

Since 1870 Mexico’s population has surpassed that of nine different European countries. By 1900 Mexico had 11.7 million inhabitants moving it past Czechoslovakia and Turkey into the 18th spot. (Note that Gapminder population figures are higher than the Mexican census figures, perhaps because they attempted to correct for census under-counting; for the purposes of this analysis we use the Gapminder figures.) Mexico maintained its 18th rank until 1950 when its population of 28.5 million edged it past Spain and war torn Poland into 16th place. In 1970 its population reached 52.8 million putting Mexico in 14th place ahead of France and the Ukraine. By 1980 Mexico’s population of 68.3 million pushed it past Italy and Britain into 12th place. A decade later its population of 84.9 million moved Mexico past Germany into the 11th spot, where it has remained.

What will happen in future decades? Mexico’s position will change, but only slightly. In 2020, Mexico’s population may reach 125 million moving it past Japan into 10th place (Population forecasts for 2020 to 2050 are from the U.S. Bureau of Census). By 2030, Mexico, with a population of about 135 million, will have passed Russia, but fallen behind Ethiopia and the Philippines, putting it back in the 11th spot.

Mexico’s estimated population of 144 million in 2050 will place it 12th behind the Congo (World Population Prospects: the 2010 Revision). According to the United Nations, by 2100 Mexico’s population will decrease to 127 million moving it to the 20th spot, behind Tanzania, Uganda, Kenya, Iraq, Zambia, Niger, Malawi, and Sudan. Obviously, the accuracy of such a long term forecasts is very speculative. For example, given global climate change and possible food scarcities, some doubt if the sub-Saharan African countries can grow as rapidly during the last half of the 21st century as projected by the United Nations.

Marriage declining among Mexican couples

 Updates to Geo-Mexico  Comments Off on Marriage declining among Mexican couples
May 312011
 

Mexican couples still prefer marriage over the alternatives, but not as strongly as in the past. According to the 2010 census, 40.5% Mexicans age 12 and over were married, down from 44.5% in 2000 and 45.8% in 2009. The 11% decline since 1990 does not sound like much, but is significant when the data are investigated more deeply.

Because the data include all Mexicans over age 12, it is not surprising that 35.2% were single in 2010, compared to 37.2% in 2000 and 40.6% in 1990. The 13% drop since 1990 in the percentage for singles is mostly a result of the relative decline in the total number of teenagers, most of whom are unmarried, as a consequence of the decline in fertility over the past few decades.

The most impressive growth was for “free union” couples, those living together but not married. In terms of population, the proportion went from 7.4% in 1990 to 10.3% in 2000 and 14.4% in 2010, almost double the 1990 level. If we compare married couples with those in free union, we get an even clearer picture of the trend. In 1990, 13.9% of all couples lived in a “free union”; this figure increased to 18.8% in 2000 and 26.2% in 2010.

While roughly three of every four couples in Mexico are married, this varies significantly from state to state. It is not surprising that the least Catholic state—Chiapas— has the most couples living in “free union” – 38.8%. Chiapas also is one the most heavily indigenous states. But even in Chiapas, over six in ten couples are married. Other states with high rates of “free union” couples are Baja California (35.5%), Nayarit (34.5%), Baja California Sur (34.4%) and Quintana Roo (34.4%), a state with relatively few Catholics and a substantial indigenous population. The most Catholic state of all—Guanajuato—has the fewest “free union” couples, only 13.4%. Other states with relatively few unmarried couples are Yucatán (14.1%), Zacatecas (15.3%), Nuevo León (15.6%) and Aguascalientes (16.0%).

The census also includes three additional categories which all have increased rather rapidly since 1990. Those widowed went from 3.6% in 1990 to 4.3% in 2000 and 4.4% in 2010. This probably is a function of increasing life expectancy and people living longer on their own after their spouse dies, especially if the death resulted from an accident or violence. Separation, though still rather rare, is becoming more common, increasing from 1.2% in 1990 to 2.6% in 2000 and 3.7% in 2010. Divorce is also quite uncommon but increasing, from 0.7% in 1990 to 1.0% in 2000 and 1.5% in 2010.