Review of “Poor Economics: A Radical Rethinking of the Way to Fight Global Poverty”

 Books and resources, Mexico's geography in the Press  Comments Off on Review of “Poor Economics: A Radical Rethinking of the Way to Fight Global Poverty”
Oct 292019
 

In honor of the award of the 2019 Nobel Prize for Economics to Abhijit Banerjee, Esther Duflo and Michael Kremer for their experimental approach to alleviating global poverty, we republish this post from five years ago in which we highlighted the significance of the pioneering work of Banerjee and Duflo:

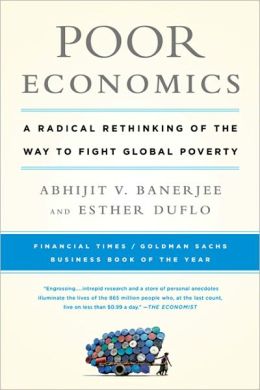
Every so often a book comes along that shakes up established wisdom and forces us to rethink our viewpoints and beliefs. The latest such book to cross my desk is Poor Economics: A Radical Rethinking of the Way to Fight Global Poverty by Abhijit V. Banerjee and Esther Duflo, published by PublicAffairs in 2011.
Geo-Mexico is reader-supported. Purchases made via links on our site may, at no cost to you, earn us an affiliate commission. Learn more.

poor-economicsThis is a worthy read for anyone interested in development theory, policy, practice and economics. The authors are professors of Economics at the Massachusetts Institute of Technology (MIT) and co-founded the Abdul Latif Jameel Poverty Action Lab (J-PAL). Their book reports on the effectiveness of solutions to global poverty using an evidence-based randomized control trial approach.

Banerjee and Duflo argue that many anti-poverty policies have failed over the years because of an inadequate understanding of poverty. They conclude that the battle against poverty can be won, but it will take patience, careful thinking and a willingness to learn from evidence.

The authors look at some of the unexpected questions related to poverty that empirical studies have thrown up, such as :

  • Why do the poor (those living on less than 99 cents a day) need to borrow in order to save?
  • Why do the poor miss out on free life-saving immunizations but pay for drugs that they do not need?
  • Why do the poor start many businesses but do not grow any of them?

The book was supported by an outstanding website that included:

  • Introductions to each chapter
  • Maps showing cited studies with links to original sources
  • Data and figures used with interactive data tools
  • A “What Can You Do” page with links to major organizations working in the field or for the problem discussed in the chapter

The website’s links to research papers mentioned in the book included four studies related to Mexico:

1. Do Conditional Cash Transfers Affect Electoral Behavior? Evidence from a Randomized Experiment in Mexico, by Ana L. De La O.

The evidence comes from the pioneering Progresa, the original Mexican conditional cash transfer (CCT) program (since repackaged as Oportunidades).  This CCT program led to a 7% increase in turnout and a 16% increase in the  incumbent vote share, with clear implications for politicians in areas where CCT programs reach a large percentage of voters.

2 School Subsidies for the Poor: Evaluating the Mexican Progresa Poverty Program, by T. Paul Schultz of Yale University (August 2001).

This study considered how a CCT program affected school enrollment. The CCT program increased enrollment in school in grades 3 through 9, with the increase often greater for girls than boys. The cumulative effect was estimated to add 0.66 years to the baseline level of 6.80 years of schooling.

3 Experimental Evidence on Returns to Capital and Access to Finance in Mexico, by David McKenzie and Christopher Woodruff (March 2008)

Microenterprises are often unable to access suitable financing, even though they are responsible for employing a large portion of the total workforce. This experiment, which gave cash and in-kind grants to small retail firms, demonstrated that this additional capital generated large increases in profits, with the effects concentrated on those firms which were more financially constrained. The estimated return to capital was found to be at least 20 to 33 percent per month, three to five times higher than market interest rates.

4 Working for the Future: Female Factory Work and Child Health in Mexico, by David Atkin (April 2009)

Atkins’ paper found that children whose mothers lived in a town where a maquiladora (export factory) opened when the women were sixteen years old were much taller than those children born to mothers who did not have a similar opportunity. The effect was so large that “it can bridge the entire gap in height between a poor Mexican child and the “norm” for a well-fed American child.” (Poor Economics, 229)

The increase in height could not be fully explained by the changes in family income resulting from employment in a maquiladora. As Bannerjee and Duflo suggest, “Perhaps the sense of control over the future that people get from knowing that there will be an income coming in every month -and not just the income itself- is what allows these women to focus on building their own careers and those of their children. Perhaps this idea that there is a future is what makes the difference between the poor and the middle class.” (Poor Economics, 229)

Conclusion

Banerjee and Duflo’s positive message is that poverty can indeed be alleviated, but we need to take one small measurable step at a time with constant evaluation of whether or not particular policies are successful, based on evidence, not just on belief systems.

Poor Economics: A Radical Rethinking of the Way to Fight Global Poverty” deserves its place of honor alongside other such genuine classics as E.F. Schumaker’s “Small Is Beautiful: A Study of Economics As If People Mattered” (1973). It is a must-read for geographers, regardless of your political persuasion.

Note: this is a lightly edited version of a post first published 27 January 2014.

Related posts

Aug 012016
 

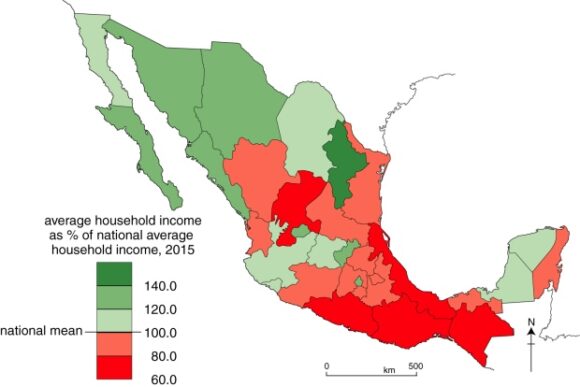
The National Statistics Agency’s (INEGI’s) 2015 Survey of Socioeconomic Conditions includes data for average household incomes in Mexico, on a state-by-state basis. The national average household income (for a three month period) is $45,887 (pesos) . The map below shows how each state’s average household income compares to the national average.

Household income, by state, 2015. Data: INEGI. Cartography: Tony Burton / Geo-Mexico; all rights reserved

Household income, by state, 2015. Data: INEGI. Cartography: Tony Burton / Geo-Mexico

The state with the highest household income is Nuevo León, with $66,836, more than 140% of the national average. The state with the lowest household income is Guerrero ($27,584), where the average household income is only 60.1% of the national average. Guerrero’s average household income is only 41% of the average for Nuevo León.

As we have regularly highlighted in the past, regional differences in Mexico are considerable, and a definite “north-south divide”can be identified for almost every socio-economic variable. Development efforts need to be focused on improving the key indicators for southern Mexico and reducing these regional disparities.

Related posts:

Instant poverty reduction – just change the baseline

 Mexico's geography in the Press, Updates to Geo-Mexico  Comments Off on Instant poverty reduction – just change the baseline
Jul 282016
 

The latest report on poverty from the National Statistics Agency, INEGI, looks like good news for Mexico’s poorest people but, sadly, this is only a mirage, based on a change in the measurement methods used.

The 2015 edition of INEGI’s Survey of Socioeconomic Conditions showed an overall real increase of 11.9% in household earnings, with an increase of over 30% in some states. According to the report, Mexico’s poor are richer by a third compared to last year, a change that some politicians will no doubt claim is the direct result of their effective policies.

Social activists were stunned by the claims of poverty reduction and Mexico’s National Council for the Evaluation of Social Development Policy (CONEVAL), which measures poverty levels using INEGI’s data, said the changes by the statistics institute were not credible.

According to Jonathan Heath, an independent economic researcher in Mexico City, Inegi is claiming that the previous methods overestimated poverty levels, but the change in methodology, without public consultation, “raises suspicion.”

Quite apart from the misleadingly positive spin on numbers, the change in methodology makes it completely impossible to compare current poverty rates with the rates for previous years.

Related posts:

Jun 232016
 

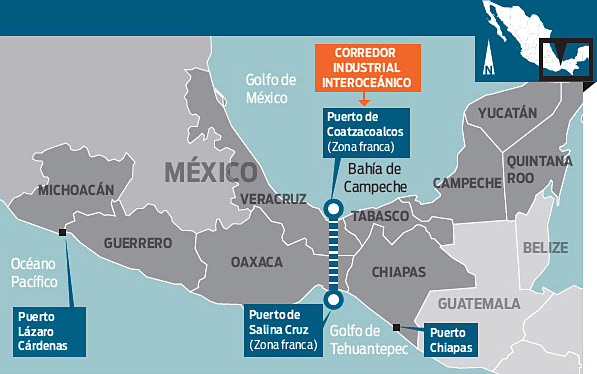
At the Mexico-China Forum for Cooperation in Mexico City in May 2016, authorities from China’s Guangdong Province met with Mexican officials and discussed plans to invest in Mexico’s recently-established Special Economic Zones.

special-economic-zones

These zones offer tax benefits and support services to investors in order to generate new sources of employment in southern Mexico (Guerrero, Oaxaca, Chiapas, Michoacán, Veracruz and Tabasco).

Trade between Guangdong Province and Mexico was worth $10.4 billion last year, 25% of the two countries’ total trade. Chinese firms are considering projects related to aerospace, vehicles, electronics and energy, which could add $480 million in foreign direct investment. In support of closer ties between Mexico and China, China Southern Airlines plans direct flights between Guangdong and Mexico starting next year, which would serve business travelers and also boost tourism.

Good news: tax on sugary drinks in Mexico is decreasing consumption

 Mexico's geography in the Press  Comments Off on Good news: tax on sugary drinks in Mexico is decreasing consumption
Jun 252015
 

On 1 January 2014, the Mexican government implemented a 10% tax on refrescos (aka sodas, pop, carbonated drinks) and other sugar sweetened drinks, raising the price by 1 peso (about 7 cents US) per liter, in an attempt to help curb the nation’s obesity problem. The tax became law despite heavy lobbying against it by the beverage industry. An 8% tax was also added to unhealthy snacks like potato chips and cookies.

Now preliminary results of a study (not yet peer reviewed) by the Mexican National Institute of Public Health and the Carolina Population Center at the University of North Carolina, show purchases of sugary beverages dropped 6% on average across 2014, and by as much as 12% in the last part of the year. The study analyzed consumption in 53 Mexican cities, and adjusted for other factors like the small downward trend in consumption of carbonated drinks in recent years. The effect was greatest in lower income households where purchases were cut by 9% over the year and by 17% in the later months. Moreover, the researchers claim that Mexicans drank more water after the refresco tax came into effect.

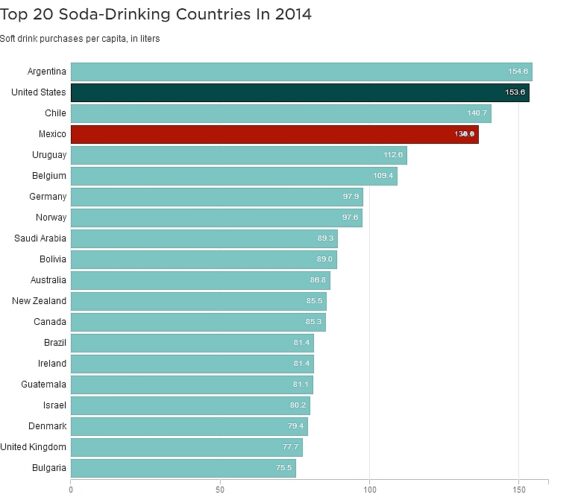
soft-drinks-2014Mexicans’ consumption of carbonated drinks per capita is the fourth highest in the world (behind Argentina, USA and Chile), with the average Mexican drinking the equivalent of 136 liters of Coca-Cola a year. Government revenues from the new tax totaled 18 billion pesos (US$1.3 billion) in 2014. The National Health Alliance, a Mexican public interest coalition, is now calling for the tax to increase to 20%, and for the abolition of tax on bottled water sold in containers of under 10 liters, to make it cheaper than sugary drinks. The Alliance is also pressuring the government to follow through on its promise to use the tax revenues raised to fund programs to prevent obesity and its associated diseases – for example, making free, clean drinking water available in schools that don’t currently have it.

In its March 2015 report on Carbonates in Mexico, Euromonitor International, reporting from an industry perspective, concludes:

(The tax) is one of the many new strategies that the Mexican government is implementing to fight the rising obesity and diabetes II rates after becoming the leading country for obese or overweight citizens globally in 2013…The most affected carbonated products are those sold in big sizes where consumers are more aware of the increased cost. Some leading brands have their stronger position among the biggest sizes of the market, and these brands have seen a greater impact in their volume sales. Amongst carbonates, Coca-Cola (de México SA de CV) holds a 68% total volume share, followed by its closest competitor Pepsi-Cola (Mexicana SA de CV), at 16% .

Carbonates is expected to keep on struggling with volume growth in Mexico due to consumers wanting healthier options, the increasing trend of having RTD teas and increasing trend of fruit-flavoured beverages instead of carbonates. Additionally, government actions have strongly impacted carbonates’ consumption.”

Related posts:

May 042015
 

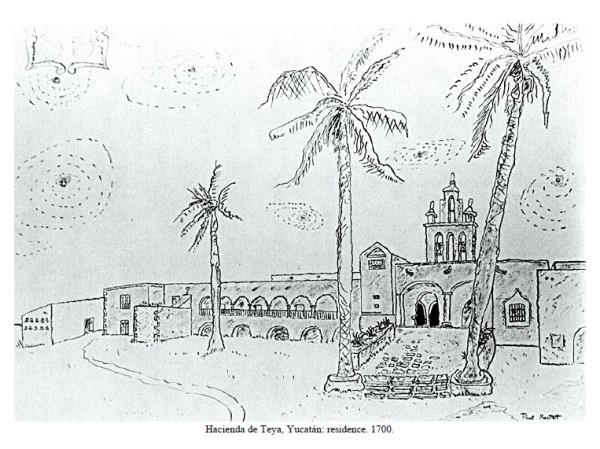
The Haciendas of Mexico: An Artist’s Record, by Paul Alexander Bartlett, first published in 1990 and now available as a free Gutenburg pdf or Epub, is a great starting point for anyone interested in the history, economics, art and architecture of the hundreds of colonial haciendas which still grace Mexico’s rural areas. Bartlett made one of the earliest artistic records of more than 350 of these haciendas, dragging his family around the country for years as he obsessively explored lesser-known places. The photographs and pen and ink illustrations in his outstanding book were made on site from 1943 to 1985.

Geo-Mexico is reader-supported. Purchases made via links on our site may, at no cost to you, earn us an affiliate commission. Learn more.
bartlett-hacienda-1

Pen-and-ink drawing of Hacienda de Teya, Yucatán, by Paul Bartlett.

Bartlett’s hacienda art work has been displayed at the Los Angeles County Museum, the New York City Public Library, the University of Virginia, the University of Texas, the Instituto Mexicano-Norteamericano in Mexico City, and at the Bancroft Library, among other places.

Paul Alexander Bartlett (1909-1990) attended Oberlin College and the University of Arizona, before studying art at the National University of Mexico (UNAM) and in Guadalajara. He was an instructor in creative writing at Georgia State College, Editor of Publications at the University of California Santa Barbara (1964-70) and wrote dozens of short stories and poems. His books include the short novel Adios, mi México (1983), and the novel When the Owl Cries (1960).

Writing must run in the family. Bartlett’s wife was the well-known poet and writer Elizabeth Bartlett (1911-1994). The couple met in Guadalajara in 1941 and married two years later in Sayula. Their son Steven James Bartlett is a widely published author in the fields of psychology and philosophy.

In the foreward to The Haciendas of Mexico: An Artist’s Record, novelist James Michener writes that:

I first became aware of the high artistic merit of Paul Bartlett’s work on the classic haciendas of Old Mexico when I came upon an exhibition in Texas in 1968. His drawings, sketches, and photographs evoked so effectively the historic buildings I had known when working in Mexico that I wrote to the architect-artist to inform him of my pleasure.”

Gisela von Wobeser observes, in her introduction, that,

When Bartlett began his hacienda visits in the 1940s, he found many of the hacienda buildings in ruins, exposed to the ravages of time and vandalism. Buildings had been converted into chicken coops, pigsties, public apartments, and machine shops. Others served as sources for construction materials, from which were scavenged rocks, bricks, beams, and tiles for the habitations of the local population. In some cases the destruction was total: All the hacienda’s structures were removed, and only the name of the place alluded to the fact that a hacienda had ever existed there.

At other haciendas, buildings were adapted to new uses. They were transformed into hotels, resorts, government buildings, barracks, hospitals, restaurants, and schools. The exterior of the buildings were generally left intact; interiors were completely changed.

The best—preserved hacienda buildings were those that continued to function as country properties or vacation homes. In these, Bartlett often found furnishings and utensils from the epoch of Don Porfirio, surrounded by the old traditions of Mexican country life.”

von Wobeser makes the useful distinction between three types of hacienda: those where grains were the main output, those specializing in cattle-rearing, and those for sugar-cane cultivation and processing.

The book describes haciendas in almost every state of the Republic. A handy map and list are provided of which haciendas are located in each state. There are more than 100 pen-and-ink illustrations and photographs in total in the book, which is arranged in seven chapters:

  1. The Hacienda System
  2. Through the Eyes of Hacienda Visitors
  3. Hacienda Life
  4. Fiestas
  5. Education
  6. The Revolution
  7. Mexico Since the Revolution

The accompanying text, written from a non-specialist perspective, is always lively, informative and interesting. The style of illustrations is varied, in keeping with the immense variety of haciendas that the author explored and sketched.

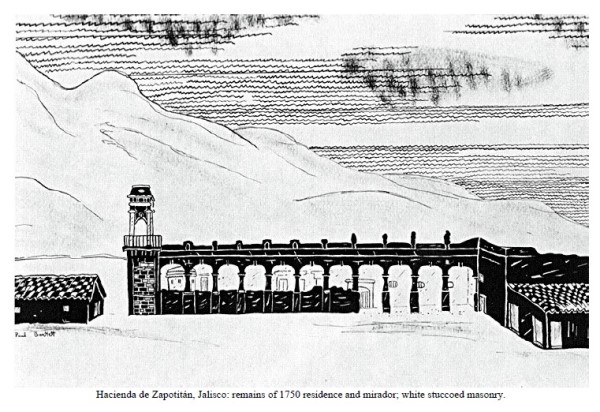
bartlett-hacienda-zapotitan

Pen-and-ink drawing by Paul Bartlett of Hacienda de Zapotitán, Jalisco

Coincidentally, the hacienda of Zapotitán in Jalisco (see illustration above), located close to Jocotepec and Lake Chapala, is the first hacienda to be featured in the on-going series of articles by modern-day hacienda explorer Jim Cook. Jim spends countless hours researching old haciendas, and regularly goes exploring with friends to see what is left on the ground today. His descriptions and photographs are easily the best contemporary accounts of the haciendas in western Mexico.

All in all, this is a really useful addition to the literature about Mexico’s haciendas, one guaranteed to answer many of the questions and doubts that visitors to Mexico often express about just how haciendas functioned and what working and living conditions were like, both for the owner’s family and the workers.

An archive of Bartlett’s original pen-and-ink illustrations and several hundred photographs is held in the Benson Latin American Collection of the University of Texas in Austin. A second collection of hacienda photographs and other materials is maintained by the Western History Research Center of the University of Wyoming in Laramie.

Want to visit some haciendas?

Chapter 9 of my Western Mexico, A Traveler’s Treasury (2013) focuses on the “Hacienda Route” to the south and west of Guadalajara, with an itinerary that includes visiting several haciendas within easy reach of the city.

Related posts:

Mar 122015
 

If you really want to learn more about Mexico’s economy and have a few hours to spare, then the free, open, online video course entitled Mexico’s Economy: Current Prospects and History by MRUniversity is the place to go. The lead instructor is Dr. Robin Grier of the University of Oklahoma. In a series of 51 short videos, she provides an outstanding analysis of Mexico’s economic history and current economic issues.

The course summary reads:

Is Mexico the most dynamic economy in Latin America?  After some tough times in the 1980s and 90s, Mexico has emerged as one of the economic leaders of the region.  Where does it stand among other emerging markets and what are its prospects for the future? In this four-week course, we will study the modern Mexican economy, some of the unique elements of development in a one-party, authoritarian regime, and some of the challenges the country faced in getting to this point.

No prior knowledge of economics (or of Mexico’s geography) is needed to follow the clear and concise min-lectures given by Dr. Grier, though many of her main lines of inquiry will be more than familiar to readers of Geo-Mexico.

There is lots of interesting material in these videos. For example, a short lecture under “Social Issues” entitled “Is There A Height Premium in Mexico?” looks at the evidence that taller people in Mexico earn more and have better economic opportunities than shorter Mexicans, before concluding that “each centimeter of height above the average is equivalent to 2% higher wages”. (Note: This video is a great follow-up to our April 2013 post, How tall is the average Mexican?)

The full list of videos in Mexico’s Economy: Current Prospects and History is

  • 1 An Overview of the Mexican Economy
    • Achievements
    • Challenges & prospects for reform
  • 2 Colonial Legacies: Obstacles to Growth after Independence
    • A reversal of fortune
    • Colonial Transportation Part I
    • Colonial Transportation Part II
    • Political Instability After Independence
    • The Economic Effects of the War of Independence
    • Transportation & Infrastructure in the 19th century
    • Slow Financial Development in Early Mexico
    • Law and Economic Development in Early Mexico
  • 3 Development Strategies
    • State-led development: an overview from 1917-1982
    • Commodity Driven Growth before the 1930s
    • Turning Inward: Industrial Policy after the Great Depression
    • Labor Unions and the PRI until democratization
    • What is a maquiladora?    An overview of Pemex
    • The problems of Pemex
    • Pemex’s poor performance
  • 4 Social Issues
    • Fertility and Demographic Change in Mexico
    • Is There A Height Premium in Mexico?
    • Conditional Cash Transfers
    • Migration and its Wage Effects in the US
    • Migration and Remittances
    • Economics of the Drug War
    • Finance, Law & Trust (Mexico)
    • Education Quality in Mexico
    • Education Inequality in Mexico
    • Why is Teaching Quality so Low?
  • 5 Land & Agriculture
    • Land Reform in an Authoritarian State
    • The Economic Life of the Tortilla
    • A Tomato Border Crossing
    • Watermelon Scale Economies
  • 6 The Debt Crisis of the 1980s
    • External Factors of the Debt Crisis
    • Domestic Factors of the Debt Crisis
    • Resolving the Debt Crisis
  • 7 The State Retreats: Reform in the 1980s & 1990s
    • External Factors Behind Reform
    • Privatization Part I: The state loosens its grip
    • Privatization Part 1a: Charges of Cronyism and Corruption
    • Privatization 2: Dealing with the Opposition
    • Privatization 3: Results
  • 8 The Peso Crisis
    • The Mexican Miracle? The Lead-Up to the Tequila Crisis
    • Tequila crisis
  • 9 NAFTA & the Mexican Economy
    • An Introduction to NAFTA
    • The effects of NAFTA on the Mexican economy
    • NAFTA and Mexican Agriculture
    • FDI & NAFTA
  • 10 Modern Mexico
    • Mexico & the Brics
    • Is Mexico the new China?
    • La Reconquista: Mexican direct investment in the US
    • Mexico as an open economy
    • Mexico and the 2008 Global Financial Crisis

The course is an outstanding resource for teachers and students of geography and economics, and worthy of wide use in a range of high-school A-level and IB courses as well as college and university programs.

Which cities in Mexico have the highest cost of living?

 Mexico's geography in the Press  Comments Off on Which cities in Mexico have the highest cost of living?
Feb 262015
 

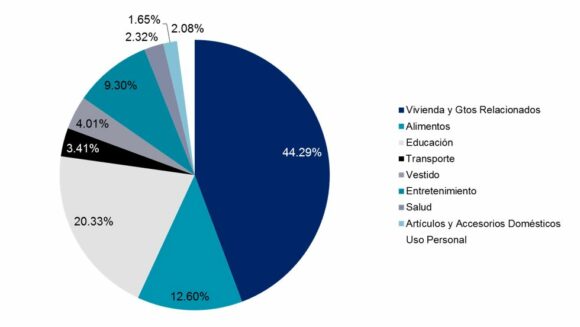
The recently published ‘Costo de Vida Nacional 2014-2015’ report from Recursos Humanos Mercer (Mercer Human Resources) provides a comparison of the cost of living in 42 cities, based on the cost of 182 different products and services. The study is released annually to provide a basis for corporations to decide on employee remuneration to reflect the varied living costs in different parts of the country.

The products and services used for comparison are divided into 9 different groups:

  • Housing
  • Food
  • Education
  • Public Transport
  • Clothing and footwear
  • Entertainment
  • Health
  • Domestic appliances
  • Personal care
Part played by different products/services in the cost of living of cities in Mexico

Part played by different products/services in the cost of living of cities in Mexico. Source: Mercer

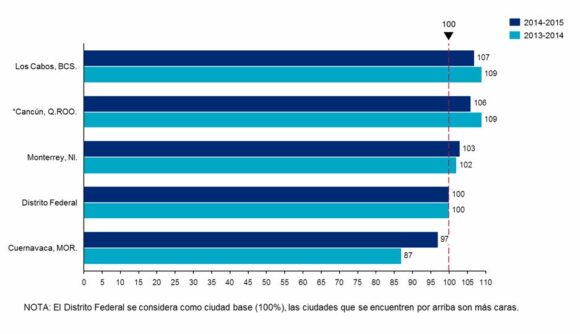
The values for each city reflect differences from the cost of living in Mexico City, which is assigned an index value of 100. The cities with the highest cost of living in 2014-2015 were Los Cabos, Cancún, Monterrey, Mexico City and Cuernavaca (graph below). In the 2013-2014 version, the cities with the highest cost of living were Cancún, Los Cabos, Monterrey, Mexico City and Puebla.

Cities with the highest cost of living in Mexico

Cities with the highest cost of living in Mexico. Source: Mercer

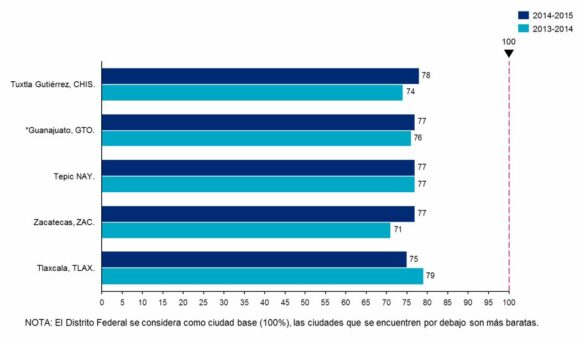
The cities with the lowest cost of living in 2014-2015 were Tlaxcala, Zacatecas, Tepic, Guanajuato and Tuxtla Gutiérrez (graph below). In 2013-2014, the cities with the lowest cost of living were Zacatecas, Tuxtla Gutiérrez, Guanajuato, Tepic and Veracruz.

Cities with the lowest cost of living in Mexico

Cities with the lowest cost of living in Mexico. Source: Mercer

Related posts:

The spatial diffusion of Banamex branches across Mexico prior to 1960

 Other  Comments Off on The spatial diffusion of Banamex branches across Mexico prior to 1960
Jan 102015
 

This post looks at where branches of Banamex (Banco Nacional de México) were founded in the period prior to 1960. Banamex is one of the oldest banking institutions in Mexico. It is now a subsidiary of Citigroup, but remains the second largest bank in the country after BBVA Bancomer.

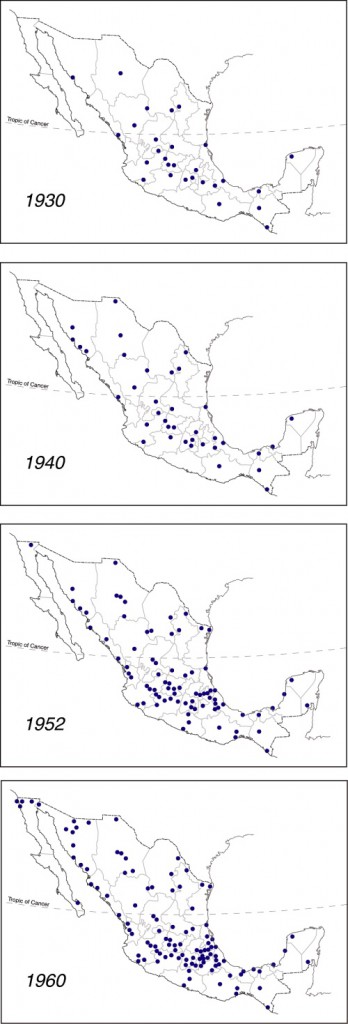
Diffusion of Banamex branches across Mexico prior to 1960

Diffusion of Banamex branches across Mexico prior to 1960. Click to enlarge

Banamex was formed on 2 June 1884 from the merger of Banco Nacional Mexicano and Banco Mercantil Mexicano, two banks that had only been operating for a couple of years. Shortly after its founding, Banamex had branches in Mexico City, Mérida, Veracruz, Puebla, Guanajuato, San Luis Potosí, and Guadalajara.

The maps to the left are based on Figure 8 of Las Regiones Geográficas en México by Claude Bataillon (8th edition, 1986, Siglo Veintiuno Editores).

Each dot represents the location of a branch of Banamex in the year shown. For simplicity’s sake, it is assumed that all branches present on any earlier map continued to exist through to 1960, and did not close or relocate in the interim.

The concept of spatial diffusion looks at the spread of an innovation, whether a new idea, technique, good, service or brand. The spatial diffusion of information or of the adoption of innovations is an important subset of spatial interactions. Looking at the spatial diffusion of a banking network offers lots of interesting insights into how Mexico’s economic geography has changed over the years.

There are three basic types of diffusion. The first is relocation diffusion where people travel or migrate and bring their cultural and technological practices with them. For example, modern studies in the genetics of corn (maize) have established that ancient Mexicans first domesticated corn in the Balsas valley. They then migrated both northwards and southwards, taking the practice of cultivating corn with them.

The second is contagious diffusion, which generally spreads from person to person and exhibits strong distance decay. An example is the spread of the Jehovah’s Witness faith in Mexico which required a considerable amount of face-to-face personal interaction. Many diseases also spread by contagious diffusion.

The third is hierarchical diffusion, which spreads across higher levels of a hierarchy and then down to lower levels. This is often how information from the top of an organization reaches those at the bottom. An example is the government’s 1970s family planning program that was first adopted in large cities, then smaller cities, and eventually penetrated into rural areas.

Combinations of these three types are also possible. One relatively recent example is the spread of the H1N1 influenza virus in early 2009. First reports were that it started in a rural village, probably in Oaxaca, and spread by contagious diffusion to others in the village. From there an infected person temporarily relocated to Mexico City where the flu again spread by contagious diffusion. From Mexico City, the top of the Mexican hierarchy, it spread down the hierarchy as carriers of the virus traveled to smaller Mexican cities and to other cities worldwide.

In the case of the diffusion of Banamex branches shown on the maps, the main type of diffusion involved is hierarchical. In this case, given that Banamex is a banking institution, the hierarchy reflects where most economic activity is taking place at the time. (There would be little point in placing a new branch in a location where little money was in circulation).

The 1930 distribution of Banamex branches looks to be quite scattered across the country, though Baja California and north-west Mexico have no branches and fall outside the network. By 1940 more additional branches have opened in the northern half of Mexico than the southern half, and the north-south economic divide that we have commented on in many previous posts is beginning to become apparent. Between 1940 and 1952 many new Banamex branches are added in central Mexico (this is the period when in-migration was turning Mexico City into a monster) and along the west coast, following the line of Highway 15 which runs from Guadalajara to the border with California. Overall, the north-south divide is now quite clear.

Between 1952 and 1960 additional branches open close to the US border, a branch finally reaches Baja California Sur (in La Paz) and the economic dominance of northern Mexico over southern Mexico is clearly established.

One of the most striking features, when comparing all four maps, is how the number of Banamex branches in southern and south-eastern Mexico (defined as the states of Chiapas, Tabasco, Campeche, Yucatán and Quintana Roo) barely changed between 1930 and 1960.

It would be interesting to update this example with similar maps for more recent years. Please contact us if you have access to suitable data or know where such data may be found.

Other posts related to the concept of diffusion:

Another instance of diffusion, of cholera in Mexico during the 1991-1996 epidemic, is mapped and discussed in chapter 18 of Geo-Mexico: the geography and dynamics of modern Mexico. Geo-Mexico also includes an analysis of the pattern of HIV-AIDS in Mexico, and of the significance of diabetes in Mexico.

Oct 232014
 

The online Atlas of Economic Complexity is now interactive, allowing users to choose and combine a large number of variables related to imports, exports, date and country. In the webpage’s own words, it is “a powerful interactive tool that enables users to visualize a country’s total trade, track how these dynamics change over time and explore growth opportunities for more than a hundred countries worldwide.”

What is economic complexity?

A country with a high Economic Complexity has a wide range of complex knowledge capabilities related to productive enterprises. Its economy is likely to produce sophisticated products that require a very wide and diverse set of knowledge capabilities. For example, relatively few countries have the capabilities to produce highly complex chemicals or pharmaceuticals, since their production requires very specialized equipment and very precise measuring instruments. Equally, very few countries have nuclear power stations or space stations, since they lack the range of knowledge capabilities needed to build them. At the other end, a very large number of countries have far less complex economies that are capable of producing simple products (basic foods, mineral ores, lumber, garments, shoes, glass, kitchen utensils, furniture) but not products involving more complicated processes or technology

We first discussed the Atlas in 2012 in How “complex” is the Mexican economy?, when we noted that the Atlas ranked Mexico’s Economic Complexity Index (ECI) as #20 of the 128 countries studied. The interactive nature of the online Atlas has added the opportunity to explore many more trends in trade, generating a range of related, visually-appealing infographics.

In particular, choosing Mexico as the country, the Atlas can answer questions such as:

  • What does Mexico import and export?
  • How has Mexico’s trade evolved over time?
  • What are the drivers of Mexico’s export growth?
  • Which new industries are likely to emerge in Mexico? Which are likely to disappear?
  • What are the GDP growth prospects of Mexico over the next 5-10 years, based on its productive capabilities?

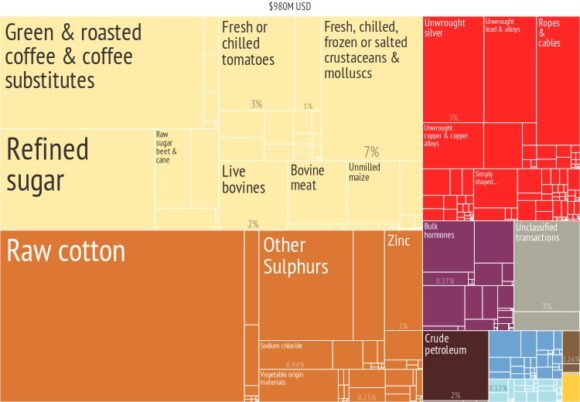
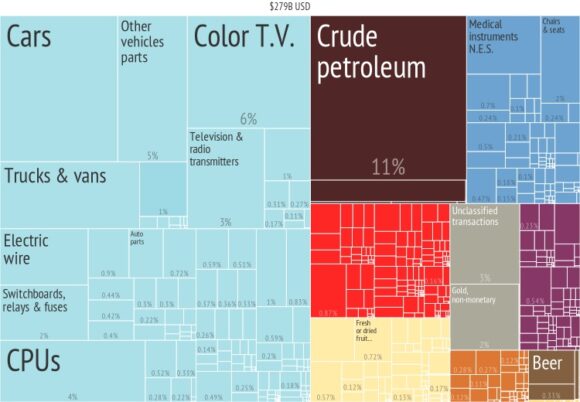
Playing with the variables and dates in the Atlas is a really interesting way to explore just how Mexico’s exports and imports have changed over the years. For example, compare these infographics for Mexico’s exports in 1964 and 2010 respectively:

What_did_Mexico_export_in_1964_

Mexico’s exports in 1964

Mexico's exports in 2010

Mexico’s exports in 2010

It is sometimes hard to imagine just how much Mexico has changed in the past fifty years! Overall, at rank #20, Mexico turns out to have an unusually high Economic Complexity Index given its income level. (All the other countries in the top 20 have significantly higher incomes than Mexico).

According to the Atlas, during the rest of this decade Mexico’s GDP should grow relatively rapidly, bringing its GDP rank more in line with its Economic Complexity Index. In general, analyses in the Atlas indicate that during the last few decades countries with higher than expected ECIs compared to their income levels experience more rapid economic growth.

Note, though, that while this relationship is empirically true, it does not explicitly include other factors thought to be important to economic growth such as governance and institutional quality, corruption, political stability, measures of human capital and competitiveness indicators.

Related posts

Aug 232014
 

Mangrove swamps have an undeserved reputation for being impenetrable thickets harboring noxious insects and reptiles. But they also have considerable value, in terms of both ecology and economics, as this case study of the Marismas Nacionales mangroves on the west coast of Mexico will demonstrate.

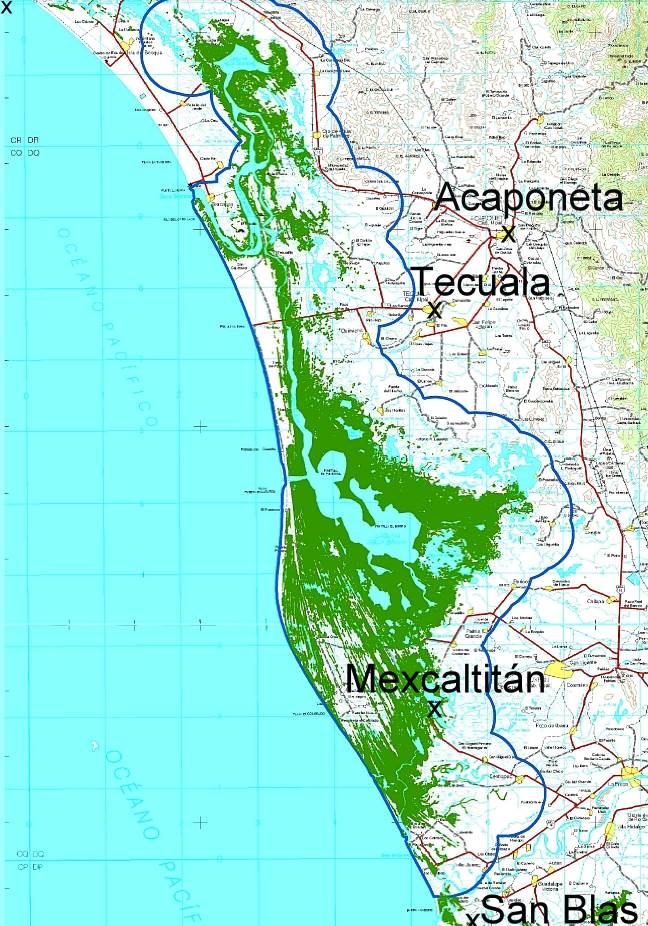
Map showing location of Marismas Nacionales

Map showing location of Marismas Nacionales

The Teacapán-Agua Brava-Marismas Nacionales Lagoon System extends northwards along Mexico’s Pacific Coast from San Blas in Nayarit to the southern part of Sinaloa. It is one of Mexico’s largest areas of mangroves. The total area of mangroves in the Marismas Nacionales is estimated at 58,100 hectares (224.3 square miles). Four species of mangroves are found here:

  • black mangrove (Avicennia germinans)
  • white mangrove (Laguncularia racemosa)
  • red mangrove (Rhizophora mangle)
  • button mangrove (Conocarpus erectus)

Mangroves in Mexico are estimated to be disappearing at a rate of at least 2% per year, though the available evidence suggests that the Marismas Nacionales mangroves are relatively undisturbed.

A 2012 study, undertaken by a group of Stanford Students for the Ocean Innovations Environmental Defense Fund considered the ecosystem services provided by Mexico’s largest area of mangroves, the Teacapán-Agua Brava-Marismas Nacionales Lagoon System of Nayarit and southern Sinaloa and attempted to calculate the mangroves’ carbon sequestration potential.

The ecosystem services considered included:

  • fisheries for shrimp, mollusk, fish and crustaceans.,
  • aquaculture (primarily shrimp), forestry (charcoal, firewood, wood and roofing materials),
  • agriculture,
  • coastal protection (mangrove roots help bind unstable coasts, preventing erosion and providing a natural barrier against hurricanes),
  • habitat for other species (breeding, shelter and feeding places for fish, crustaceans and birds) and
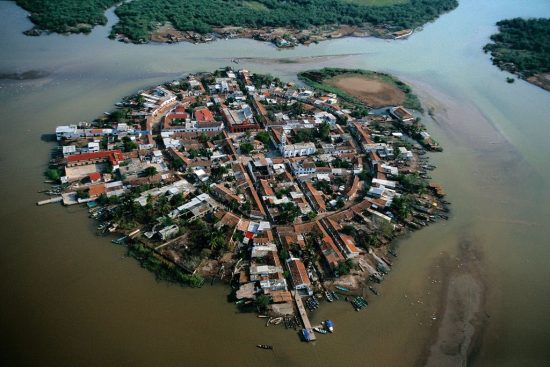
  • ecotourism (as in Mexcaltitán)
Mezcatitlán

Mezcatitlán, island settlement in Nayarit

The report tries to quantify the value of each of these services. For example, it finds that the total annual revenue brought in by coastal fisheries alone around Marismas Nacionales (including shrimp, catfish, crabs and sharks) almost certainly exceeds $10.8 million.

In terms of carbon storage, the study took into account the carbon sequestered in the form of biomass (as a result of photosynthesis) as well as the carbon exported from the ecosystem via processes such as respiration, sediment burial and mineralization. The total Net Ecosystem Production (NEP) of carbon in the Marismas Nacionales was calculated to be 8 metric tons of carbon/ha/yr or about 470,000 metric tons/yr for the entire area.

Reference:

  • Marismas Nacionales Conservation & Carbon Sequestration Study. Preliminary Report (pdf file)

Related posts:


Income inequality before and after tax

 Other  Comments Off on Income inequality before and after tax
Jul 212014
 

In several previous posts, we have explained how the GINI index can be used to quantify the degree of income inequality within a population or country. The higher the GINI index, the more inequality there is. National comparisons of inequality are usually based on working out the GINI index for countries using their residents’ gross (pre-tax) incomes. However, it is also possible to calculate the GINI index for net incomes, incomes after taxes have been taken into account.

This enables economists to assess the impact of tax systems on income distribution (and income inequality) in a country.

The graph below (Figure 2 from Brown et al, 2013) shows pre- and post-tax income GINI coefficients for a selection of countries, including the larger economies in Latin America.

gini-pre-post-taxesIn the European countries, such as Belgium and Sweden, on this chart, the GINI coefficient after tax (dark bars) is much lower than the GINI coefficient before tax (light-colored bars). This means that the taxation system has led to less income inequality than existed prior to taxation. In general terms, this means that the tax system is (overall) a progressive one [i.e. one where taxes take an increasing proportion of income as income rises].

In Latin American economies, a different picture emerges. With the exceptions of Brazil and Costa Rica, the GINI coefficients after taxes are taken into account are actually higher than the GINI coefficients before tax, meaning that income inequalities have become greater as a result of the tax system. In general terms, these tax systems are regressive [where taxes take a decreasing proportion of income as income rises].

In Brazil and Costa Rica, the levels of income inequality remain unchanged after taxation is taken into account.

Clearly, if reducing income inequality is a priority for Latin America, then something has to change. Whether a nation prefers a tax system that is regressive or progressive is a question of political beliefs and policy, as well as a question of economics.

It should be noted that the chart is based on calculations using data from 2012 or earlier. It will be interesting to see how Mexico’s recent major fiscal reforms impact its GINI coefficient in the coming years. Will the recent reforms lead to a more equitable situation and reduce the GINI coefficient, or will they foment greater inequality of income, making the rich richer and the poor poorer?

Note:

The exact methodology used to derive the post-tax GINI coefficient is not clear in the original article. In particular, it is unclear whether or not the after-tax income in the chart includes the large number of Mexican workers in the informal sector who generally do not pay any income or payroll tax.

Source of image:

“Towards financial geographies of the unbanked: international financial markets, ‘bancarization’ and access to financial services in Latin America” by Ed Brown, Francisco Castañeda, Jonathon Cloke and Peter Taylor, in The Geographical Journal, vol 179-3, September 2013, 198-210.

Related posts:

Country groupings: BRICs, EAGLEs and now MINTs

 Mexico's geography in the Press  Comments Off on Country groupings: BRICs, EAGLEs and now MINTs
Jun 122014
 

Economists have long suggested various sub-groupings of emerging markets. One of the most commonly used in geography is BRIC, an acronym formed from the initial letters of Brazil, Russia, India and China. The term BRIC was first coined by  Jim O’Neill in a 2001 paper entitled “The World Needs Better Economic BRICs”. The concept of BRICs has become outdated as the four countries’ economies have diverged over the past decade.

Next on the scene was the term EAGLEs to cover the world’s Emerging and Growth-Leading Economies. The advantage of this acronym is that it is not tied to specific countries. Any term comprised of country names is likely to date fairly quickly, and become much less useful. The members of the EAGLEs club are currently:

  • Brazil
  • China
  • Eqypt
  • India
  • Indonesia
  • Mexico
  • Russia
  • South Korea
  • Taiwan
  • Turkey

Combined, these ten EAGLEs are  expected to account for 50% of all global growth that occurs over the next 10 years.

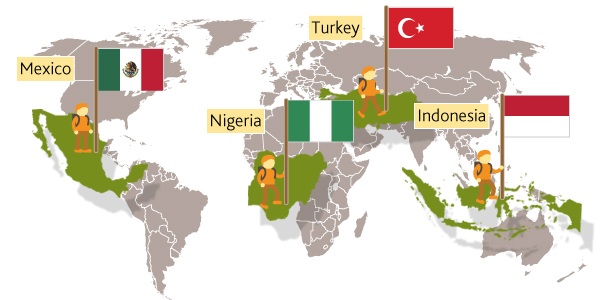
The four MINT countries

The four MINT countries

Jim O’Neill has recently popularized another contribution to the terminology of countries believed to be emerging market giants: MINTs. The term was originally coined by Fidelity Investments. The four members of this exclusive grouping are:

  • Indonesia
  • Mexico
  • Nigeria
  • Turkey

In proposing the new grouping, O’Neill makes a compelling case for Mexico’s future economic success. First, its large population ensures a viable domestic market. It also has a growing middle class and a steadily improving dependency ratio (the number of working age people compared to those not working). In addition, Mexico has a privileged position in world trade, linking North America to Asian markets. O’Neill believes that Mexico could experience double-digit rates of economic growth in the coming years, with GDP/person rising from its current figure of about 11,000 dollars to 48,000 dollars by 2050.

Related posts:

Extreme poverty declined between 2010 and 2012

 Other, Updates to Geo-Mexico  Comments Off on Extreme poverty declined between 2010 and 2012
Feb 012014
 

As we saw in an earlier post – Poverty on the rise in some states in Mexico – the total number of people living in poverty in Mexico continues to rise, though the poverty rate (as a percentage) remains roughly the same.

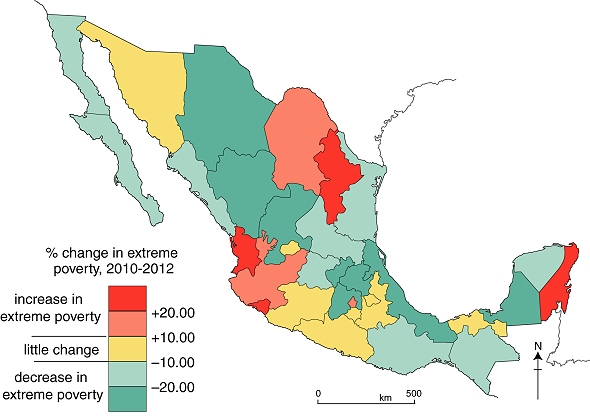
The measures of poverty used by Mexico’s National Political and Social Development Commission (Coneval) are multidimensional, and not simply based on household or personal income. This map shows the changes in “extreme multidimensional poverty” (a category that includes “the poorest of the poor”)  that occurred in Mexico between 2010 and 2012.

Changes in levels of extreme poverty in Mexico, 2010-2012.

Changes in levels of extreme poverty in Mexico, 2010-2012. Credit: Geo-Mexico; all rights reserved. Data: Coneval

In areas shaded red, a higher percentage of the population experienced “extreme poverty” in 2012 than in 2010; their personal situations and opportunities have presumably become significantly worse. Interestingly, this category includes the prosperous states of Nuevo León (economy based on manufacturing and services) and Quintana Roo (tourism).

The reverse is true for areas shaded blue where the extreme poverty rate has fallen: many of the people living in those areas have moved out of the most extreme category and presumably have seen their fortunes and opportunities improve, even if, in most cases, not sufficiently to have escaped the “poverty” category completely. This category includes more than half of Mexico’s 32 administrative divisions.

The fact that “extreme poverty” has declined in more than half of Mexico is encouraging, and suggests that government policies aimed at poverty reduction, such as Oportunidades are gradually making a difference. It remains to be seen whether or not this trend continues over the next few years.

Related posts:

NAFTA 20 years on: success or failure?

 Mexico's geography in the Press  Comments Off on NAFTA 20 years on: success or failure?
Jan 092014
 

The North American Free Trade Association (NAFTA) came into effect on 1 January 1994. Twenty years on, opinions remain sharply divided over the extent to which NAFTA has benefited Mexico and Mexicans.

NAFTA has led to progress

The Economist magazine is among those arguing that NAFTA has transformed the Mexican economy for the better, but that much remains to be done if Mexico is to make the most of its partnership with the USA and Canada. Two recent articles from The Economist summarize the arguments for NAFTA having been a success story for Mexico:

NAFTA has hindered progress

Other analysts are equally convinced that NAFTA has hindered Mexico’s economic progress and has brought problems for many Mexicans. For example, Timothy A. Wise, the policy research director at Tufts University’s Global Development and Environment Institute, argues that NAFTA has had adverse impacts on agriculture and on Mexico’s food security.

In Wise’s view, NAFTA had a sequence of impacts. First, it led to a flood of US imports of corn, wheat, meat and other staples which drove Mexican producer prices down below the costs of production. (Some US corn exports to Mexico were “dumped” at prices 19% below even US farmers’ costs of production). While Mexico’s own agricultural exports to the USA increased due to NAFTA, the overall agricultural trade deficit between the two countries widened considerably, with Mexico needing to import almost half of its total food requirements by the mid-2000s.

The international prices for many of these imported crops have doubled or tripled over the past decade, and Mexico’s agricultural trade deficit with the USA jumped to more than $4 billion. Why does Wise choose to highlight the beer industry? He argues that even the success of Mexico’s beer industry has brought more benefits to US farmers than Mexican farmers because the two major raw materials for beer (barley and malt) are not produced in Mexico, but imported from the USA.

Similarly, in a Guardian article entitled NAFTA: 20 years of regret for Mexico, Mark Weisbrot, the co-director of the Centre for Economic and Policy Research in Washington DC, concludes that, “It’s tough to imagine Mexico doing worse without NAFTA.”

Conclusion

Both sides of this argument hold some merit. While some sectors of Mexico’s economy, and some people, have undoubtedly gained from NAFTA, others have lost.

Related posts:

The impact of immigrants on U.S. public budgets

 Updates to Geo-Mexico  Comments Off on The impact of immigrants on U.S. public budgets
Sep 052013
 

As the US Congress debates new immigration reform legislation there is considerable confusion concerning the fiscal impact of immigrants. One side argues that immigrants pay relatively little in taxes and absorb costly benefits in terms of public health, education, welfare, etc. Others note that immigrants often pay significant amounts in taxes and get little back in terms of benefits. Obviously, it depends on the immigrant and perhaps on their legal status.

OECD-migrationIn June 2013, the OECD published “International Migration Outlook,” a study on the budgetary impacts of immigrants to OECD countries. (OECD countries Mexico and 29 other mostly rich and mainly European countries). The study compares native-born with foreign-born residents, some of whom may have already become citizens. The study suggests that immigrants may have a slightly positive impact on fiscal budgets. The average for all OECD countries was 0.3% of GDP; the comparable figure for the USA was 0.03%.

Immigrants tend to have lower incomes, pay a bit less in taxes, but receive less in benefits. They tend to be younger and thus receive less in public health benefits. If they have children, they receive considerable education benefits. Obviously these are gross generalizations as some immigrants are highly paid executives and scientists, who pay significant taxes, while others may work as domestics or laborers, paying far less in taxes. Given that many public costs, including defense and debt service, are very hard to allocate to migrants versus native-born, the study suggests that immigration appears to be neither a drain nor a gain on fiscal budgets.

A big issue in the USA is the specific impact of Mexican immigrants on the fiscal budget, particularly the impacts of undocumented immigrants. Many legal immigrants from Mexico are family members joining their relatives. They may or may not be employed and thus may not pay income taxes. On the other hand, virtually all illegal immigrants seek employment. Furthermore, many obtain formal sector jobs by using fake Social Security cards or “Individual Tax Identification Numbers.” Their employers deduct federal and state income tax from their paychecks and forward these funds to government tax agencies.

Undocumented immigrants rarely file tax returns and thus very rarely receive the tax refunds to which they might otherwise be entitled. All immigrants pay considerable amounts in gasoline and sales taxes as well as property taxes, either directly or indirectly as part of their rent. Given that most illegal immigrants are rather young, relatively healthy and without children, they may have only a small impact on public education and health expenses. Their children are often born in the US, are US citizens, and should not be considered immigrants. It appears that undocumented immigrants might be paying more into the public coffers than they receive in benefits. A closer look at the data may provide some answers.

A 2007 study by the US Congressional Budget Office (CBO) entitled “The Impact of Unauthorized Immigrants on the Budgets of State and Local Governments” directly addressed this issue. The study notes that at the Federal level roughly 50% of illegal immigrants pay income or payroll taxes, which include Medicare taxes. But they generally are excluded from such Federal benefits as Social Security pensions, Medicare and Medicaid (other than emergency services), Food Stamps, and Assistance to Needy Families. The data suggest that in general illegal immigrants usually pay more in federal taxes than they receive in benefits. On the other hand, a number of court cases mandate that state and local governments cannot withhold from illegal immigrants certain services such as education, selected health care, or law enforcement. Many illegal immigrant children do not speak English; therefore their education may be more costly.

In assessing the fiscal impact on state and local government budget, the CBO analyzed 29 reports published since 1990. The study noted that undertaking such an analysis is very challenging and involves many big assumptions. Still the CBO analysis concluded that the relatively small amount spent by state and local governments on services for illegal immigrants is not fully offset by the even smaller amount of tax revenues collected from them including federal revenues they may receive for this purpose.

In conclusion, available research suggests that the impact of immigrants on public budgets is not very clear. With respect to all immigrants, there appears to a slight positive fiscal impact according to a recent OECD study. The older CBO analysis indicates that undocumented immigrants appear to have a positive impact of the federal budget, but a negative fiscal impact for state and local governments. Of course, the impact varies enormously among migrants depending on their incomes, tax brackets, consumption patterns and needs.

Related posts:

Shopping habits in Mexico

 Mexico's geography in the Press  Comments Off on Shopping habits in Mexico
Aug 282013
 

Kantar Worldpanel México’s survey of shopping habits for 8,500 homes across the country reveals that 70% of household expenditures are spent in one of three main “purchasing channels”.

1. The first, traditional convenience or “corner” stores receive 35% of household spending, and are the channel most frequently visited, 217 times/year/household on average. Poorer households rely more on these stores than middle-class households. Most visits (71%) are on weekdays and 44% of visits are to purchase items for immediate consumption.

2. Supermarkets are the second main channel, used by 98% of households, with a frequency of 49 trips/year. Supermarkets are favored by middle class families for their weekly or biweekly shop, usually on weekends.

3. The third main channel is door-to-door and catalog sales, used by 92% of households, with a frequency of 42 times/year.

According to the study, 74% of households choose the nearest store and 78% attach importance to the location of the store.

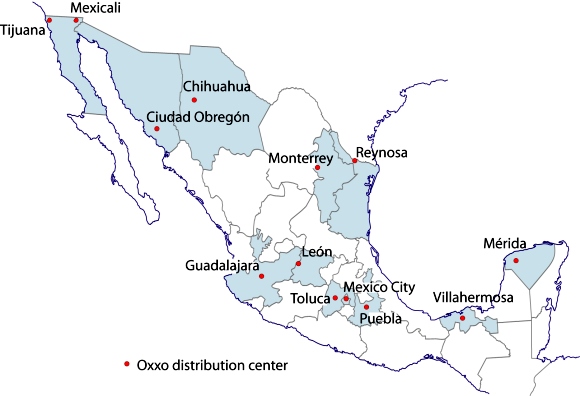
Cities with Oxxo Distribution Centers. Credit: Tony Burton/Geo-Mexico

Cities with Oxxo Distribution Centers. Credit: Tony Burton/Geo-Mexico

It is no coincidence, then, that Oxxo, the nation’s largest convenience store chain, recently opened its 11,000th store in Mexico. Oxxo now serves residents of 350 towns and cities, and plans to add a further 1,037 outlets before the end of this year. Its extensive network is served via a chain of 15 strategically-located distribution centers in the 13 cities shown on the map above.

Related posts:

Why Is Mexico in the OECD?

 Other  Comments Off on Why Is Mexico in the OECD?
Jan 172013
 

The Organisation for Economic Co-operation and Development (OECD) was founded in 1961 to promote economic growth. Its current 34 members include 25 European countries along with Canada, the USA, Australia, New Zealand, Japan, South Korea, Mexico, Chile and Israel. Mexico joined the group in 1994. Four new members were admitted in 2010: Chile, Slovenia, Estonia and Israel. Russia is not yet a member but is moving toward that goal. The current Secretary General of the OECD is Mexico’s  José Ángel Gurría Treviño, first appointed in 2006; his current term in this position extends to 2016.

oecd_logo

OECD member countries are among the most highly developed and wealthiest countries on the planet. Though OECD members represent only 18% of the world’s population, they account for 55% of global Gross Domestic Product (GDP), measured on a Purchasing Power Parity (PPP) basis. Among OECD members, Mexico has the lowest per capita GDP, slightly behind Chile and Turkey. In terms of the UN Human Development Index (HDI) Mexico trails all the others except Turkey. How did Mexico become a member of this very elite set of countries?

There are three main criteria for OECD membership:

  1. Democracy and respect for human rights
  2. Open market economy
  3. GDP per capita (PPP) at least as high as the poorest OECD member

When Mexico became a member in 1994, it was a democracy albeit a one party democracy. It was very clearly an open market economy and its per capita GDP was slightly higher than Turkey’s. Consequently, it met the criteria and was admitted by other OECD members. (See Elżbieta Czarny et al., The Gravity Model and the Classification of Countriesin Argumenta Oeconomica, 2 (25) 2010.)

What are the benefits of OECD membership?

As a member, Mexico fully participates in OECD discussions concerning economic, social and environmental situations, issues, experiences, policies, and best practices. OECD collects and analyzes a very wide range of data which enables Mexico to monitor its position and progress on numerous important dimensions. OECD also has numerous world class experts and committees that can assist countries on specific issues and policies.

Certainly being a member of this elite group provides Mexico with an amount of international prestige. On the other hand, most development analyses and comparative OECD reports show Mexico near the bottom on most measures and rankings.

Related posts:

The value in Mexico of unpaid work in the home

 Other  Comments Off on The value in Mexico of unpaid work in the home
Aug 042012
 

A study by the National Statistics Institute (INEGI) based on 2010 data calculated that routine work done in the home (almost 80% of the time-value involved by women) is worth about 2.9 trillion pesos to the Mexican economy each year, equivalent to more than 20% of Mexico’s GDP. By way of comparison, manufacturing accounts for 17.2% of GDP, and commerce 15% of GDP.

The INEGI calculation includes the costs in time/labor needed to meet the demands of the home, and the net salary that would be paid for someone undertaking those tasks.

INEGI divides work done in the home into six categories:

  • help and assistance to members of the household. [In market value terms, this is equivalent to 6.9% of GDP]
  • preparation and serving of meals [5% of GDP]
  • cleaning and maintaining the home [3.5% of GDP]
  • shopping and household administration [2.9% of GDP]
  • washing and looking after footwear and clothing [2% of GDP]
  • helping other households and voluntary work [1.6% of GDP]

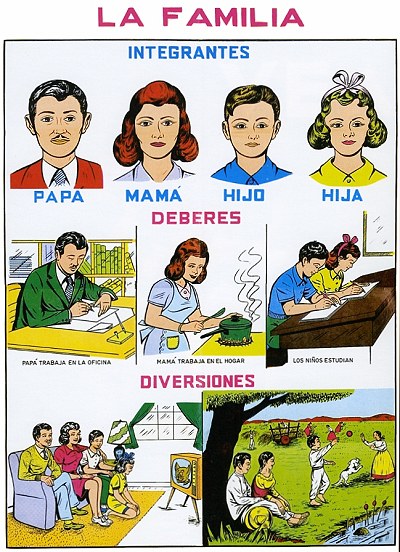
INEGI’s findings suggest that some aspects of family life and the division of “duties” (such as that common to older images like the one below) are not changing very rapidly.

"La Familia" ("The Family"). School chart of unknown date.

“La Familia” (“The Family”). School chart of unknown date.

Related posts:

Is Mexico experiencing a demographic dividend?

 Other  Comments Off on Is Mexico experiencing a demographic dividend?
Jul 232012
 

Mexico’s 2010 population of 112 million makes it the world’s 11th largest country in terms of population. The rate of population increase is now slowing down as fertility rates fall. The rate of increase, which was 2.63%/yr for the period 1970-1990, fell to 1.61%/yr for the period 1990-2010.

Even as the total population continues to grow over the next few decades, some very important changes are underway in Mexico’s population structure.

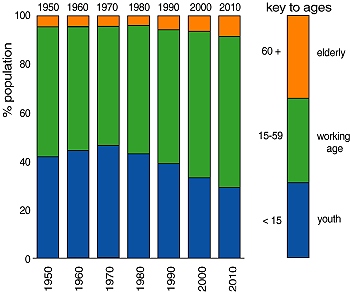
The graph divides Mexico’s population into three age categories: under 15 (youth), 15-59 (working age) and 60+ (elderly).

Mexico's population structure, 1970-2010

Mexico’s population structure, 1950-2010

The percentage of the total population of youthful age peaked in about 1970 at 46.2% and has since fallen to 29.3% in 2010. Over the same time period, the percentage of working age population has risen from 48.2% to 61.6%, while the percentage of elderly has gone from 5.6% to 9.1%.

Why is this important?

Perhaps the most obvious change is that government spending on schools and services for youth needs to shift towards spending on health care, pensions and services for the elderly. There are already some suburbs of the Mexico City Metropolitan Area that have experienced a dramatic shift in average age. Perhaps the most notable example is the Ciudad Satelite area, an area originally intended to be, and planned as, a genuine satellite settlement. A few decades later, the urban expansion of Mexico City had swallowed it up. An area which once had many young families now has very few children. The homeowners association of Ciudad Satelite estimates that 75% of the area’s 50,000 inhabitants is now elderly.

The major benefit of the changing population structure would appear to be that, in 2010, there are more wage-earners (and tax payers) for every person of non-working age (assumed for simplicity to be youth under 15, and the elderly aged 60+) than at any previous time. In other words, the total dependency rate is lower than ever before.

Economists argue that this “demographic dividend” should raise GDP, and could offer many significant advantages, such as enabling greater government expenditures on infrastructure or on social services. They point to several countries in East Asia as examples where economic growth spurts went hand-in-hand with a period of demographic dividend.

Despite the claims of economists, I’m not convinced that Mexico will prove to be an equally good example of the benefits of a demographic dividend. In Mexico’s case, the early phase of higher youthful population (and considerable economic growth) was accompanied by a high rate of emigration of working age Mexicans to the USA. Admittedly, emigration has now slowed, or stopped.

As Aaron Terrazas and his co-authors point out in Evolving Demographic and Human-Capital Trends in Mexico and Central America and Their Implications for Regional Migration [pdf file],

“But across Latin America, and in sharp contrast to East Asia, favorable demographic change has failed to translate into economic growth and prosperity. National income per capita has increased only modestly since the start of the demographic dividend, with Mexico outperforming its southern neighbors at comparable points in time. And emigration from the region has continued to grow despite the demographic transitions in Mexico and El Salvador, with the United States absorbing between one-fifth and one-quarter of the region’s annual population growth.”

Whether or not Mexico experiences a demographic dividend, it will not last for ever. In Mexico’s case, it looks set to last only about about 20 years. By 2050, according to current predictions, about 26.4% of the Mexico’s population will be youthful, and 27.7% elderly, while the percentage of working age will have fallen to 45.9%.

Related posts:


Have Mexicans given up on the dream of moving to the USA?

 Updates to Geo-Mexico  Comments Off on Have Mexicans given up on the dream of moving to the USA?
Jul 092012
 

A recent post noted that net migration from Mexico to the USA has dropped to essentially zero. Does this mean that Mexicans no longer have any interest in moving to the USA? The answer to this question is complicated. Obviously, many Mexicans living in Mexico would like to join their family members in the USA if it were legally possible. Others might feel that their career ambitions or the aspirations of their children might be better served by living in the USA. On the other hand, many Mexicans in the USA might feel that their lives would be better if they lived in Mexico.

A face-to-face survey in April 2012 by the Pew Research Center of 1,200 Mexicans in Mexico sheds light on this issue. According to the survey, 56% had a favorable view of the USA, compared to 52% in 2011. Only 34% had an unfavorable view of the USA, down from 41% in 2011. The views varied significantly by age and education. Sixty percent of 18 to 29-year-olds had a positive view compared to only half of those over age 50. Fully 66% of those with a post-secondary education had a favorable view compared to less than half (48%) of those with less education.

Over half (53%) think that Mexicans who move to the USA have a better life, up sharply from 44% in 2011. This suggests that there is still considerable interest in migration. Only 14% indicated they had a worse life, down from 22% a year earlier. However, 61% said they would not move to the USA if they had the means and opportunity. On the other hand, 37% said they would move to the USA and of these 19% indicated they would move even without legal documentation. Not surprisingly, younger Mexicans and those with more education were more interested in moving to the USA.

The survey data indicate that when/if US unemployment declines and there are again ample job opportunities in the USA, many Mexicans may migrate legally or illegally to fill those jobs. Of course, employment opportunities in Mexico will be a very important factor affecting decisions about migration. While the Mexican economy has recovered from the severe recession far better than the USA, still 62% of surveyed Mexicans described the economy as “bad”, down from 75% in 2010 and 68% in 2011. But Mexicans remain optimistic, 51% say the economy will improve in the next year compared to 32% who think it will remain the same, and only 16% who believe it will be worse. The Mexicans more willing to migrate, those with higher educations and incomes, are more optimistic about Mexico’s economic future. If the gap between US and Mexican economic opportunities continues to shrink in the decades ahead, we can expect Mexicans to become less interested in moving to the USA.

Related posts:

Mexico’s position among the world’s largest economies: 1900 to 2008

 Other  Comments Off on Mexico’s position among the world’s largest economies: 1900 to 2008
Jul 072012
 

Comparing the historical sizes of national economies is extremely challenging. Fortunately, Gapminder has attempted to do this by compiling GDP data for all countries in the world for the period since 1800. (For details, see here and here.) Gapminder’s approach relies on first obtaining for each country historical population size and Gross Domestic Product per capita (GDPpc) and then multiplying these to obtain the GDP. Gapminder relies on quantitative and qualitative data from hundreds of official and unofficial documents and a number of carefully documented assumptions.

Mexico’s total GDP has grown almost 60-fold since 1900 in inflation-adjusted constant 2005 dollars based on Purchasing Power Parity, which measures total goods and services produced by an economy independent of exchange rates. Growth started rather slowly, but accelerated very rapidly at mid-century. From 1940 to 1980, Mexico’s economy almost doubled each decade, moving up from $49 billion in 1940 to $637 billion in 1980, averaging about 6.6% per year. Of course, Mexico’s population was also growing rapidly during those four decades. Growth slowed to 2.0% per year in the 1980s but jumped up to 3.4% in the 1990s. From 2000 to 2008, growth slowed to 2.1% per year, partially as a result of the severe recession in the USA. Mexico’s economy is expected to grow significantly faster in this decade.

Growth of major world economies, 1900 to 2008 (Gapminder data)

(GDP in billions of constant 2005 US dollars based on Purchasing Power Parity)

Country19001930195019802008Growth/yr, 1900-2008
Brazil10381069371,8584.9%
Canada23731485771,2113.8%
China3214972169178,8623.1%
France1672672971,0951,8752.3%
Germany2554064161,7342,7012.2%
Indianana2085732,951na
Indonesia2655562288373.3%
Italy721492109151,6142.9%
Japan771652222,1603,9853.7%
MEXICO2336946371,3343.8%
Russianana375na2,089na
South Korea712161651,1774.9%
UK2403514901,0252,0042.0%
USA5061,1562,4146,33912,9603.1%

In 1900, Mexico’s total GDP of $23.3 billion was just ahead of Canada and over twice that of Brazil. However it was behind Indonesia and less than 5% of the USA’s world leading GDP. The Mexican economy was less than one tenth that of Germany and the UK, a seventh that of France and less than a third that of Japan and Italy. The table shows GDP levels for some of the world’s largest economies from 1900 to 2008.

The Mexican GDP expanded by 1.5% per year from 1900 to 1930 despite stagnation during the Mexican Revolution of 1910 to 1920. While this growth rate was better than UK, and tied with China, it was slower than the other countries in the table which expanded rapidly at the start of the 20thcentury. Brazil spurted ahead at 4.4% per year, edging past Mexico as Latin America’s largest economy. Canada expanded by 3.9% per year and doubled Mexico’s GDP. The USA grew by 2.8% per year becoming the first trillion dollar economy by 1923. France and Germany grew at about 1.6% per year, while Japan, Indonesia and Italy expanded by about 2.5% to 2.6%.

From 1930 to 1950, Mexico grew rapidly to $94 billion at a very impressive 4.9% per year, faster than all the other countries except Brazil at 5.3% per year. The USA (up 3.8% per year) and Canada (up 3.6%) also expanded rapidly, while the UK, Italy and Japan grew much slower, in the 1.5% to 1.7% range. The other countries struggled at rates around 0.5% or less. China’s GDP declined by a mind-boggling 4.1% per year during the 20 years from $497 billion down to $216 billion, more than a third less than what it had been in 1820! China’s economy seriously contracted over a 130 year period. The Great Depression hurt most economies; however World War II allies Japan (up 5.8% per year) and Germany (up 3.9%) grew relatively rapidly during the 1930s.

The 1940s and World War II had very dramatic impacts on the major economies. During the decade, Mexico’s GDP led the field with very impressive growth at 6.7% per year, closely followed by Brazil at 6.2%, USA at 5.2% and Canada at 5.0%. Wartime production was a major stimulus to these economies. On the negative side, several countries experienced dramatic war-related loses. China was at war throughout the decade and its economy declined by an incredible 7.0% per year during the 1940s, Germany was down by 3.5%, Japan by 2.6%, South Korea by 2.7% and Indonesia by 2.5%. Compounding these annual changes demonstrates their real significance. Mexico’s GDP almost doubled from $49 billion in 1940 to $94 billion in 1950, while China’s GDP dropped more than half from $447 billion in 1940 to $216 billion in 1950. By 1950, Mexico’s GDP was nearly half that of China and Japan, 1.7 times that of Indonesia and over six times that of South Korea. These four Asian countries would grow very rapidly during the “Asian Miracle” of the second half of the 20th century.

Mexico continued its dramatic growth expanding by 6.6% per year from 1950 to 1980. This was the “Mexican Miracle” which actually started in the 1940s. By 1980, Mexico’s GDP reached $637 billion, surpassing Canada and India; it was above one tenth of the USA’s GDP for the first time in over 100 years. All other economies also grew very rapidly during this thirty year boom period. Japan led the way with 7.9% per year, followed by Brazil at 7.5% per year. China finally broke from its 130 year slump growing at 4.9% per year; in 1956 it finally regained the GDP level it had in 1820. In 1980 Mexico’s GDP was about 70% that of China compared to only 7% in 1930 and 2% in 1820.

From 1980 to 2008, Mexico’s growth slowed a bit but still managed a very respectable increase of 2.7% per year which doubled its GDP from $637 billion to $1.334 trillion. This growth rate was better than that of Japan and all other large western economies (tied with Canada). But it significantly lagged behind four large Asian economies: China (up 8.4% per year), India (up 6.0%), South Korea (up 7.3%) and Indonesia (up 4.8%). China’s GDP increased almost ten-fold from 1980 to 2008. In 1980 India’s GDP was less than that of Mexico, but by 2008 it was over twice as large. Mexico’s GDP in 2008 of $1.3 trillion puts it in 11thplace, behind Italy and just ahead of Spain, Canada and South Korea.

Reviewing the entire 108-year period from 1900 to 2008 reveals the dramatically changes that can occur. Some Asian countries, especially China, really struggled for decades early in the century and then expanded extremely rapidly in recent decades. Compared to the other countries, Mexico did extremely well increasing at an average of 3.8% per year from $23 billion in 1900 to $1.3 trillion in 2008, a 57-fold increase. Brazil and Korea did considerably better, averaging 4.9% per year for 180-fold increases. Even the slowest growth country, the UK, grew by a respectable 2.0% per year for over an eight-fold increase since 1900. All major economies did well making the 20thcentury clearly the best century by far in terms of economic growth. The total GDP of 12 countries (Brazil, Canada, China, France, Germany, Indonesia, Italy, Japan, Mexico, South Korea, UK and USA)in the table with available data grew by 2.0% per year from 1900 to 1950 compared to a very impressive 3.8% per year from 1950 to 2008. The second half of the century was much better than the first; this indicates that economic growth is accelerating and accelerating fast. Will this continue in the decades ahead?


Mexico’s GDP and position among the world’s largest economies, 1800 to 1900

 Other  Comments Off on Mexico’s GDP and position among the world’s largest economies, 1800 to 1900
Jun 302012
 

Comparing the historical sizes of national economies is extremely challenging. This post relies on data from Gapminder which has attempted to do this for all the countries in the world for the period since 1800. Gapminder’s approach relies on first obtaining for each country historical population size and Gross Domestic Product per capita (GDPpc; for more details, see Standard of living in Mexico since 1800: some international comparisons) and then multiplying these to obtain the GDP. To obtain historical measures of population and GDPpc, Gapminder relies on quantitative and qualitative data from hundreds of official and unofficial documents and a number of carefully documented assumptions. In some cases they admit that some of their numbers for years before 1900 are essentially well-educated “guesstimates”. [Full details are given in the pdf file “Documentation for GDP per capita by purchasing power parities“.]

Though the Gapminder data have limitations, they are about the best source for comparing the GDP growth of Mexico since 1800 with that of other large economies. The Gapminder GDPpc data are adjusted for inflation by using constant 2005 US dollars. They are also based on Purchasing Power Parity (PPP) which measures total goods and services produced by an economy independent of exchange rates.

During the 19th century Mexico’s total GDP grew at a relatively unimpressive 1.3% per year, which was only about 0.5% above population growth. In 1800, Mexico’s estimated GDP was just over $6 billion, ranking it second in the Americas. Though this was almost nine times the GDP of Canada, and 3.6 times that of Brazil, it was less than that of Nigeria and half that of the USA. China had by far the largest GDP in 1800 at about $290 billion, more than three times the GDP of second place India, over seven times that of Japan and the large European countries (France, Germany and the UK) and over 20 times that of the USA. The table below shows the estimated GDP levels from 1800 to 1900 for some of the world’s current largest economies.

Estimated total GDP of large economies, 1800 to 1900

(GDP in billions of constant 2005 US dollars based on Purchasing Power Parity)

Country1800182018701900Growth/yr, 1800-1900
Brazil1.72.47.010.31.8%
Canada0.71.19.323.13.6%
China286.9328.8279.1320.90.1%
France38.447.1113.5167.31.5%
Germany36.048.5113.2254.72.0%
India91.098.2118.8nana
Indonesia8.39.316.026.31.2%
Italy23.629.344.671.61.1%
Japan31.133.639.676.60.9%
MEXICO6.17.39.123.31.3%
Russia25.626.2nanana
UK34.945.4151.3240.12.0%
USA12.720.1261.3506.03.8%

From 1800 to 1820, just before gaining independence, the Mexican economy grew to $7.3 billion at a sluggish rate of about 0.9% per year. In contrast, Canada and the USA expanded at around 2.3% per year while Brazil’s GDP went up about 1.9% per year. Germany, France, UK and Italy grew at roughly 1.0% to 1.5% per year. The major Asian countries–China, India, Japan and Indonesia–only managed 0.4% to 0.7% per year. The Russian economy essentially stagnated during the 20 year period. China maintained the top position with over three times the GDP of India and over six times those of the large European economies.

By 1870, Mexico’s GDP had inched up over $9 billion growing rather slowly at just over 0.4% per year since 1820; this was slower than the population growth rate. While Mexico’s growth rate was better than the three biggest Asian economies, it severely lagged behind its northern neighbors which grew very rapidly based on industrialization and immigration. Canada’s economy expanded by an impressive 4.4% per year and edged past Mexico. The USA did almost as well at 4.2% per year to move into second place behind China, which declined by a surprising 0.3% per year over the fifty year period. (In China both GDPpc and population declined from 1820 to 1870.)

Brazil grew by a solid 2.1% per year and closed the gap with Mexico. The three largest European economies were also industrializing and grew by roughly 1.7% to 2.0% per year, but they were still overtaken by the USA. While Indonesia’s GDP expanded by about 1.1% per year, growth rates for Japan and India were less than 0.4% per year.

From 1870 to 1900, under the Porifiro Diaz regime, Mexico’s economy grew rapidly at about 3.2% per year up to $23.3 billion. This put Mexico just ahead of Canada which grew slightly more slowly at roughly 3.1% per year. Mexico’s estimated GDP in 1900 was just behind that of Indonesia but over twice that of Brazil which slowed to 1.3% per year. The USA sped ahead at 3.9%. In the early 1880s it became the world’s largest economy by overtaking China which grew slowly at less than 0.5% per year. In 1900 China’s estimated GDP was actually less than it had been 80 years earlier in 1820. By 1900 the USA’s estimated GDP was over $500 billion, about 22 times that of Mexico. Germany grew at an impressive 2.7% per year becoming Europe’s largest economy by moving past the UK which grew at 2.2%, about the same rate as Japan. Growth in France and Italy was significantly slower.

During the full 19th century, Mexico almost quadrupled its GDP but its overall economic performance was fair at best. Its growth rate of just over 1.3% per year was better than the Asian countries which performed poorly during the century. The USA registered a very impressive 3.8% growth per year resulting in a fortyfold GDP increase. Canada was a close second with 3.6% per year and a 34-fold increase. Germany and the UK had seven-fold increases with growth rates near 2.0%, followed by Brazil at 1.8% growth per year. France followed with growth averaging just under1.5% per year. Though these Gapminder GDP levels have some limitations, they do give a pretty good indication of relative historical economic sizes and growth rates.

Mexico’s economic performance was much better in the 20thcentury as was that of all major world countries. A future post will focus on economic growth since 1900.


Ever wondered how ropes are made? A photo essay about Villa Progreso, Querétaro

 Other  Comments Off on Ever wondered how ropes are made? A photo essay about Villa Progreso, Querétaro
Jun 282012
 

This account of the rope-making industry in the small village of Villa Progreso in the state of Querétaro, is based on information collected during numerous student interviews conducted in the village in the 1980s.

Villa Progreso in the 1980s

Preparing to start. Rope-maker starts to twist the strands.

Preparing to start. Rope-maker starts to twist the strands.

Villa Progreso is nestled in the hills at the end of a road, east of the town of Ezequiel Montes. The rocky soil is not very fertile, and water is in short supply, so agricultural production is limited, though maguey plants grow well here, even when neglected. The local maguey plants used to supply the raw material for rope-making, the main “secondary” occupation in the village.

However, as the village’s population increased, and as more and more families became dependent on rope-making, another maguey product, ixtle de henequen (henequen fibers), had to be trucked in as the raw material from other states, in particular from Yucatán and Tamaulipas.

The trucks are either rented by the villagers or supplied by the village “distributors” (who eventually buy the finished ropes from the village). About 40 metric tons of henequen are needed each week to keep the rope-makers supplied.

In the 1980s (all monetary figures are from that time), raw henequen was bought by the distributors for about 50 pesos a kilo, and then resold to the villagers at about 95 pesos a kilo. The distributors are “middle men” who, in the words of one student, “make a lot of money doing nothing” and “live in the largest, most expensive homes in the village.”

Once the villagers have purchased a supply of henequen, they perform the various tasks to turn it into ropes. The first step is to “comb” it to make fine fibers and to clean the henequen.

The fibers are then shaken in the wind to further separate them before being stored in a large sack. The ends of the top fibers are then tied onto three wires (see first photo). These wires are made to spin by a wheel.

This is often an old bicycle wheel. Some villagers turn the wheel themselves as they walk backwards feeding fibers onto the wires, via a rope that is wound over the wheel; others rely on children or family members to turn the wheel.

The rope gets longer... and thicker...

The rope gets longer… and thicker…

As the person carrying the sack walks backwards, they continue to feed the three strands of fiber, gradually creating three fine strands of rope. The spinning process is repeated, using the fine strands as the basis, and the rope can be made as thick as you like by successive spins.

The entire family helps

The entire family helps (note cloth tied as sunshade)

The main output from this system is strands of rope of various thicknesses, used for things such as clothes lines. Short strands of henequen are not wasted, but formed into natural cleaning pads.

The work is done by the entire family. One worker pointed out that “it is better to have a large family as like this all can work for each other”. Any workers who have no family have to hire extra workers and are unlikely to make any profit.

On a good day, one family can produce about 72 ropes, each about 5 meters long, which can be sold for around 1800 pesos. However, it takes about 1 kilo of henequen to make 7 or 8 ropes, so the family only makes about 800 pesos [about 5 dollars at the then exchange rate] a day after they have paid for the “raw” henequen. The average family size, including children, in the village was between 5 and 6 individuals. 800 pesos a day is not much income to support the entire family!

The finished ropes are bought by the distributors, who in turn sell it on to other distributors in other places, and so on. The main markets are Mexico City, where about 90% of these ropes are eventually sold.

The workers in the rope-making industry in Villa Progreso have tried to organize themselves, but with only limited success. For example, three years before the interviews, they had formed a cooperative, but decided to quit the group when they realized that the managers of the cooperative also wanted part of the profits. So, at the time of the interviews, they had returned to working independently without any outside help.

Sales of rope fluctuate with the economy, and also seasonally, with the highest demand during the rainy season, partly because these natural fiber ropes tend to disintegrate more quickly during damp conditions.

The final stage, with finished ropes

The final stage, with finished ropes

As one student concluded, “It is very visible here how the middle men (distributors) take advantage of the cheap labor available and make a large profit by only buying and selling raw materials and by buying and selling finished products. thus, the distributors are getting richer by exploiting the workers and the workers are remaining as poor or getting poorer than before. The workers have been pulled into a situation that they can not easily escape from.”

How have things changed since the 1980s?

Sadly, I haven’t had the chance to return to Villa Progreso since then, but things appear to have changed considerably. Newspaper accounts such as “Artesanos dan nuevo aire al ixtle” (“Artisans give new life to Ixtle”), which appeared in the national daily El Universal in 2008, suggest that the residents of Villa Progreso are now emerging from some very hard times.

The price of natural fiber ropes could not compete with cheaper plastic alternatives and the rope-making industry went into near-terminal decline. Many of the able-bodied young men left to look for work north of the border. A small number (mainly the older inhabitants) remained home and continued to make ropes by hand for the limited market that remained for their products.

Now, though, a new industry has arisen based on the henequen fibers (usually known simply as ixtle). Enterprising villagers have turned their hands to fashioning nativity scenes and decorative items out of ixtle. Isaías Mendoza Guzmán is described in the article as making pieces that are more than two meters tall and take three months to complete, clearly indicating a high level of sophistication in the final product.

Villa Progreso now holds an Ixtle and Nopal Fair (Feria del Ixtle y el Nopal) towards the end of April each year in the La Canoa “ecotourism park”.

Villa Progreso is by no means the only place in Mexico where rope-making is an important activity. Similar rope-making methods are used elsewhere in Mexico. For example, John Pint describes in “Mexican artisans of Lake Cajititlán” how rodeo-quality lariats are made in the village of San Miguel Cuyutlán, near Guadalajara. Demand for these high-end products apparently remains strong.

Photo credit:

All photos in this post are by Tony Burton; all rights reserved.

How to get there:

Villa Progreso is about 10 km east of the town of Ezequiel Montes in Querétaro. From Mexico City, take the Querétaro highway (Hwy 57D) north-west to San Juan del Río. Then take Highway 120 past Tequisquiapan to Ezequiel Montes. Once in the town, turn right for the road to Villa Progreso. Allow 2.0 to 2.5 hours for the drive.

Related posts about the same general area:


Standard of living in Mexico since 1800: some international comparisons

 Other  Comments Off on Standard of living in Mexico since 1800: some international comparisons
Jun 232012
 

Comparing historical standards of living for different countries over long periods of time is extremely challenging. This post relies on data from Gapminder which has attempted to do this for all countries in the world since 1800. Their approach relies on quantitative and qualitative data from hundreds of references and a number of carefully documented assumptions. They obtained input from a very wide range of official and unofficial documents and combined these to come up with their best estimates. In some cases they admit that some of their numbers for years before 1950 are essentially well-educated “guesstimates”. [For more details, see “Documentation for GDP per capita by purchasing power parities” (pdf file).]

Though the Gapminder data have some limitations, they are about the best source for comparing standards of living in Mexico since 1800 with a number of other middle income countries. The measure of standard of living used in this post is the Gapminder indicator of Gross Domestic Product per capita (GDPpc) at constant 2005 US dollars based on Purchasing Power Parity (PPP) which measures total goods and services produced by an economy independent of exchange rates.

The data indicate that Mexico’s GDPpc has grown over eleven-fold since 1800 from over $1,000 to almost $12,000. This increase sounds very impressive but actually represents an average annual increase of under 1.2% per year. The eleven-fold increase demonstrates the power of compounding. The growth has not been constant. During the 19thcentury Mexico’s GDPpc actually decreased slightly up until 1870, but then expanded relatively rapidly under the Porfirio Diaz regime, almost doubling between 1870 and 1900. For the century as a whole it increased an average of about 0.5% per year. The rate of increase more than doubled during the first half of the 20th century to 1.2%. It doubled again to 2.5% during the second half of the 20th century, which included the so-called “Mexican Miracle”, which started in the 1940s. After 2000, as a result of the very severe recession in the USA, Mexico’s growth slowed to 0.6% per year for the period 2000-2011. Growth is expected to increase significantly during the present decade.

Income growth in Mexico since 1800 (Gapminder data) 

(Incomes values are at constant 2005 US dollars based on Purchasing Power Parity)

Country18001900195020002011Growth/yr, 1800-2011
Argentina8724,0116,32310,77114,5951.3%
Brazil5095981,9047,81910,1921.4%
Chile7022,3063,61210,10613,6111.4%
China9868024272,7847,9311.0%
Cuba1,124na4,9585,8249,4691.0%
India5635855881,6072,9720.8%
Indonesia5146046662,6273,9991.0%
Iran7501,3472,8168,26011,6661.3%
South Korea59667070815,69225,2561.8%
MEXICO1,0541,7223,07410,35911,7541.2%
Peru6979963,2895,7058,4201.2%
Russia824nana7,79214,3181.4%
South Africa759na4,7667,3349,2841.2%

The table compares the 1800 to 2011 GDPpc of Mexico with 12 other middle and low income countries. In 1800, Mexico was ahead of all other countries in the table except Cuba. By 1900, Argentina had moved past and its GDPpc was more than double that of Mexico. Argentina’s GDPpc growth rate for the 19thcentury was over three times that of Mexico. Chile also moved ahead of Mexico. On the other hand, Brazil grew very slowly at only about 0.2% per year during the century; it actually declined between 1870 and 2000. By 1900, its GDPpc was about equal to that of India and a third that of Mexico.

In 1800, China’s GDPpc trailed Mexico by only about 6.5%; but declined by about 0.2% per year during the 19thcentury when China’s economy seriously stagnated as a result of opium wars and numerous internal rebellions which took from 20 to 40 million lives. By 1900, China’s GDPpc was less than half that of Mexico. India, South Korea and Indonesia also grew very slowly during the century. Their GDPpcs went from about half that of Mexico to about a third. There was no Asian economic miracle during the 19th century.

By 1950, Mexico trailed Argentina, Chile, Peru, Cuba and South Africa. From 1900 to 1950, the GDPpc of Mexico grew by a respectable 1.2% per year; however Peru and Brazil grew twice as fast. At the other end, the Asian countries did rather poorly. For example, China’s GDPpc declined by an amazing 1.2% per year from 1900 to 1950, when the country suffered from competing warlords, a protracted civil war, and Japanese invasion. By 1950, China’s GDPpc was less than half of what it had been in 1800 and also was behind India and less than a seventh that of Mexico. From 1900 to 1950, India’s GDPpc grew by only 0.01% per year while Indonesia and South Korea did only marginally better. The mid 20thcentury wars were very damaging to the Asian economies.

By 2000, Mexico had almost caught up with Argentina and had surpassed Chile, Peru, Cuba and South Africa. While Mexico’s growth from 1950 to 2000 of about 2.5% per year was very impressive, Brazil grew even faster at 2.9% per year. South Korea’s GDPpc surged ahead by an amazing 6.4% per year during the second half of the 20th century; it increased over twenty-fold from about $700 to over $15,000. China also grew at a very impressive 3.8% per year posting over a six fold increase. These two countries recovered briskly after their numerous wars and kept moving ahead at a rapid clip.

During the years between 2000 and 2011, Mexico had the worst performance of the countries in the table, growing at only 1.6% per year. China grew over eight times faster than Mexico; India and Russia grew almost five times faster. The growth rates of the other Latin American countries in the table – Argentina, Brazil, Chile, Cuba and Peru – were over twice that of Mexico. However, the Mexican economy is closely tied to the USA where GDPpc grew less than half as fast as Mexico. As mentioned previously, Mexico is expected to grow briskly during the rest of this decade.

It is interesting to look over the full 211 year period from 1800 to 2011. Interestingly throughout the whole period the GDPpc of Iran slightly trailed that of Mexico. The gap between these two countries closed a bit during the 211 year period. As a result of its rapid surge in recent decades, South Korea grew the fastest at 1.8% per year; it moved from one of the poorest in 1800 to the richest in the table. Other solid growth rates were posted by Argentina, Brazil, Chile, Iran and Russia. The slowest growth occurred in India, at only 0.8% per year, followed by Indonesia and China at slightly less than 1.0% per year. However, these Asian countries are now growing considerably faster than the other countries in the table. Looking at income growth over the last two hundred years puts the current situation in perspective. It is interesting to speculate on what the next two hundred years will bring, something we will return to in future posts.

Related posts:

Remittances are on the rise

 Updates to Geo-Mexico  Comments Off on Remittances are on the rise
Jun 092012
 

The annual total of remittances sent back to families in Mexico by migrant workers in the USA increased year-on-year to 22.731 billion dollars in 2011, and looks set to rise again this year.

Mexico’s central bank (the Bank of Mexico) recently released figures showing that remittances to Mexico increased in April 2012 by more than 8% compared to the same month a year earlier, bringing the cumulative total for the first four months of this year to 7.4 billion dollars, 6% higher than in the same period in 2011.

These increases in remittance flows come despite increasing evidence that the net flow of migrants leaving Mexico to work in the USA has come to a standstill:  Net migration flow from Mexico to the USA falls close to zero or has possibly reversed.

For more detail about remittances in Mexico, see:


Jun 042012
 

A previous post—How “complex” is the Mexican economy?—discussed The Atlas of Economic Complexity and noted that Mexico’s Economic Complexity Index (ECI) of 1.145 ranked it 20th among 128 countries. ECI indicates a wide range of complex knowledge capabilities related to productive enterprises. Mexico has a very high ECI given its income level; all other countries in the top 20 have significantly higher incomes than Mexico.

According to the Atlas, during the rest of the decade Mexico’s GDP should grow relatively rapidly to catch up with its ECI. Analyses in the Atlas indicate that during the last few decades countries with higher than expected ECIs compared to their income levels experience more rapid economic growth. While this relationship is empirically true, it should be noted that it does not explicitly include other factors thought to be important to economic growth (see Section 4 of the Atlas). Some of these other factors are governance and institutional quality, corruption, political stability, measures of human capital and competitiveness indicators. The Atlas implies that these other factors contribute to and thus are indirectly part of the Economic Complexity Index.

The analysis in the Atlas predicts that Mexico’s annual growth in real per capita GDP will be 3.5% from 2009 to 2020, ranking it 10th in the world in growth rate (see table). (The growth rates for some other countries are given in footnote 1 below.)  Mexico’s annual growth in real per capita GDP is impressive given that its growth was only 0.8% per year for 1999 to 2009, the same as that for the USA. Growth in these two countries was slowed significantly during this period as a result of the very severe recession, the worst since the great depression. This rather slow growth is surprising given that Mexico’s ECI increased from 1998 to 2008 was ranked 30th worldwide. Though the Mexican economy suffered significantly during this period, it continued to develop new productive capabilities and become more complex. This added complexity is expected to generate accelerated economic growth in the current decade.

RankCountry% growth in GDP/person, 1999-2009Expected % growth in GDP/person, 2009-2020, Income/person, 2009Expected income/person, 2020
1China9.64.33,7445,962
2India5.64.31,1921,886
3Thailand3.14.03,8936,023
4Belarus7.94.05,0757,806
5Moldova4.84.01,5162,321
6Zimbabwe449.03.8 - 6.2676?
7Ukraine5.23.72,4683,694
8Bosnia-Herzegovina4.13.64,5256,669
9Panama3.93.67,15510,529
10MEXICO0.83.58,14311,894

The low growth rate of 0.8% per year for 1999 to 2009 represents “real” per capita growth corrected for inflation and population growth. In nominal terms, Mexico’s total GDP growth from 1998 to 2008 was 1.8% per year. It is expected to grow 4.8% per year for 2009 to 2020, which ranks its 22nd in the world, behind numerous poor African countries with rapidly growing populations. Of large or populous world countries, the only ones ranked ahead of Mexico are India (ranked 8th), the Philippines (12th), Egypt (14th), Pakistan (18th) and China (20th).

In summary, the Atlas of Economic Complexity predicts that the Mexican economy will grow very rapidly during the rest of this decade and beyond. Let’s hope that this prediction becomes a reality.

Footnote 1:

For comparison: Indonesia ranked 21st at 3.3%, Pakistan 27th at 3.1%, Guatemala 35th at 3.0%, South Africa 41st at 2.9%, Turkey 43rd at 2.8%, Brazil 48th at 2.7%, Argentina 54th at 2.6%, Russia 59th at 2.6%, USA 91st at 2.0%, Canada 104th at 1.7% and Nigeria 118th at 1.1%.

Source:

Ricardo Hausmann, Cesar Hidalgo, et. al. “The Atlas of Economic Complexity“, The Observatory of Economic Complexity (Harvard HKS/CDI – MIT Media Lab). Retrieved 19 May 2012.

How serious is corruption in Mexico?

 Other  Comments Off on How serious is corruption in Mexico?
May 122012
 

Recent allegations of bribery related to Wal-Mart de México beg two questions:

  • How serious is corruption in Mexico?
  • How does corruption in Mexico compare to that of other countries?

Fortunately for us, these questions have been comprehensively investigated by Transparency International (TI), a global civil society organization dedicated to reducing corruption. TI defines corruption as “abuse of entrusted power for private gain”.

Its recent study, “Corruption Perceptions Index 2011” focuses on “perceptions” because corruption is a hidden activity that is difficult to measure. The Corruption Perceptions Index (CPI) draws on a wide array of surveys and polls of international experts, business opinion surveys and country residents. It is based on 17 data sources from 13 different institutions. The focus is on bribery, kickbacks and embezzlement involving politicians, public officials and civil servants. Anti-corruption efforts are also considered.

Given the difficulties associated with measuring and interpreting corruption, the CPI has received considerable criticism. (For example, see this Wikipedia entry on  Corruption Perceptions Index). Despite this criticism, the CPI provides a viable approach to comparing corruption in various countries.

According to this index, perceived corruption in Mexico has become considerably worse in the past few years. In terms of freedom from corruption, Mexico’s 2011 score of 3.0 ranks it below the middle, in rank #100 out of 182 countries, tied with 11 other countries including Argentina and Indonesia. It is interesting to note that some individual Asian, African, European and Latin American countries are considerably ahead of Mexico (see table), but others are considerably behind.

CountryRankCountryRankCountryRank
New Zealand1South Africa64Argentina100=
Canada10Italy69=Indonesia100=
UK16Ghana69=Egypt112
Chile22Brazil73Guatemala120
USA24China75Nigeria143=
South Korea43Colombia80Russia143=
Saudi Arabia57India95Venezuela172
Turkey61MEXICO100=Somalia182

Within Latin America, Mexico is far better than Venezuela, Haiti and Paraguay. However, it is way behind Chile, Uruguay, Costa Rica and Brazil. As a regional leader, Mexico should do much better in terms of corruption.

Back in 2008, Mexico’s score of 3.6 placed it significantly above the middle. It was then ahead of Brazil, India, China, Saudi Arabia and Turkey; now it trails these five countries. Why Mexico’s score has dropped significantly since 2008 is not exactly clear, but is probably related to the escalation of the drug wars.

Mexico has signed several multilateral anti-corruption agreements, and recently passed a stiff anti-corruption law. However, legal instruments alone will not reduce corruption in Mexico, according to Emilio Godoy in his article Tangled Web of Corruption Debilitates Mexico (IPS, 10 May 2012). What is needed is aggressive government action as well as dramatic cultural changes among public and private sector officials. This will not be easy, given the existing long-established systems based on patronage, nepotism, cronyism and organized crime.

If Mexico is going to continue attracting foreign investment and experience economic and social growth in the years ahead, it will have to do much better with respect to its level of corruption.

The growth and expansion of Wal-Mart in Mexico

 Mexico's geography in the Press, Updates to Geo-Mexico  Comments Off on The growth and expansion of Wal-Mart in Mexico
May 052012
 

Much recent attention in the USA and Mexico has focused on the allegations of bribery related to Wal-Mart de México.  Interestingly, the company has a rather long history in Mexico. It started in 1958 when Jerónimo Arango and his brothers Placido and Manual started a company called Cifra and opened a deep discount store in Mexico City named Aurrera Bolivar. It was inspired by the E.J. Korvette discount store in New York City. The store was an immediate success, helped by sponsorship of the popular TV show, La Pregunta de los $64,000 pesos (“The $64,000 Pesos Question”).

Wal-Mart's expansion across Mexico, 1993-2007

Wal-Mart's expansion across Mexico, 1993-2007. Click map to enlarge

By 1965 Cifra had eight Aurrera stores in the Mexico City area as well as a Superama grocery store and VIPS restaurant. Cifra and Jewel-Osco of Chicago formed a joint venture and by 1970 they opened the first Bodega Aurrera discount warehouse stores and Suburbia department stores. Their first hypermarket, Gran Bazar, followed in 1976. Shares in the company were sold to the public in 1977.   By serving low-income customers, the company managed to survive the financial crisis of 1982.  In fact during the 1980s it increased sales by an average 20% per year reaching US$550 million by 1989.

Rapid growth continued in the 1990s. By 1992 there were 38 Almacenes Aurrera supermarkets, 29 Bodega Aurreras, 34 Superamas, 29 Suburbias (department stores), 59 VIPS, as well as 15 El Portón restaurants. Almost all of these were located in the densely populated Mexico City and surrounding State of Mexico. Phenomenal growth continued in 1992 with 23 new units added. Cifra B shares increased forty-fold in just five years from the start of 1988 through the end of 1992. At that time, Cifra had a sophisticated, state-of-the-art data system for inventory control and monitoring customer preferences.

In 1991 Cifra formed a joint venture with the US firm Wal-Mart (founded in 1962, four years after Cifra). Unlike Cifra, whose early growth was based on an enormous urban area, Wal-Mart USA’s incredible early growth concentrated on rural areas. Initially the joint venture focused on trade and the members’ only Club Aurrera, which was soon renamed Sam’s Club. The first map shows the distribution of Wal-Mart stores in 1993. Expansion of new outlets throughout Mexico was only slightly slowed by the 1994 financial crisis.

By 1995, there were 22 Sam’s Clubs, and 11 Wal-Marts, 35 Almacenes Aurrera, 58 Bodegas Aurrera, 36 Superamas, 33 Suburbias, as well as 114 VIPS restaurants. One of the new Wal-Mart Supercenters was the largest in the world. The signing of NAFTA in 1994 strengthened the joint venture. In 1997 Wal-Mart USA acquired majority interest in Cifra creating Wal-Mart de Mexico or Walmex. The company, which previously had been heavily concentrated in Metro Mexico City, was soon aggressively opening new units in cities throughout the country (see maps).

Recent news reports allege that this aggressive growth may have been facilitated by payments of bribes to expedite construction permits. As of March 2012, Walmex was operating no fewer than 2,106 retail units throughout Mexico. They include 127 Sam’s Clubs, 213 Walmart Supercenters, 94 Suburbias, 385 Bodega Aurreras, 88 Superamas, 358 VIPS and El Portón restaurants, and over 840 Bodega Aurrera Expresses and other small outlets.

Wal-Mart de México is the country’s largest retailer, with sales of over US$24 billion, and largest private-sector employer, with 209,000 employees. These figures make Walmex the dominant player in its sector, well ahead of its Mexican supermarket rivals: Soriana ($8 billion); Comercial Mexicana (Mega, $4.5 billion) and Chedraui ($4.4 billion).

The 2007 map shows how Wal-Mart has now expanded into some areas where the population density is relatively low. The early expansion of Wal-Mart was into areas with high population density, where a single, well-placed store could easily be accessed by a lot of people, and therefore have the potential to be highly profitable. Even with the 2007 distribution, however, there is still a marked north-south divide in access to Wal-Mart, which reflects income disparities in Mexico.

In 2009/10 Walmex acquired Walmart Centroamérica and is now named Wal-Mart de México y Centroamérica, adding 622 retail outlets in Guatemala, El Salvador, Honduras, Nicaragua and Costa Rica, to bring the total number of units it operates (including Mexico) to 2, 728 retail outlets (with sales of about $29 billion) compared to Wal-Mart USA’s 4,468 outlets (with 2011 sales of $447 billion).

Source for maps:  

The maps have been redrawn, based on maps in “Supplier Responses to Wal-Mart’s Invasion of Mexico”  by Leonardo Iacovone, Beata Smarzynska Javorcik, Wolfgang Keller, James R. Tybout. Working Paper 17204  of the National Bureau of Economic Research, Cambridge, MA, USA.

Related posts


How much drugs money is laundered in Mexico each year?

 Other  Comments Off on How much drugs money is laundered in Mexico each year?
Apr 212012
 

Despite this being an obvious question, there is no simple or generally accepted answer! However, a document published last month by Centro de Estudios Sociales y de Opinión Pública de la Cámara de Diputados (CESOP), entitled Lavado de dinero: indicadores y acciones de gobierno binacionales (“Money Laundering: bi-national indicators and government actions”) does offer some clues and estimates.

For example, according to Mexico’s tax authorities (SHCP), the nation’s financial system “gained” at least 10 billion dollars last year from unrecorded, presumably illicit, activities such as drug trafficking. North of the border, the US State Department believes that money laundering in Mexico accounts for between 8 billion and 25 billion dollars a year, while figures as high as 29 billion dollars have been offered in the US Congress.

Financial models developed by Global Financial Integrity and Columbia University in the City of New York suggest that the total “gains” from all forms of illegal activities in the USA are about 196 billion dollars (1.36% of US GDP), and that about 90% of this amount is laundered each year. The same models, applied to Mexico, suggest total crime-related profits of 38 billion dollars (3.6% of Mexico’s GDP), only 10-14 billion dollars of which is laundered into the formal economy.

If the models are to be believed, in the USA, 46% of the total amount laundered derives from drug trafficking, 32% from people trafficking, 15% from pirated goods and 7% from fraud. In Mexico, 41% of laundered money originates from drugs, 33% from people trafficking, 20% from pirated goods and 6% from fraud.

Despite the considerable variation in numbers, most of the figures and calculations fall within, or close to, the range of values (between 2 and 5% of global GDP) that is estimated by the International Monetary Fund to be laundered each year around the world.