Today (June 17) is the UN’s “World Day to Combat Desertification and Drought.”
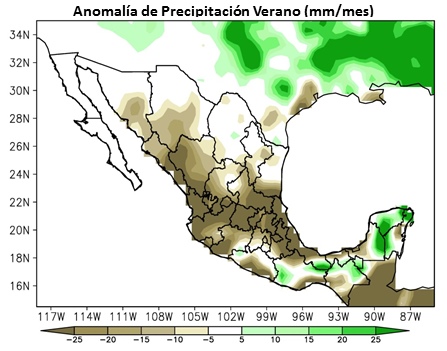
How does Mexico stand right now in relation to drought? Drought currently affects about 40% of the country (see map). Some parts of northern Mexico have been experiencing a severe drought for almost three years. The worst affected states are Chihuahua, Nuevo León, Coahuila, Durango, Zacatecas, Tamaulipas, San Luis Potosí, together with parts of Querétaro, Aguascalientes, Sinaloa and Sonora.
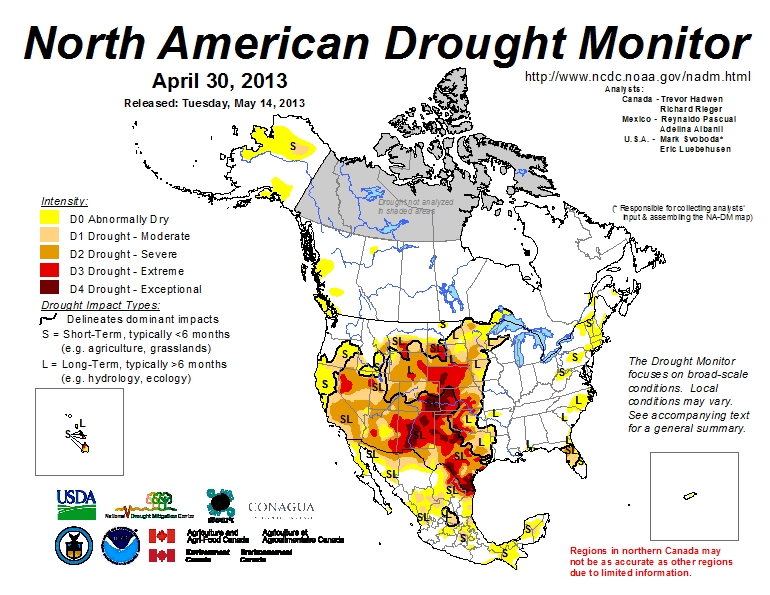
Areas suffering from short-term and long-term drought, April 2013. Click map to enlarge.
Last year’s rains did reduce the area suffering from drought from 55.9% of Mexico to 38.6%, but that figure has risen to well over 40% this year.
In 2012, and earlier this year, many major cities, including Mexico City and Guadalajara, had to enforce water rationing for several months, supplying water to individual households only on certain days each week.
As this year’s rainy season begins in central Mexico, dozens of reservoirs are at critically low levels. Reservoirs in Coahuila average only 10% of their capacity, only slightly better than those in San Luis Potosí (12%). Even the populous state of Jalisco faces problems; its reservoirs are at 27% of capacity.
Things are unlikely to improve any time soon since the current long range forecast for this rainy season is for 30% less precipitation than the long term average.
The drought has already caused significant losses to farmers. Livestock owners in northern Mexico have culled herds and are having to buy in supplies of water to top up their private wells. Rainfall so far in 2013 has been well below long-term averages in central and northern Mexico, which may limit the region’s productivity of rain-fed agriculture (mostly wheat, corn, sorghum and other fodder crops).
Authorities at the three levels of government (federal, state and municipal) in many regions are calling for urgent concerted action to help farmers as well as to ensure supplies of drinking water to towns, cities and rural communities.
In Tamaulipas, at least 60 rural communities are confronting a critical water shortage. Farming representatives argue that while the National Water Commission (Conagua) has guaranteed water supply for urban areas, many rural areas remain vulnerable, and lack both potable water and food support on account of harvest failures due to lack of rain. In Tamaulipas alone, drought has affected 22,000 hectares and killed 800 head of livestock in the past year.
In Nuevo León, citrus farmers fear that their harvest, which begins in October will be 40-50% lower than usual. The state government is supporting a 35-million-dollar support program for farmers which includes supplying water by truck, rehabilitating deep wells and offering subsidies for water that farmers buy direct from private suppliers. The spring harvest in Nuevo León was lost completely, and a “severe drought emergency” has been declared in at least 14 municiapliites (Allende, Cadereyta, Dr. Arroyo, General Terán, Higueras, Juárez, Lampazos, Rayones, Sabinas Hidalgo, Santa Catarina, Villaldama, Hidalgo, García and Mina) allowing them access to federal aid.
Besides loss of livestock and crops, the prolonged drought in Mexico is having many other effects, which include:
Migration – In Durango state, more than 1500 Mennonites have left their homes due to the drought, according to Mennonite leader Enrique Peter Klassen, with some of the migrants headed for neighboring state of Chihuahua and others emigrating to Canada.
Wildfires – The first four months of 2013 was the third worst season for forest fires (more than 7000 were reported) in recent history, after 1996 and 2011. According to the National Forestry Commission (Conafor), wildfires ravaged 170,000 hectares, mostly grassland and wooded pastureland, in the first four months of this year. The states which suffered most were Oaxaca (21,000 ha), Baja California Sur (16,000), Guerrero (13,857) and Jalisco (13,697).
Lake Chapala – In the past two years, the level of Mexico’s largest natural lake, Lake Chapala, has once again fallen to crisis levels. (The lake has a long history of fluctuations in level, discussed in detail in our Geo-Mexico, the geography and dynamics of modern Mexico). The lake currently holds 2.84 million cubic meters of water, about 36% of its capacity. Its level has fallen 1.43 meters since last year’s rainy season, the lake’s most dramatic decline for 20 years. The rainy seasons in 2011 and 2012 raised the lake level by only 24 cm and 50 cm respectively, so unless this year’s rains are exceptionally heavy, the lake will continue to drop.
Previous posts related to drought: