Income inequality before and after tax

 Other  Comments Off on Income inequality before and after tax
Jul 212014
 

In several previous posts, we have explained how the GINI index can be used to quantify the degree of income inequality within a population or country. The higher the GINI index, the more inequality there is. National comparisons of inequality are usually based on working out the GINI index for countries using their residents’ gross (pre-tax) incomes. However, it is also possible to calculate the GINI index for net incomes, incomes after taxes have been taken into account.

This enables economists to assess the impact of tax systems on income distribution (and income inequality) in a country.

The graph below (Figure 2 from Brown et al, 2013) shows pre- and post-tax income GINI coefficients for a selection of countries, including the larger economies in Latin America.

gini-pre-post-taxesIn the European countries, such as Belgium and Sweden, on this chart, the GINI coefficient after tax (dark bars) is much lower than the GINI coefficient before tax (light-colored bars). This means that the taxation system has led to less income inequality than existed prior to taxation. In general terms, this means that the tax system is (overall) a progressive one [i.e. one where taxes take an increasing proportion of income as income rises].

In Latin American economies, a different picture emerges. With the exceptions of Brazil and Costa Rica, the GINI coefficients after taxes are taken into account are actually higher than the GINI coefficients before tax, meaning that income inequalities have become greater as a result of the tax system. In general terms, these tax systems are regressive [where taxes take a decreasing proportion of income as income rises].

In Brazil and Costa Rica, the levels of income inequality remain unchanged after taxation is taken into account.

Clearly, if reducing income inequality is a priority for Latin America, then something has to change. Whether a nation prefers a tax system that is regressive or progressive is a question of political beliefs and policy, as well as a question of economics.

It should be noted that the chart is based on calculations using data from 2012 or earlier. It will be interesting to see how Mexico’s recent major fiscal reforms impact its GINI coefficient in the coming years. Will the recent reforms lead to a more equitable situation and reduce the GINI coefficient, or will they foment greater inequality of income, making the rich richer and the poor poorer?

Note:

The exact methodology used to derive the post-tax GINI coefficient is not clear in the original article. In particular, it is unclear whether or not the after-tax income in the chart includes the large number of Mexican workers in the informal sector who generally do not pay any income or payroll tax.

Source of image:

“Towards financial geographies of the unbanked: international financial markets, ‘bancarization’ and access to financial services in Latin America” by Ed Brown, Francisco Castañeda, Jonathon Cloke and Peter Taylor, in The Geographical Journal, vol 179-3, September 2013, 198-210.

Related posts:

The 10 richest Mexicans in 2014

 Mexico's geography in the Press  Comments Off on The 10 richest Mexicans in 2014
May 012014
 

Carlos Slim Helú , director of Grupo Carso, continues to head the list of the 10 richest Mexicans, despite his fortune declining in 2013 due to the falling value of his holdings in Frisco mining company and América Móvil. Slim Helú was overtaken as the world’s richest person in 2013 by Bill Gates.

According to Forbes magazine, between them, these ten Mexicans have a fortune of 132.9 billion dollars, equivalent to 11% of Mexico’s GDP.

The top 10 are:

  1. Carlos Slim,  72 billion dollars
  2. Germán Larrea, mining, 14.7 billion dollars.
  3. Alberto Bailleres, mining, 12.4 billion dollars.
  4. Ricardo Salinas Pliego, Grupo Salinas (TV Azteca, Elektra, Banco Azteca) 8.3 billion dollars.
  5. Eva Gonda de Rivera, Coca Cola-Femsa shareholder, 6.4 billion dollars.
  6. María Asunción Arumburuzabala, former president of Grupo Modelo, 5.2 billion dollars.
  7. Antonio del Valle Ruiz, Mexichem, Pochteca y Banco Ve por Más, 5.0 billion dollars.
  8. Jerónimo Arango, whose family founded Aurrerá, 4.2 billion dollars.
  9. Emilio Azcárraga Jean, Televisa, 2.6 billion dollars.
  10. David Peñaloza Sandoval, construction firm Triturados Basálticos (Tribasa), 2.1 billion dollars.

Related posts:

May 172013
 

Each year the United National Development Program (UNDP) publishes Human Development Index (HDI) scores and ranks for all countries with available data. The 2013 report, which is based on 2012 data, was just published. (Summary HDI 2013 Report: Rise of the South: Human Progress in a Diverse World)

The index takes account of three key development indicators:

  • Life expectancy at birth,
  • Literacy and school enrollment,
  • Gross National Income (GNI) per person (on a Purchasing Power Parity basis, which uses the total amount of goods and services produced in an economy, independent of exchange rates).

The HDI theoretically varies from 1.0 for the highest and 0.0 for the lowest. In the 2013 report, Norway is highest with a score of 0.955 while Congo and Niger are tied at rank 186 for lowest with scores of 0.304.

hdi-report-2013The latest report identifies Mexico along with 17 other countries that have made outstanding progress since 1990. This group of 18 includes none of the traditional industrialized countries. Those at the top of the progress list include South Korea, Chile, Mexico and Malaysia followed by such major countries as Brazil, Turkey, Thailand, China, Indonesia, India and Bangladesh. The HDI scores of all the world’s countries have improved significantly in the last 30 years; but the scores of non-western countries have increased spectacularly over this period.

While HDI scores receive considerable attention, the UNDP’s Inequality-Adjusted HDI or IHDI is a better overall measure because it is far less skewed by the extremely wealthy whose very high incomes push up the GNI per person values but do not adequately represent the development of the society as a whole. For example, the USA ranks third in HDI with a score of 0.937, due in part to the extreme wealth of its highest 1%. On the IHDI scale, the USA scores only 0.821 and ranks 16th.

Mexico’s HDI score is 0.775, but its IHDI score is of 0.593 is much lower because of the great inequality between the rich and poor in Mexico. In terms of IHDI, Mexico ranks 55th. This places Mexico well behind Chile (41st, 0.664), Argentina (43rd, 0.653) and Russia. (2012 data are not available for Russia, but 2011 data places it well ahead of Mexico.) On the other hand, Mexico’s IHDI score is ahead of Peru (62nd, 0.561), Turkey (63rd, 0.560), China (67th, 0.543), Brazil (70th, 0.531), Indonesia (79th, 0.514) and Egypt (0.503). Major countries that seriously trail this group include: India (91st, 0.392), Bangladesh (95th, 0.374), Pakistan (98th, 0.356), Kenya (102nd, 0.344), Nigeria (119th, 0.276) and Ethiopia (121st, 0.269).

The main conclusion is that the overall quality of life continues to improve rapidly in Mexico as well as in many other so-called developing countries. Current trends suggest these improvements will continue in the years ahead. The Congo, ranked 134, is last with a score of 0.172. IHDI scores are not available for many countries because they lack appropriate income distribution data.

Related posts:

The world’s richest man is one of 15 Mexican billionaires on 2013 Forbes list

 Updates to Geo-Mexico  Comments Off on The world’s richest man is one of 15 Mexican billionaires on 2013 Forbes list
Mar 072013
 

The 2013 Forbes list of the world’s billionaires shows that the world’s 1,426 billionaires (an all-time high) share a record net worth of $5.4 trillion. The four countries with most billionaires are the USA (442), China (122), Russia (110) and Germany (58).

Fifteen Mexican individuals or families make the 2013 list, also a record number. The fifteen super-rich Mexicans are:

World rank / Name / Estimated wealth according to Forbes / Main business interests

#1 Carlos Slim Helú and family, $73.0 billion, making him the richest man in the world. Fixed line telephone provider Telmex, cell phone provider América Móvil, Grupo Carso, Inbursa. [Slim Helú remains the world’s richest man for the fourth consecutive year]

#32 Alberto Bailleres González and family, $18.2 billion. Mining giant Peñoles, department store El Palacio de Hierro and Grupo Profuturo.

#40 Germán Larrea Mota Velasco and family, $16.7 billion. Grupo México –mining for copper and other minerals, railways.

#111 Ricardo Salinas Pliego and family, $9.9 billion. Television company Televisón Azteca, domestic appliance store Elektra, bank Banco Azteca, and cell phone company Iusacell.

#179 Eva Gonda Rivera and family, $6.6 billion, soft drinks (FEMSA)

#248 Maria Asunción Aramburuzabala and family, $5 billion, beer (Grupo Modelo)

#329 Jerónimo Arango and family, 4 billion dollars. Founder of Aurrerá supermarket chain and Grupo Cifra which controlled VIPS and El Portón restaurant chains, Suburbia department stores and tourist developments in Baja California Peninsula and Acapulco

#589 Emilio Azcárraga, $2.5 billion. Television and media conglomerate Televisa, and Nextel cell phones

#613 Rufino Vigil González, $2.4 billion; steel (Industrias CH)

#641 José and Francisco Calderón Rojas (brothers), $2.3 billion, beverages (Coca-Cola Femsa)

#792 Carlos Hank Rhon and family, $1.9 billion, banking

#831 Roberto Hernández, $1.8 billion. Banker, one of main shareholders of Citigroup, and tourist developments in the Yucatán Peninsula

#974 Alfredo Harp Helú and family, $1.5 billion. Shareholder in Citibank, telecommunications firm Avantel

#1031 Max Michel Suberville, $1.4 billion, retail (Coca-Cola Femsa)

#1107 Juan Gallardo Thurlow, $1.3 billion, beverages (organización Cultiba)

Conspicuous by his absence from the list (for the first time in several years) is Joaquín Guzmán Loera (aka “El Chapo”) who Forbes has consistently claimed has a net worth of about $1 billion, but whose assets the magazine now declares “impossible to verify”. Guzmán Loera is Mexico’s most wanted man, head of the Sinaloa drugs cartel, the main supplier of cocaine to the US market.

The combined total wealth of these fifteen individuals is a staggering $148.5 billion (compared to an equivalent total of $125.1 billion in 2012). The 2013 figure is equivalent to more than 6% of Mexico’s GDP.

The average earnings of Mexican workers registered in IMSS (Mexico’s Social Security Institute) in 2012 was about 260 pesos ($20 dollars) a day. The combined wealth of Mexico’s fifteen richest individuals/families is therefore equivalent to the total annual salaries of more than 20 million Mexicans earning this average salary! Note that this equivalence has risen steadily over recent years. For example, in 2010 the combined wealth of Mexican billionaires was equivalent to “only” 14.3 million Mexicans earning the then average salary.

Clearly, there are a handful of extremely wealthy individuals living in Mexico, alongside millions of Mexicans who are living at or below the poverty line. These income disparities have existed for a very long time, and are examined in detail in chapter 14 of Geo-Mexico: the geography and dynamics of modern Mexico. That chapter also analyzes the spatial patterns of wealth in Mexico, and discusses whether the gap between rich and poor has widened or narrowed in recent years.

Chapter 29 discusses Gender inequities in Mexico and  Oportunidades, a poverty reduction program (links are to excerpts from that chapter).

Related articles:

The spatial distribution of Mexico’s GDP

 Other  Comments Off on The spatial distribution of Mexico’s GDP
Dec 062012
 

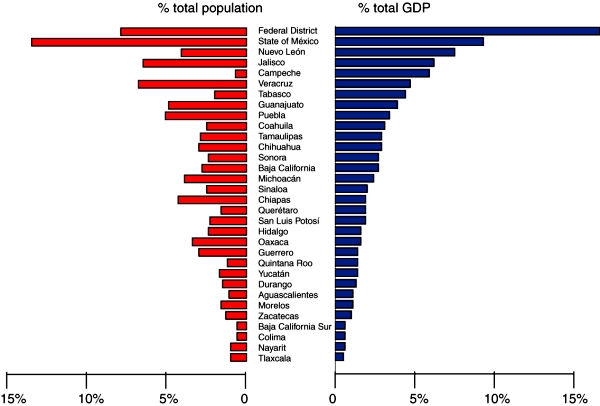
Mexico’s National Statistics Agency recently released a breakdown of GDP by state for 2011. The data allow for an analysis of the spatial distribution of Mexico’s GDP. The graph below shows each state’s contribution to GDP (blue bars) and their share of Mexico’s total population (red bars):

Population & GDP by state, 2011

Population & GDP by state, 2011. Data: INEGI. Credit: Tony Burton / Geo-Mexico; all rights reserved

In general, Mexico’s larger states (in terms of population) contribute more towards national GDP than its smaller states. Equally, even after population is taken into account, it is clear that some states contribute far more than others to Mexico’s GDP. The states of Campeche and  Tabasco both stand out as contributing far more than their fair share towards national GDP; this is on account of their oil and gas reserves. The Federal District, Nuevo León, Quintana Roo and Querétaro also outperform in terms of economic output. On the other hand, Michoacán, Chiapas, Oaxaca and Guerrero all stand out for contributing less to Mexico’s GDP than the size of their population would suggest.

The economic disparities revealed by the data are closely matched by other indicators of economic disparity such as differences in poverty rates and the distribution of the wealthiest households. For more about these topics, start with the related posts listed below.

Related posts:

Aug 302012
 

Veteran blogger Matt Osborne has unearthed a real gem! This 1977 BBC documentary was the tenth episode of The Age of Uncertainty, John Kenneth Galbraith’s history of economic thought. In this episode, Galbraith examines the economics of poverty and inequality.

The section of greatest interest to Geo-Mexico readers is his overview of the changing relationships between land and people in Mexico from precolonial times to the 1970s. [This ten minute segment starts at minute 4:33 of the video].

Galbraith does confuse his Teotihuacanos with his Aztecs, and clearly many things have changed since 1977, but this video is a great and straightforward introduction to the complex issues of land resources and population, suitable as the starting point for many discussions at high school or college level about land clearance, the financing of land improvement, the Green Revolution, population growth and social organization.

Related posts:

The widening income gap in Mexico; the rich earn 26 times more than the poor

 Updates to Geo-Mexico  Comments Off on The widening income gap in Mexico; the rich earn 26 times more than the poor
Dec 202011
 

A recent OECD (Organisation for Economic Cooperation and Development) study – “Divided We Stand: Why Inequality Keeps Rising” – shows that in the last 25 years, the “real” (adjusted for inflation) income of the richest 10% of Mexican households has risen by 1.7%, compared to only 0.8% for the poorest 10% of  households.

The gap between rich and poor for OECD members is at its highest for 30 years. Mexico has the dubious distinction of being the OECD member with the second largest gap in household incomes, exceeded only by Chile. The average income of the richest 10% of households in Mexico is now a staggering 26 times higher than the average income for the poorest 10% of households.

To quote the OECD report: “The income gap has risen even in traditionally egalitarian countries, such as Germany, Denmark and Sweden, from 5 to 1 in the 1980s to 6 to 1 today. The gap is 10 to 1 in Italy, Japan, Korea and the United Kingdom, and higher still, at 14 to 1 in Israel, Turkey and the United States.” The mean value for all OECD members is slightly less than 9.

In 2008, the richest homes in Mexico had an average income of 228,900 pesos (about 20,800 dollars at the then exchange rate), compared to just 8,700 pesos (790 dollars) for the poorest 10% of homes.

Looking at some of the factors likely to have caused the widening gap, the OECD report points out that, “Societal changes – more single people and single-parent households, more partners marrying within the same earnings classes – explained more than 70% of the increase in household earnings inequality. In other OECD countries, this factor was much less important. At the same time, women’s higher employment rates helped reducing household earnings inequality considerably.”

Full 400-page report:

Related posts:


The rapid expansion of electricity provision in Mexico

 Other  Comments Off on The rapid expansion of electricity provision in Mexico
Dec 092011
 

In the past two decades, Mexico has made very impressive progress in providing electricity to its citizens, especially those living in rural areas. The 87.5% of Mexicans that had electricity in 1990 lived mostly in cities and towns. Many of the 95.0% that had electricity in 2000 lived in rural areas. The proportion without electricity was cut way down to only 1.8% by 2010.

During the past decade, virtually all those who obtained electricity for the first time lived in rural areas. The gains in some states were very impressive. The proportion without electricity in Oaxaca went from 13% in 2000 to 5% in 2010. In San Luis Potosí and Chiapas it fell from 12% to only 4%. In Veracruz it dropped from 11% to just 3% and in Tabasco it went from 5.8% to only 1.2%.

Postage stamp commemorating the nationalization of Mexico's electricity industry

The states with the highest proportion without electricity in 2010 were Oaxaca (4.93%), Guerrero (4.38%) and Durango (4.19%). At the other end, were the Federal District (0.08%), Nuevo León (0.30%), Coahuila (0.54%) and Colima (0.59%).

Mexico may never be able to provide electricity to 100% of its citizens, since there are too many people living in very remote areas. In about 8% of municipalities (199 of 2456), more than 10% of the people lack electricity. Of these 199 municipalities, 81 are in Oaxaca, which has 570 municipalities, far more than any other state. Many of the other poorly serviced municipalities are in the relatively poor southern states of Guerrero (15), Veracruz (12), Chiapas (9), Puebla (7) and Michoacán (7).

A surprisingly number of these 199 municipalities are in two northern states: Chihuahua with 16 and Durango with 9. In fact, in 14 Chihuahua municipalities, over 25% of the population lack electricity and in 5 of these over 50% do not have electricity. In Durango the situation is only slightly better: in four municipalities over 25% lack electricity and in one of these 66% do not have electricity. These are among the worst-serviced communities in all of Mexico. In the whole country there are only 9 municipalities where over half the residents do not have electricity and 6 of these 9 are in Chihuahua or Durango. These very poorly-serviced areas are sparsely populated municipalities near the Copper Canyon, occupied mostly by the Tarahumara indigenous group.

Though there are sizable pockets of Mexicans that do have electricity, it is very impressive that, as of 2010, over 98% had access to power.

Source for data:

 CONAPO,Índice de marginación por entidad federativa y municipio. 2010” México D.F., October 2011.

 Related posts:

The GINI index: is inequality in Mexico increasing?

 Updates to Geo-Mexico  Comments Off on The GINI index: is inequality in Mexico increasing?
Oct 012011
 

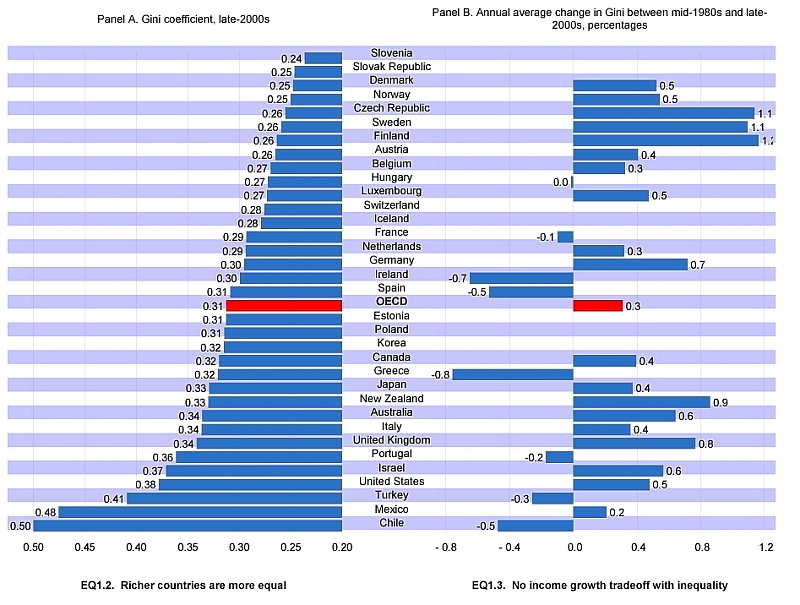
The GINI index, used to quantify the degree of inequality within a population or country (the higher the value, the more inequality), was introduced in a previous post. In this post we report on the change in GINI index for the member countries of the OECD (Organisation for Economic Cooperation and Development). The OECD regularly publishes updated GINI coefficients. Society at a Glance 2011 – OECD Social Indicators includes the following graph which gives a great view of changes in inequality between the mid 1980s and the late 2000s.

GINI coefficients for OECD members
GINI coefficients for OECD members (OECD, 2011) Click image to enlarge

It is no surprise to see that Mexico’s inequality is almost the highest of any OECD member country. However, the right hand side of the graph shows that the increase in inequality in Mexico over the period was actually smaller than the OECD average, and well below the change in the USA, Canada and several European countries. This suggests that Mexico’s economy is becoming increasingly resilient and economic downturns do not necessarily result in raising inequality in Mexico as much as elsewhere.

It will be interesting to see how Mexico’s GINI index changes in coming years. High levels of economic inequality remain one of Mexico’s most-pressing issues, and one which will be central to the upcoming 2012 elections.

Related posts:

Update on Mexico and the UN Millennium Development Goals (MDGs)

 Mexico's geography in the Press, Updates to Geo-Mexico  Comments Off on Update on Mexico and the UN Millennium Development Goals (MDGs)
Sep 222011
 

In a previous post, we looked at Mexico and the UN Millennium Development Goals. This post is the text of a press release issued by the President’s Office in September 2011:

As part of the celebrations of the 50th Anniversary of the United Nations Development Program (UNDP), President Felipe Calderón gave the General Administrator of the Program, Helen Clark, Mexico’s report on the progress achieved in the Millennium Development Goals.

He highlighted the influence of UNDP in Mexico which, throughout its existence, has contributed to the alleviation of poverty and inequality, sustainable human development, the prevention of risks from natural disasters, the implementation of environmental policies and the promotion of democracy.

The main achievements highlighted by the president, regarding the fulfillment of the Millennium Goals, were: achieving universal coverage in primary education, eliminating the education gap between men and women, which eradicated the gender gap in education and increased female empowerment, improvements in the population’s living conditions, through the reduction of mortality and child malnutrition, the sustained increase in life expectancy and specialized care for expectant mothers, the expansion of access to the population’s health services, in which he declared that by the end of this year, universal coverage will be achieved, and the expansion of access to basic services such as safe drinking water, information technologies, communication and decent housing.

The main challenges to be met, said the president, were the alleviation of poverty, improvements in the per capita income and the reduction of the inequality gap. However, he also expressed confidence that they would be fully met in a timely fashion, since he confirmed the fact that the authorities are working continuously to achieve the universalization of pre-school and secondary education, improve the quality of education and improve the Human Development Index through successful programs such as Opportunities and the Popular Insurance Scheme.

The president ended by confirming his commitment to enabling Mexico to fully achieve the values, ideals and agenda set by UN in a timely fashion.

[This post is the text of a press release issued by the President’s Office in September 2011)

The Ethos Foundation’s Multidimensional Poverty Index

 Other  Comments Off on The Ethos Foundation’s Multidimensional Poverty Index
Sep 202011
 

We looked in a previous post at the Multidimensional Poverty Index (MPI), originally presented in an Oxford Poverty & Human Development Initiative (OPHI) working paper, and explained its advantages over earlier poverty measures, especially the relatively crude single-factor approaches like “a dollar a day”.

Earlier this year (2011), the Ethos Foundation, a Mexican NGO, presented its own Ethos 2011 Multidimensional Poverty Index, using the expertise of the authors of the MPI as its starting point.

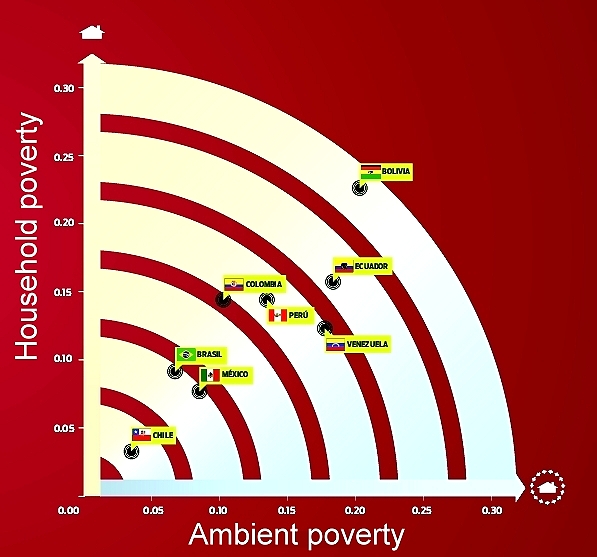
The Ethos Foundation believes that poverty is comprised of both household poverty, an inability to satisfy basic household needs, and by aspects of ambient poverty that make it impossible for people to achieve well-being given the existing political, social and economic conditions. As a result, their index gives a more “Latin American” perspective on poverty.

In applying its Multidimensional Poverty Index to an analysis of poverty in the eight largest economies in Latin America, the Ethos Foundation concluded that Chile is the country with the least poverty, followed by Brazil and Mexico.

Ethos Poverty Index applied to Latin America's largest economies. (Ethos Foundation, 2011)

The graph shows how the 8 countries rated, with the axes of the graph being household poverty and ambient poverty respectively. Overall, Brazil and Mexico are almost equal. While Brazil has less “ambient poverty” than Mexico, Mexico has less “household poverty”. Both countries have a long way to go to reduce poverty levels to match those in Chile.

What factors are included in the Ethos Foundation Poverty Index?

A. Household Poverty:

  1. Income per person (under $60 a day)
  2. Education (head of household uneducated? One child or more aged 7-15 not attending school?)
  3. Provision of drinking water and drainage
  4. Building materials (solid walls? three or more people sleeping in same room?)
  5. Cooking fuel used
  6. Availability of electricity

B. Ambient Poverty (21 variables in 7 categories, but not all equally weighted):

  1. Public Health (life expectancy, infant mortality, public health access)
  2. Institutions (government effectiveness; corruption; political stability)
  3. Economy (unemployment rate; competitiveness; access to micro-loans)
  4. Democracy (civil liberties; political rights and freedom)
  5. Public safety (homicide rate, vehicle theft rate, confidence in police)
  6. Gender (salary parity, educational parity, women in government)
  7. Environment (CO2 emissions/person; species in danger of extinction; rate of deforestation)

The Ethos 2011 Multidimensional Poverty Index is an interesting and valuable addition to the literature on poverty measurement. It is a salutary reminder to geographers that the world is often too complex a place for the same methods of study and quantification to work well everywhere. The great strength of the Ethos Foundation’s index is that it adopts a Latin American viewpoint on poverty, one that is more localized but of far greater relevance to Mexico than previous alternatives.

Related posts:

The measurement of poverty: the Multidimensional Poverty Index (MPI)

 Other  Comments Off on The measurement of poverty: the Multidimensional Poverty Index (MPI)
Sep 132011
 

Measuring poverty sounds easy but is surprisingly difficult. What exactly constitutes poverty? What is “extreme poverty”? Simple poverty measures are often uni-dimensional. For example, many poverty figures quoted in the past were based on the proportion of the population having to survive on less than a dollar a day (later revised upwards to $1.25 a day). Such indices are simple and appealing, but inherently misleading. One of the more serious flaws of such indices (whatever the dollar figure used) is that $30 a month may be sufficient to purchase far more goods and services in some countries than in others. $30 in a European city like Geneva will not go anywhere near as far as $30 in the Mexican city of Oaxaca which in turn will not go anywhere near as far as in a mid-sized Chinese city.

The “Human Poverty Index” (HPI) was a vast improvement, since it combined the proportion of the population facing serious shortfalls in life expectancy, with measures of literacy and of living standards. HPI calculations are based on:

  • the percentage of population expected to die before the age of 40 years
  • the illiteracy rate among adults
  • the standard of living, worked out by combining the percentage of population lacking access to health services, the percentage lacking access to safe water, and the percentage of children under 5 years of age suffering from malnutrition.

Even this multi-criteria approach to defining poverty had its critics, with most arguments centering on which criteria should be included, or on their relative weighting within the index.

Another approach, adopted by Mexico’s National Political and Social Development Commission (Coneval) is (as we saw here) to combine income limits (about three dollars a day in this case) with social indicators in a multidimensional system. People in poverty have incomes below the limit and lack access to at least one of the list of social rights.

In 2010, an alternative multi-dimensional index, the Multidimensional Poverty Index (MPI) was published. This has quickly gained international acceptance and is rapidly becoming the preferred way of measuring poverty. The Multidimensional Poverty Index (MPI) was originally presented in an Oxford  Poverty & Human Development Initiative (OPHI) working paper by Sabina Alkire and Maria Emma Santos: OPHI WORKING PAPER NO. 38: Acute Multidimensional Poverty: A New Index for Developing Countries (July 2010).

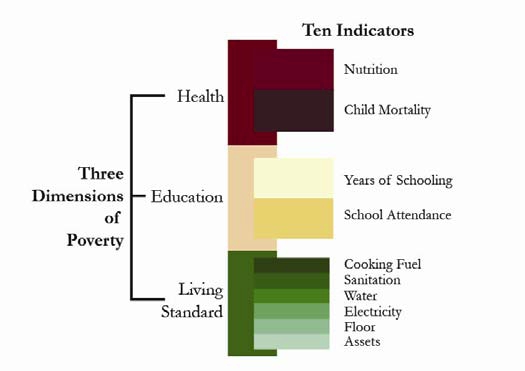
The MPI recognizes that poverty is a very complex phenomenon and seeks to identify the “deprivations that batter a person at the same time.” In the original paper, the index was calculated for 104 countries, with a combined population of 5.2 billion. The index consists of ten indicators corresponding to the three dimensions that are used to calculate the widely-used Human Development Index (HDI): Education, Health and Standard of Living. Each of the three dimensions is given equal weighting in the final index. Each of the indicators within each dimension is also given equal weighting.

Multi-dimensional Poverty Index

Multidimensional Poverty Index (MPI) (From Alkire & Santos, 2010)

Dimension One: Health [weighting 1/3 of total] Indicators:

  • Child Mortality: has any child in the family died?
  • Nutrition: Are any adult or children in the family malnourished?

Dimension Two: Education [weighting 1/3 of total] Indicators:

  • Years of Schooling: Have all household members completed 5 years of schooling?
  • Child Enrollment:  Were any school-aged children out of school in years 1 to 8?

Dimension Three: Standard of Living [weighting 1/3 of total] Indicators:

  • Electricity: Does the household lack electricity?
  • Drinking water: Does the household fail to meet Millennium Development Goal (MDG) targets, or is it more than 30 minutes walk to water
  • Sanitation: Does the home fail to meet MDG targets, or is the toilet shared?
  • Flooring: Is the floor of the home dirt, sand, or dung?
  • Cooking Fuel: Is cooking fueled by wood, charcoal, or dung?
  • Assets: Does the household own only one or none of the following: radio,TV, telephone, bike, motorbike?

From these values, the MPI can be calculated as the product of two numbers:

  • the percentage of people involved and
  • the “average intensity of deprivation” which reflects the number of dimensions in which households are deprived.

Many of these indicators overlap with indicators used to evaluate the Millennium Development Goals (MDGs). This means that analyzing MPI should help countries check their progress towards meeting several Millennium Development Goals (MDGs), while focusing on their most vulnerable people. (For details see the original paper). By looking at the simultaneous deprivations of households, it should help policy makers decide where they need to develop new strategies and where they need to refocus their efforts.

How does Mexico stack up on the Multidimensional Poverty Index (MPI)?

Mexico had an MPI rank of 29 out of the 104 countries surveyed (where the #1 rank means the least poverty), with 10.1% of the population deprived in terms of education, 9.2% deprived in terms of health and 6.7% deprived in terms of living standards.

A cautionary note is needed since any index is only as good as the data used in its calculations, but the MPI does seem to be a far more robust measure of poverty and personal deprivation than any of its predecessors.

Related posts:

Geo-Mexico: the geography and dynamics of modern Mexico is an excellent resource for courses in geography, economics, sociology and development studies, designed to be relevant to both general and academic readers. It provides an up-to-date account of Mexico suitable for students taking initial university or college courses related to geography, economics and Mexican or Latin American studies.  Buy your copy today!

Education professionals are invited to contact us if they would like to request a review copy. In addition, the entire book is searchable via the “Look Inside” feature of amazon.com

Are Mexican females overtaking males in literacy?

 Updates to Geo-Mexico  Comments Off on Are Mexican females overtaking males in literacy?
May 142011
 

For at least the last century, literacy for Mexican males has been significantly higher than that for females. According to the 2010 census 93.7% of Mexican males aged 15 and over were literate compared to only 91.1% of females. Males have higher literacy levels in all 32 Mexican states except for Sinaloa (males – 94.1%, females – 94.7%) and Sonora (males – 96.2% and females – 96.3%). We introduced the spatial aspects of literacy in Mexico in an earlier post:

The greatest gaps between literacy among males and females are in states with relatively low literacy levels (Pearson correlation = 0.89). For example, in Chiapas male literacy is 86.0% while that for females is only 77.5% for a difference of 8.5%. Other states with large gaps are Oaxaca (87.3% – 79.4%, gap of 7.9%), Guerrero (85.4% – 79.8%, gap of 5.6%), and Puebla (91.7% – 86.8%, gap of 4.9%). The data suggest that as literacy levels in states increase, the gap between males and females should decline.

Will the gap between male and female literacy levels decline in the decades ahead? Date from the 2010 census indicates that both illiteracy rates and the gap between males and females are far greater for older Mexicans. For those over age 75, male literacy is 71.2% while that for females is only 62.3% resulting in a gap of 8.9%. The gap is 8.4% for those between 60 and 74 years of age (83.3% versus 74.9%) and 4.4% for the 45 – 59 age group (93.1 versus 88.7%). The gap for those between 30 and 44 years of age is only 1.1% (96.4% versus 95.3%) and for the 15 to 29 age group, males and females are equal at 98.1%.

Does this trend suggest that female literacy will surpass male literacy in the future? The answer to this question appears to be yes. Data from the 2010 census on children between ages six and 15 indicates female literacy (87.32%) is already 1.33% higher than male literacy (85.98%). These levels seem rather low because literacy levels for children below age ten, particularly males, are generally lower. For example, among children age seven, literacy for females is 3.06% higher than that for males (73.91% versus 70.85%). That nearly 30% of seven-year-olds are illiterate suggests a problem; but most of these will become literate by age 15. Among children between age 14 and 15, female literacy is 98.40% compared to 98.09% for males.

The census provides data on the literacy of children for each age between age six and 15 for all 32 Mexican states. Literacy rates for female children are higher than those for males in all 288 observations (9 age groups times 32 states), expect for five (ages 11, 12, 13 & 14 in Chiapas and age 12 in Tlaxcala).

The largest gap between females and males is 4.6% for six-year-olds in Zacatecas (females – 43.51%, males – 38.91%). Other large gaps exist for seven-year-olds in Zacatecas (4.41%), six-year-olds in Querétaro (4.37%), seven-year-olds in Tamaulipas (4.34%), and seven-year-olds in Tabasco (4.33%). These findings are consistent with other evidence indicating that females develop language skills at younger ages than males. The data clearly indicate that female literacy is surpassing male literacy. Perhaps more importantly, both males and females are now approaching universal literacy.

We assume that the literacy gap between female and male children will continue in future decades. After a decade or two, we expect adult literacy rates for females to catch and surpass those for males. On the other hand, this gap will be very small because Mexico is quickly approaching universal literacy. When data become available we will analyze the gap in total years of education between females and males. We expect the situation in Mexico to move slowly towards the pattern in the USA, where females now have more years of education and more university degrees than males.

Literacy rates are, of course, only one of the many aspects of gender inequality in Mexico.

Trends in income distribution in Mexico: are the poor getting poorer?

 Excerpts from Geo-Mexico, Updates to Geo-Mexico  Comments Off on Trends in income distribution in Mexico: are the poor getting poorer?
Feb 032011
 

Many proponents of the North American Free Trade Agreement (NAFTA) which came into effect in 1994 argued that it would stimulate Mexico’s economic development, leading to an increase in employment, and (in due course) higher wages. This would have a beneficial effect for the entire workforce but the effect would be most pronounced among the poorest 20%. It would help reduce the differential between their incomes and those of the middle income earners.

Opponents of NAFTA argued that free trade would have the opposite effect and would lead to a widening gap between the haves and the have-nots.

Which argument is right? Has the gap widened or narrowed?

Research addressing this question reveals the complexity of the issue. Complicating the situation is the economic instability which followed the passage of NAFTA as well as the significant urban–rural and regional inequality that persists in Mexico. Available data suggest that inequality increased during the 1980s and again slightly between 1996 and 1998 but inequality then declined until 2002. This decline appears to have continued. A chart published last year in The Economist (11 September 2010) shows a decline in Mexico’s Gini coefficient (ie a decline in inequality) of almost 1% between 2000 and 2006.

Researchers conclude that the giant gap between rich and poor will not decline naturally as the economy grows, but will require specific policy actions.

The overall impact from the global economic downturn which started in 2008 is not yet clear but past experience suggests that the gap tends to decline during economic hard times. Some economists argue that a trend of a widening gap between rich and poor was already evident in the years prior to NAFTA. If so, this suggests that globalization and Mexico’s support for free trade are not the only factors responsible for the apparently growing disparities of wealth in the country.

Even if the disparities are widening, it does not necessarily mean that the poor are getting poorer. It is perfectly possible that their real incomes (and standards of living) could increase, by say 10%, while those at the top increase by 15%. Both groups would therefore be getting richer, even though the gap between them widened. On the other hand, it is possible that both could be getting poorer, with the gap increasing or declining. Clearly, income data are difficult to analyze and we should be very cautious to avoid making any overly-simplistic statement about the poor getting poorer.

Inequality in wealth in Mexico: the GINI index

 Excerpts from Geo-Mexico  Comments Off on Inequality in wealth in Mexico: the GINI index
Feb 022011
 

Several chapters of Geo-Mexico: the geography and dynamics of modern Mexico look at inequalities in Mexico. The inequalities considered include inequalities related to physical geography (eg water availability), population dynamics (eg fertility rates), gender (eg. female employment), economics (eg GDP/person), development indices (eg HDI) and the distribution of wealth within the country, or within a subset of the country’s residents, such as those who live in a particular state.

Taking the country as a whole, Mexico has a very unequal distribution of wealth:

In 2005, the per person income for the richest 10% of the population in Mexico was $44,035. This figure is over four times the national average, indicating that per person income in Mexico is very unequally distributed. In fact only two countries—Brazil and South Africa—in the top twenty-five economies are more unequal. The average for all twenty-five countries is about three times the national average. The distribution in Japan and Italy is far more equitable; in both countries, the highest 10% get only about twice the national average. [Geo-Mexico, p 89]

If we want a more precise measure of how unevenly distributed the wealth or income is in a country, it is possible to calculate the country’s Gini coefficient. The Gini coefficient, or index, was developed by Italian statistician Corrado Gini :

Without going into all the mathematical details, Gini index values range from 0 (perfect equality) to 100 (extreme inequality with all wealth in the hands of a single individual).The Gini index at a national scale usually falls between 25 and 70. It provides a very useful way to compare income inequalities between countries or to analyze trends in income inequality over time.

In general, the Gini index loosely correlates with development, since most developed countries have lower Gini values (usually below 36) than more developing countries where the values often exceed 40. However, there are many notable exceptions. The USA has a Gini index of 45, higher than might be expected, and Bangladesh and Ethiopia both have relatively low Gini values of 33 and 30 respectively.

Mexico’s Gini index of 48 is high, indicating that inequality remains a real issue. Is Mexico’s inequality of wealth increasing or diminishing? There is little evidence that the GINI index has fallen significantly since the 1990s, though we will return to this question in a future post.

One important thing to note is that in Mexico’s case, its informal sector (not reflected in Gini calculations) may serve to ameliorate the degree of income disparities suggested by the Gini figure taken on its own. Some economists suggest that countries with such high Gini indexes need to double their rates of economic growth before they will succeed in reducing their incidence of poverty. [Geo-Mexico 89-90]

Oct 162010
 

In an earlier post, we looked briefly at Females, males and gender inequality in Mexico.

Gender inequality is unfortunately still alive and well in Mexico. It is often shown through discrimination and human rights violations.

Several women’s empowerment groups aim to change the status quo. Perhaps the most successful to date has been an organization known as Semillas (= seeds). Founded in 1990, Semillas is the shorthand for the NGO Sociedad Mexicana Pro Derechos de la Mujer, A.C. (Mexican Society Pro-Women’s Rights).

In the words of its homepage, Semillas…

“knows that all the different responsibilities and duties that women have as mothers, caretakers, providers, educators, resource generators, politicians, field workers, business owners, social leaders, scholars, artists, etc… make them the fundamental factors of change in their families, communities, and society at large. Semillas is also aware that strengthening Mexican women’s rights builds a more just society, promotes a new culture of equality between women and men, and improves life conditions for generations to come.”

Semillas group of women

Photo credit:Semillas (Sociedad Mexicana Pro Derechos de la Mujer, A.C)

Semillas aims to break the traditional gender inequalities in Mexico through sponsorship of dozens of local initiatives, covering a wide range of development objectives. Since 1990, Semillas have started 237 sustainable development projects, benefiting 650,000 women. Projects are based on the principle of “women helping women”. Semillas funds and supports projects run by women who are already exhibiting leadership qualities in their communities.

For example, one project supports the work of a victim of psychological violence who has spent the last 15 years of her life designing programs to ensure equality of educational opportunity in her home community. This educational equality is not limited to formal schooling, but extends to the sports activities available after-school and at weekends. When our daughter was growing up in Mexico, we learned first-hand in the early 1990s that many smaller, traditional villages in Mexico tend to offer a reasonable variety of sports, such as soccer, only for boys. Rarely is anything equivalent on offer for girls. While the situation is gradually improving (girls’ soccer is becoming one popular option!), there is still a long way to go in many places.

Semillas does not only fund projects concerned with educational equality; other projects focus on health care, female working conditions and legal aid.

The Semillas website has many short articles, images and videos highlighting its work, if you are interested in finding out more about this noteworthy NGO. (It also has a link for donations).

Stop Press! By coincidence, today the Inter Press Service news agency published Four Years On, No Justice for Atenco Women (by Daniela Pastrana). In 2002, Atenco was proposed as the site for a new Mexico City airport, leading to protests by local residents. Eventually, (in April 2008) 11 women brought a case before the Inter-American Commission on Human Rights, involving allegations of torture, sexual violence and illegal deprivation of freedom, all connected to the protest movement. Their case was supported by many NGOs, as well as several winners of the Nobel Peace Prize. Mexico’s Supreme Court ruled earlier this year that the opposition to the new airport was a “legitimate social protest” and ordered the immediate release of those protesters who were still behind bars.

Chapter 29 of Geo-Mexico: the geography and dynamics of modern Mexico is titled “Variations in Quality of Life within Mexico” and discusses many aspects of poverty, including  Gender Inequality. Buy your copy today, or ask your local library to purchase a copy for their collection.

Homicide rates are declining in many Mexican states

 Updates to Geo-Mexico  Comments Off on Homicide rates are declining in many Mexican states
Sep 252010
 

Data from the Mexican National Public Security System (SNSP) indicate that Mexico’s homicide rate has declined by 23% from 37 (homicides per 100,000 population) in 1997 to 29 in 2009. It declined in 20 of Mexico’s 32 states.

The states with the homicide rates below 20 and their change since 1997 are shown below. All of the states listed except two experienced impressive declines since 1997. The two exceptions, Yucatán and Nuevo León, had the lowest homicide rates in the country in 1997. The homicide rates in the majority of these states even declined from 2007 to 2009 when the national homicide rate increased by 20%.

StateHomicide rate per 100,000 population, 2009Change, 1997-2009 (%)
Yucatán11+11
Campeche13–66
Baja California Sur14–59
Veracruz15–39
Zacatecas16–40
Nuevo León16+79
Hidalgo16–39
Federal District16–25
Querétaro17 –57
Colima18–55
Jalisco19–65
México19–63
San Luis Potosí19–11
ALL MEXICO29–23

Most of these states are not heavily affected by Mexico’s drug war violence. While these states have low homicide rates for Mexico, they are not particularly low from an international perspective.  They are about two times the rate in the USA, but about one quarter of those in Colombia.

Believe it or not, homicide rates in Mexico have actually declined since 1997

 Updates to Geo-Mexico  Comments Off on Believe it or not, homicide rates in Mexico have actually declined since 1997
Sep 202010
 

All the recent media attention to drug war violence suggests that homicide rates in Mexico are increasing rapidly. This is undoubtedly true, but only in certain areas. The available data from the Mexican National Public Security System (SNSP) does not uniformly support the contention that homicide rates are on the rise.

SNSP data show that Mexico’s homicide rate has declined by 23% since 1997. It declined for 20 of Mexico’s 32 states.  According to SNSP, the national homicide rate of 37 per 100,000 population declined by 36% to 24 in 2007, before edging up 20% to 29 in 2009, the most recent year for which data available. However, since 2007 the homicide rate has declined in nine states. Clearly, there are enormous differences in homicide rates among Mexico’s states. A future blog will focus on states with low and declining homicide rates.

The increases in some states since 2007 may well be related to drug war violence. The estimated 28,000 drug war deaths reported in the media is significant compared to the 111,000 homicides in Mexico for the four year period 2006–2009.

The states with homicide rates above 40 in 2009 and which have increased since 2006 are shown in the table. Undoubtedly, drug war violence is an important factor in many of these states, particularly Chihuahua, Durango, Sinaloa, Guerrero and Michoacán.

StateHomicide rate per 100,000 population, 2009Increase, 2006–2009 (%)
Durango89865
Chihuahua86177
Sinaloa7540
Guerrero6355
Morelos6046
Michoacán5755
Quintana Roo52124
ALL MEXICO2920

International comparisons are difficult due to differences in definitions and in data collection methods. For example, the fatal shooting of an intruder, death committed in self-defense, or death caused by  a drunk driver may count as a homicide in some countries and not in others. In rough terms, data appear to show that homicide rates in Mexico are about four times those in the USA, but less than half of the rates in Colombia or South Africa.

Maternal health in southern Mexico

 Mexico's geography in the Press  Comments Off on Maternal health in southern Mexico
Jul 282010
 

A short piece in The Economist entitled “Maternal Health in Mexico: A perilous journey” (26 June 2010) highlights some of the reasons why maternal mortality has remained stubbornly high in southern Mexico, despite a marked improvement in recent years. Since 1990, maternal mortality (death related to childbearing) has fallen by 36% in Mexico as a whole.

Maternal mortality remains alarmingly high

Carrying the future; maternal mortality remains alarmingly high. Photo: Tony Burton. All rights reserved. Click to enlarge.

Any average figure for the whole country disguises enormous regional differences. Rates for the richer inhabitants in the more developed regions in Mexico are comparable to rate in the USA or Canada. However, rates in the impoverished southern states such as Chiapas, Oaxaca and Guerrero are up to 70% higher than the national average.

In the words of the Research for Development blog “In 2005 the maternal mortality rate was 63.4 deaths per 100,000 live births. In the state of Guerrero the rate rose to 128 deaths per 100, 000 live births. Both figures are a long way from Mexico’s commitment under the Millennium Development Goals (MDGs) of 22.3.” Click here to see how well Mexico is doing in meeting other MDGs.

One study found that in the year 2000, only 44.8% of women in Chiapas gave birth with a doctor present; 49.4% did so with midwives, and the remaining 5.8% were attended by family members or give birth alone.

As The Economist article emphasizes, indigenous women are only one-third as likely to survive giving birth as non-indigenous women.

Why is this? What are the key factors preventing lower maternal mortality rates?

The Economist singles out:

  • means of transport – lack of a car means a total reliance on public transport. Public transport is poor in many remote areas
  • poor roads – many rural roads are unpaved, and the terrain in much of Mexico means than travel times are often much longer than might be expected
  • the expense of the hospital tests and medical supplies which can save a mother’s life
  • errors in delivery care or hospital procedures – according to The Economist, “40% of urban maternal deaths are caused by using the wrong medicine, by botched surgery or by other forms of malpractice.”
  • reluctance to see a male doctor (for social or cultural reasons)
  • language issues – many indigenous women do not speak Spanish at all well, if at all, and very few doctors have any knowledge of indigenous languages, so communication is often poor

What is needed to reduce maternal mortality rates? Understandably, The Economist focuses its attention on financial or economic solutions. More money is needed, it argues, for “midwifes and contraceptives.” It reports that increased funds are coming from a variety of sources, including the Spanish government, Carlos Slim (the Mexican entrepreneur who is the world’s richest man) and from the Bill and Melinda Gates Foundation. Between them, they have announced plans to spend 150 million dollars “on health care for the poor in Central America and southern Mexico”.

In addition, the article calls for investment in “infrastructure, health and education”, making the claim that investment in these areas would help the south catch up with the rest of the country.

We consider this analysis of possible remedies for the problem to be incomplete. The political will to continue making investments in health care installations and personnel over the long-term requires, in our opinion, a significant shift in attitudes among the wealthier and more influential sectors of Mexican society.

At present most members of the wealthy elite regard indigenous Mexicans as second class citizens.

At the time of the Chiapas uprising in 1994, for example, a subset of well-educated Mexicans called on the government to resolve the problems the nation faced in southern Mexico once and for all by using maximum force to re-establish complete military control over the area. Fortunately, the government of the day did not follow their advice but opted for alternative approaches such as dialogue.

Mexico’s indigenous peoples are rarely shown on TV or in advertisements. Instead, most firms prefer to picture blond, blue-eyed mestizos. Alongside increased financial investment in the south, a massive shift in public perception is required. For everyone’s sake, let us hope that this can be achieved with a minimum of turmoil.

Mexico’s government has to make tough choices about how far the national budget can stretch, and which things should be prioritized. Decisions are often based on political expediency as much as on the nation’s pressing development needs. Indigenous peoples are not well represented in federal government.

At present, the best-trained physicians and nurses aspire to work in the world class medical facilities in Mexico’s major cities. Health care workers in Mexico’s remote areas are often there only to fulfill the social service requirements for their professional qualification; they perform valuable work, but certainly have no long-term commitment to these regions. In the words of a MacArthur Foundation researcher (quoted in “Evaluation of The MacArthur Foundation’s Work in Mexico to Reduce Maternal Mortality, 2002-2008”) , qualified doctors (residents) “see their work as a big favor they do for the community, rather than understanding that indigenous populations in our country also have a right to health.”

We believe that a change in how society perceives indigenous peoples is a fundamental prerequisite for genuine long-term change, particularly in states such as Chiapas and Oaxaca.

Mexico’s indigenous populations, and the disparities in wealth and opportunity they face, are analyzed in chapters 10 and 29 of Geo-Mexico: the geography and dynamics of modern Mexico. Ask your local or university library to buy a copy today!!

The disparities in Mexico between indigenous peoples and the remainder of the population

 Excerpts from Geo-Mexico  Comments Off on The disparities in Mexico between indigenous peoples and the remainder of the population
Apr 292010
 

Most of Mexico’s indigenous population lives in small, isolated rural localities with under 500 inhabitants. These communities are very disadvantaged compared with other Mexican communities. About one-third of the nation’s 2442 municipalities are indigenous. However, almost half of all the municipalities defined by the National Statistics Institute (INEGI) as “highly marginalized” are indigenous, as are a whopping 82% of the “very highly marginalized” municipalities.

The incidence of extreme poverty is much higher in indigenous municipalities than in non-indigenous municipalities. Indigenous villages are among the nation’s poorest rural communities. Indigenous language speakers trail behind other Mexicans in virtually every socioeconomic indicator. About 33% are illiterate, compared to the national rate of only 9.5%. Most leave school prematurely to help their families earn a living.

Indigenous females get a year’s less schooling than indigenous males. They suffer from poor nutrition and their fertility rate is 40% higher than the national average, but 5% of indigenous infants die before reaching their first birthday. About 85% of indigenous household are below the Mexican poverty line and over half live in “extreme poverty”. Over one third of houses lack electricity and over half lack piped water. There is no question. Indigenous peoples have a far lower standard of living than other Mexicans.

Despite their extreme poverty, indigenous communities have managed to remain remarkably stable while collectively pursuing their relatively well organized survival strategies. Their belief systems and rich knowledge of nature remain largely intact. Over 90% of indigenous peoples own their homes and farm plots.

Mexico’s indigenous groups are the subject of chapter 10 of of Geo-Mexico: the geography and dynamics of modern Mexico; variations in the quality of life within Mexico are analyzed in chapter 29.

An overview of Mexico’s indigenous peoples

 Other  Comments Off on An overview of Mexico’s indigenous peoples
Apr 162010
 

How many indigenous people are there?

According to INEGI figures, about six million Mexicans over the age of five speak at least one indigenous language. Another three million Mexicans consider themselves indigenous but no longer speak any indigenous language.

How many indigenous towns or villages exist?

INEGI figures show that, in over 13,000 localities, more than 70% of the population speaks an indigenous language. Most of these localities are small rural settlements with fewer than 500 inhabitants. These settlements are often highly marginalized, with high levels of poverty.

Speaking an Indian language is associated with disadvantage

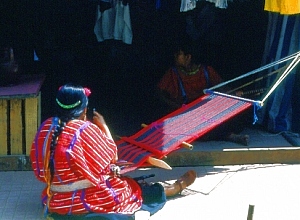
Oaxacan weaver. Photo: Tony Burton. All rights reserved

Speakers of indigenous languages fall way below the Mexican average on almost any socio-economic indicator. For instance, almost 33% of indigenous-speakers are illiterate, compared to a national rate of 9.5%. Females are particularly disadvantaged – indigenous females stay in school a full year less than their male counterparts, and for only half the time that the average non-indigenous female does. Even today, almost 5% of indigenous infants die before reaching their first birthday. A third of indigenous houses lack electricity; more than half do not have piped water.

Where do the indigenous people live?

More than 92% of the indigenous population lives in central and southern Mexico. With the notable exception of the 50,000+ Tarahumara Indians who live in the remote Copper Canyon region of Chihuahua, other indigenous groups in northern Mexico have relatively small populations.

The reason is largely historical. The major pre-Columbian civilizations in Mexico—Maya, Aztec, Zapotec, etc—developed in central or southern Mexico. The north always had fewer indigenous people. The disparity in numbers between north and south was heightened in early colonial times, as Spain expanded its territorial interests in New Spain along two major axes of economic development: the Mexico City-Veracruz corridor (the major trade route linking the capital to the port and Europe) and the Mexico City-Zacatecas corridor (the major route linking the capital to valuable agricultural and mining areas). It is no coincidence that indigenous languages and customs first died out along these corridors, as the indigenous people were forced to become assimilated into the developing dominant culture.

Indigenous peoples and languages did much better in the south. At last count, Oaxaca has over one million indigenous speakers representing more than a third of the state’s population. The state’s largest indigenous linguistic groups are the Zapotec, Mixtec, Mazatec, Chinantec, and Mixe. Oaxaca’s ethnic diversity is celebrated in the annual Guelaguetza festival, normally held in July.

Chiapas has almost as many indigenous speakers as Oaxaca. The largest indigenous groups in Chiapas are the Tzotzil, Tzeltal and Chol. One numerically-small Chiapas group is the Mam. Its recent history is an interesting study in how an indigenous group can re-invent itself in order to survive in the modern world.

The population figures quoted in this post are from INEGI’s Census and II Conteo de Población y Vivienda 2005 (INEGI, Aguascalientes).

Click here for original article on MexConnect

Chapter 10 of Geo-Mexico: the geography and dynamics of modern Mexico is devoted to Mexico’s indigenous peoples. Many other chapters of Geo-Mexico include significant discussion of the characteristics of, and development issues facing, Mexico’s many indigenous peoples.

The geography of cholera in Mexico

 Other  Comments Off on The geography of cholera in Mexico
Feb 282010
 

When Mexico braced herself for the imminent arrival of cholera from South America in 1991, many people believed that the disease had never previously been known here. However, during the 19th century, there were several outbreaks, including the epidemic of 1833 in which more than 3,000 people died in the city of Guadalajara alone.

A meeting of public health officials in January 1833 stressed the need for public areas to be regularly cleaned. This meeting called for the construction of six carts, to be used each night for removing the excrement left on street corners, since not all the houses had “accesorios” (toilets). This proposal reveals the unsanitary conditions which prevailed in Guadalajara at that time.

The epidemic struck in July, and peaked in August, when more than 200 people died of the disease each day. Sporadic cases dragged on into early 1834.

The shout of “Aguas!” (“Waters!”) as a warning of imminent danger, still used in many contexts today, actually dates back to when there was no sewage collection or provision. It was used to warn passers-by in the street below that the contents of “night buckets” were about to be emptied onto their heads…

In 1849 the city of Guadalajara feared a second epidemic. The authorities published a list of precautions that they considered essential, and a list of the “curative methods for Asiatic cholera.” At that time, the only major hospital in the city was the Hospital Belén. Its rival, the San Juan de Díos hospital, was “small and poorly constructed, insufficiently clean, and careless in waste disposal.”

The situation was made worse because  the  San Juan De Díos River was little more than an open sewer running through the center of the city. This river is now entirely enclosed and runs directly beneath the major avenue of “Calzada Independencia.”

Only two methods of sewage disposal were in use in 1850. Some houses took their sewage to the nearest street corner, where it was collected by the nightly cart for subsequent removal from the city. Other (higher class) houses deposited their sewage in open holes in the ground which allowed the wastes to separate, with the liquids permeating into the subsoil and the solids accumulating. Not exactly ideal in terms of public health!

The town council called for the construction of more of these latrines and for the activities of the night carts to be reduced.

The council also advocated increasing the air circulation in the city and simultaneously fumigating it. Authorities in Cuba had tried something similar in 1840, when they had spread resin, and fired batteries of cannons simultaneously, all over Havana! It was believed that the air housed cholera and other diseases and that it could directly affect the organism, through its “miasmas.”

The “Cuban solution” is tried in Guadalajara

In 1850, the epidemic began and the Guadalajara council voted to try the Cuban solution. On August 7th , at the height of the epidemic, fireworks, artillery and everything else were ignited – even the church bells were rung – in order to stimulate air movement and purification , “to increase the electricity in the air and reduce the epidemic.”

During the 1833 epidemic, various industrial plants, including ones making soap, starch and leather, had been closed, though no regulations were ever passed for their subsequent improvement. This time, in 1850, more drastic measures were taken. Tanneries had to construct their own watercourses, and their water was not allowed to collect and stagnate by bridges. Soap works were transferred out of the city completely. Despite these efforts, many stagnant pools of water would have lain on the city’s poorly constructed cobblestone streets: pools of water just waiting for an outbreak of cholera.

The police force was given the power to supervise everyone’s adherence to the regulations. Inspectors were appointed for each district or barrio to see that all “night activities” (carts included) terminated before 8:00 a.m., that sewage water was not used for the irrigation of plants, that gatherings were not too large, and that billiard, lottery and society halls all closed at the start of evening prayers.

A group of doctors was obliged to give its services free to anyone who needed medical help. The doctors apportioned the city among themselves and were told by the town council that they would be paid for their services as soon as council funds permitted. The main idea, of course, was to help the poor, perhaps not so much from any altruistic motives but to avoid any inconvenience to the rich!

Fortunately, any new outbreak of the disease in modern Guadalajara will be handled very differently to these 19th century epidemics. The excellent modern medical facilities in the city, and the large number of qualified doctors, mean that anyone unlucky enough to contract the disease should be able to get adequate treatment ensuring a full and speedy recovery.

This is an edited version of an article originally published on MexConnect

Click here for the complete article

Note: The diffusion of cholera in Mexico during the 1991-1996 epidemic is discussed, alongside a map showing the incidence of the disease, in chapter18 of Geo-Mexico: the geography and dynamics of modern Mexico.

Geo-Mexico also includes an analysis of the pattern of HIV-AIDS in Mexico, and of the significance of diabetes in Mexico.