The West Rail Bypass International Bridge, a new USA-Mexico rail link

 Mexico's geography in the Press  Comments Off on The West Rail Bypass International Bridge, a new USA-Mexico rail link
Nov 032015
 

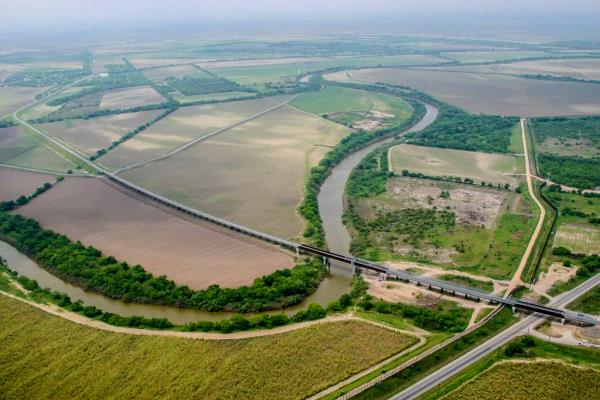
The flow of bilateral Mexico-USA trade has increased six-fold in value in the past 20 years to nearly 1.5 billion dollars a day; 80% of it moves by truck or rail. A new rail bridge, the West Rail Bypass International Bridge (WBR), opened in late August, capable of carrying up to 24 million metric tons of freight a year, which should help reduce delays in trans-border trade.

West Rail Bypass International Bridge.

West Rail Bypass International Bridge. Credit: Cameron County

The WBR links Matamoros (Tamaulipas) to Brownsville (Texas). It took four years to build and is the first new rail link between Mexico and the USA for more than a century. The bridge can be used by 14 trains a day and replaces a rail line that previously wound its way, with frequent delays, through a heavily congested urban area.

In an unrelated effort to speed up trans-border shipments, Mexican and U.S. officials are testing a single, joint customs inspection procedure that could cut border-crossing times for freight by up to 80%.

The program is being tested at three locations:

  • Laredo international airport in Texas (for vehicle, electronic and aerospace components being flown to eight cities in Mexico),
  • Mesa de Otay in Baja California (for Mexican farm products entering the U.S.) and
  • San Jerónimo in Chihuahua (for computers and other electronic exports from Mexico).

Assuming the six month pilot project is successful, costly border delays for some trans-border shipments could soon be a thing of the past. The project has been warmly welcomed by AmCham, the American Chamber of Commerce in Mexico, which represents more than 1,400 companies.

Related posts:

Nuevo León’s unusual shape

 Other  Comments Off on Nuevo León’s unusual shape
Jan 032015
 

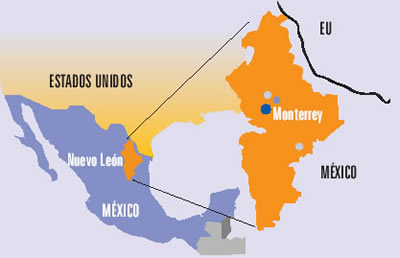
The northern state of Nuevo León is an industrial powerhouse, centered on Monterrey, Mexico’s third-largest city. The state’s shape on a map is unusual in more ways than one. The state has a long north-south axis and is very narrow from west to east. The strange indentation south of Monterrey is largely determined by relief. The peaks of the mountains on the Nuevo León side of that state boundary comprise a National Park, the Parque Nacional Cumbres de Monterrey.

Source: Universidad Autónoma de Nuevo León (UANL)

Source: Universidad Autónoma de Nuevo León (UANL)

Perhaps the strangest aspect of the shape of Nuevo León is the peculiar extension that forms the state’s north-eastern extremity (see map above). This small section of the state, about 15 km across, is sandwiched between the states of Coahuila and Tamaulipas, and extends to the Río Bravo and the U.S. border. The reason for this particular extension must date back a long time since it is clearly shown on this 1824 map of Mexico.

(Note that the shape of the neighboring state of Tamaulipas, with its lengthy extension north-west paralleling the US border, made much more sense in the early nineteenth century before the current international boundary was established).

While we’re not sure of the precise timing or reasons for the “neck” of land that gave Nuevo León access to the Río Bravo even before the current international boundary was fixed, it has certainly brought the state some benefit in recent decades in terms of economics and trade. Nuevo León is the smallest of the combined ten “border states” in the USA and Mexico.

A closer look at the Google Map image (above) of this area shows the border crossing of Laredo-Colombia across the Solidarity International bridge. Colombia is the name of the small grid-pattern town on the Mexican side, just west of the crossing.

Zooming in on the area of the crossing reveals the distinctive street pattern of a major border crossing, with extensive parking and loading areas.

The 371-meter-long (1216 ft) bridge has eight lanes for traffic and two walkways for pedestrians. It is one of four vehicular international bridges close to the city of Laredo, Texas. The community of Colombia and the international bridge were built to give Nuevo León its only international “port” for direct trade to and from the USA.

Related posts:

What are Mexico’s leading exports?

 Other  Comments Off on What are Mexico’s leading exports?
Nov 032014
 

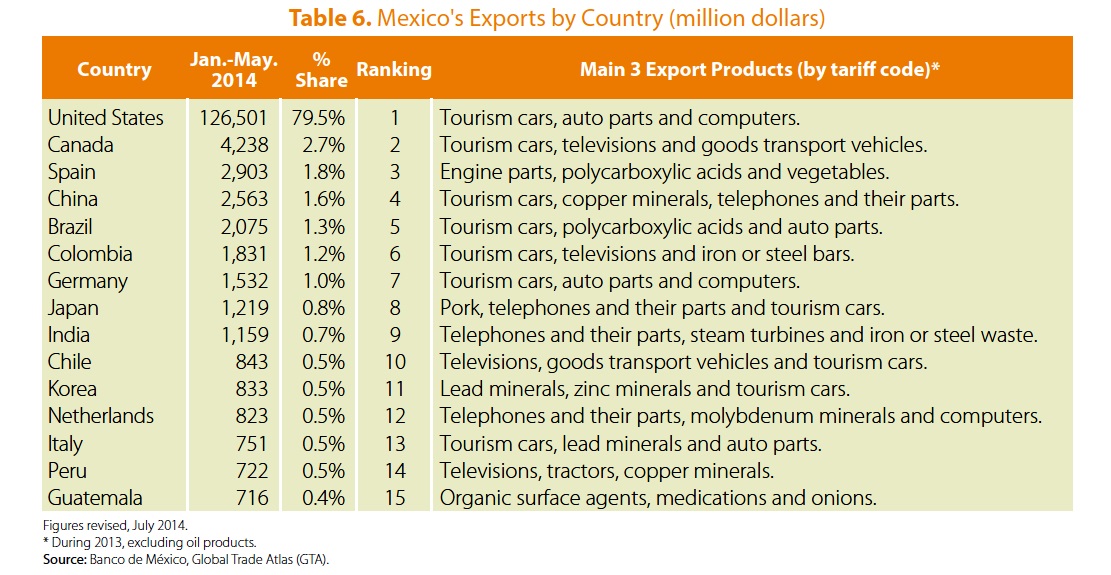
The table shows the destinations of Mexico’s major export flows, excluding petroleum-related exports, for the first five months of 2014. (All data from Pro-Mexico.) It is no surprise that Mexico’s two main export partners are the USA and Canada, its partners in the North American Free Trade Agreement (NAFTA), but the other countries in the list are far harder to guess, and even most economists would struggle to get them in the right order!

Mexico's leading exports by country, Jan-May 2014 (Pro-Mexico, 2014)

Mexico’s leading exports by country, Jan-May 2014 (Pro-Mexico, 2014)

Spain, on account of its colonial dominance and shared language, has long been a major destination for Mexican exports, whereas China (#4 on the list) is a recent entry, and one that has risen rapidly in importance for a wide variety of products. The other Asian countries on the list of the top 15 export destinations are Japan, India and South Korea.

All the remaining top 15 destinations for Mexican exports are in either Europe or Latin America.

In terms of the items exported, vehicles of various categories clearly lead the way by a wide margin, while various electrical or electronic items (telephones, televisions, computers) are also important. It appears that Japanese consumers must like Mexican pork, since that is Mexico’s leading export to Japan.

And who would have guessed that Mexico also exports significant quantities of iron and steel waste to India, or lead minerals to Italy?

For more details of Mexican exports, and a link to an interactive webpage about Mexico’s foreign trade since 1964, see our previous post Trends in Mexico’s foreign trade and Economic Complexity.

Related posts:

How does Mexico’s water footprint compare to that of other countries?

 Books and resources  Comments Off on How does Mexico’s water footprint compare to that of other countries?
Oct 292014
 

In a previous post, we saw how Mexico is a major net importer of “virtual” water. In this post we take a closer look at Mexico’s water footprint. The data throughout this post come from The Water footprint of Mexico in the context of North America (pdf file).

Individual products each have their own water footprint in terms of the total amount of water involved in their production, processing and marketing. For example a single cup of coffee represents (on average) a water footprint of 140 liters. Other water footprints include:

  • A single letter-sized sheet of paper – 10 liters
  • Microchip – 32 liters
  • Pair of leather shoes – 8000 liters
  • Glass of milk 200 liters
  • Glass of wine 120 liters
  • Tomato 13 liters
  • Hamburger (150 gram) 2400 liters

From numbers like these, it is possible to calculate the water footprint for an individual consumer in a particular country, and also for an average consumer in each country.

How does the water footprint in Mexico compare to other countries?

The water footprint of Mexico (WWF 2012)

The water footprint of Mexico (WWF 2012)

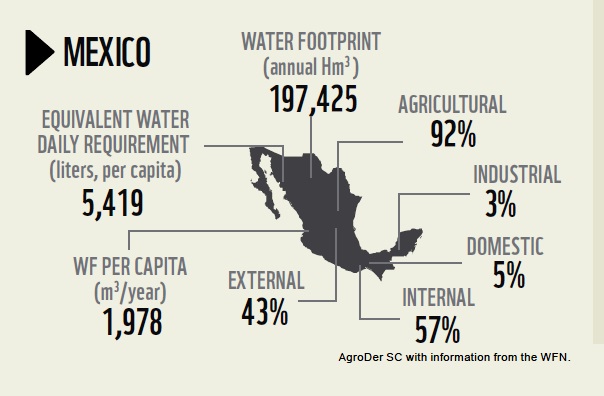
The graphic shows that Mexico’s total water footprint (all consumers) is 197,425 Hm³, of which 92% is agricultural, 3% industrial and 5% domestic. Only 57% of Mexico’s water footprint is internal, the remaining 43% is external (ie water used in other countries to make or produce items imported into Mexico). The average water footprint per person in Mexico comes to 5419 liters/day (or 1978 m³/year).

The global average water footprint (all countries, all consumers) in 2010 was 1,385 m³/y. However, some countries have much higher average water footprint/persons than others. For example, the average consumer in the USA has a water footprint of 2,842 m³/y, whereas in China and India the average water footprints are 1,071 and 1,089 m³/y respectively.

The water footprint of an average consumer worldwide  is primarily determined by their consumption of cereal products (contributes 27% to the average water footprint), followed by meat (22%) and milk products (7%).

It should be remembered that countries which heavily rely on foreign water resources may have significant impacts on water consumption and pollution elsewhere.

Full report:

Related posts:

Oct 232014
 

The online Atlas of Economic Complexity is now interactive, allowing users to choose and combine a large number of variables related to imports, exports, date and country. In the webpage’s own words, it is “a powerful interactive tool that enables users to visualize a country’s total trade, track how these dynamics change over time and explore growth opportunities for more than a hundred countries worldwide.”

What is economic complexity?

A country with a high Economic Complexity has a wide range of complex knowledge capabilities related to productive enterprises. Its economy is likely to produce sophisticated products that require a very wide and diverse set of knowledge capabilities. For example, relatively few countries have the capabilities to produce highly complex chemicals or pharmaceuticals, since their production requires very specialized equipment and very precise measuring instruments. Equally, very few countries have nuclear power stations or space stations, since they lack the range of knowledge capabilities needed to build them. At the other end, a very large number of countries have far less complex economies that are capable of producing simple products (basic foods, mineral ores, lumber, garments, shoes, glass, kitchen utensils, furniture) but not products involving more complicated processes or technology

We first discussed the Atlas in 2012 in How “complex” is the Mexican economy?, when we noted that the Atlas ranked Mexico’s Economic Complexity Index (ECI) as #20 of the 128 countries studied. The interactive nature of the online Atlas has added the opportunity to explore many more trends in trade, generating a range of related, visually-appealing infographics.

In particular, choosing Mexico as the country, the Atlas can answer questions such as:

  • What does Mexico import and export?
  • How has Mexico’s trade evolved over time?
  • What are the drivers of Mexico’s export growth?
  • Which new industries are likely to emerge in Mexico? Which are likely to disappear?
  • What are the GDP growth prospects of Mexico over the next 5-10 years, based on its productive capabilities?

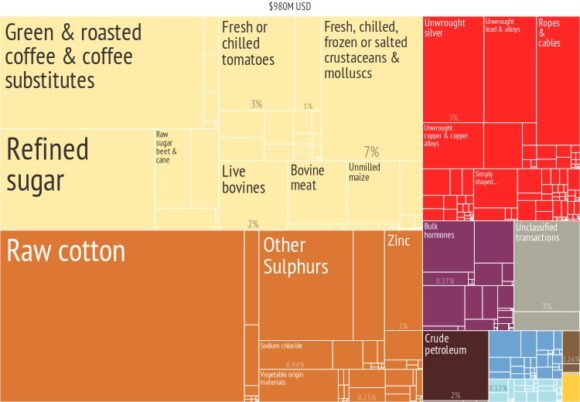
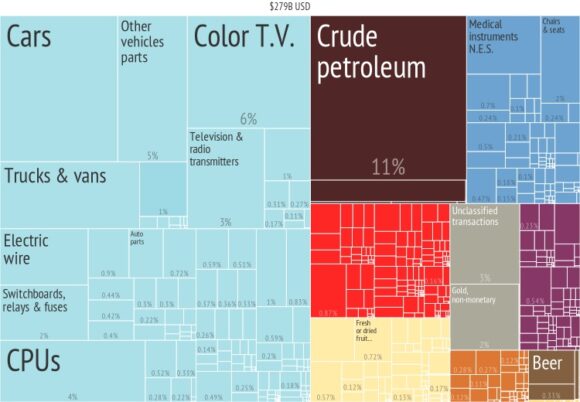
Playing with the variables and dates in the Atlas is a really interesting way to explore just how Mexico’s exports and imports have changed over the years. For example, compare these infographics for Mexico’s exports in 1964 and 2010 respectively:

What_did_Mexico_export_in_1964_

Mexico’s exports in 1964

Mexico's exports in 2010

Mexico’s exports in 2010

It is sometimes hard to imagine just how much Mexico has changed in the past fifty years! Overall, at rank #20, Mexico turns out to have an unusually high Economic Complexity Index given its income level. (All the other countries in the top 20 have significantly higher incomes than Mexico).

According to the Atlas, during the rest of this decade Mexico’s GDP should grow relatively rapidly, bringing its GDP rank more in line with its Economic Complexity Index. In general, analyses in the Atlas indicate that during the last few decades countries with higher than expected ECIs compared to their income levels experience more rapid economic growth.

Note, though, that while this relationship is empirically true, it does not explicitly include other factors thought to be important to economic growth such as governance and institutional quality, corruption, political stability, measures of human capital and competitiveness indicators.

Related posts

Mexico is a major net importer of “virtual” water

 Books and resources, Teaching ideas  Comments Off on Mexico is a major net importer of “virtual” water
Oct 132014
 

The concept of “virtual water” was developed by Professor J.A. Allan of King’s College (London University) and the School of Oriental and African Studies. Allan used it to support his argument that Middle Eastern countries could save their scarce water resources by relying more on food imports. The idea was sufficiently novel for Allan to be awarded the 2008 Stockholm Water Prize.

In Allan’s words, “The water is said to be virtual because once the wheat is grown, the real water used to grow it is no longer actually contained in the wheat. The concept of virtual water helps us realize how much water is needed to produce different goods and services. In semi-arid and arid areas, knowing the virtual water value of a good or service can be useful towards determining how best to use the scarce water available.”

As one example, producing a single kilogram of wheat requires (on average) around 1.5 cubic meters of water, with the precise volume depending on climatic conditions and farming techniques. The amount of water required to grow or make a product is known as the “water footprint” of the product.

Hoekstra and Chapagain have defined the virtual-water content of a product, commodity, good or service, as “the volume of freshwater used to produce the product, measured at the place where the product was actually produced”. The virtual water content is the sum of the water used in the various steps of the production chain.

Additional examples, showing the water footprint of producing one kilogram of:

  • biodiesel from soya –  11.4 cubic meters
  • beef –  15.4 cubic meters
  • butter –  5.5 cubic meters
  • chocolate – 17.0 cubic meters
  • pasta –  1.85 cubic meters
  • sugar (from cane) –  0.2 cubic meters

While the idea of virtual water has attracted some attention, its methodology is contested, and its quantification is not yet sufficiently precise to offer much potential for policy decisions.

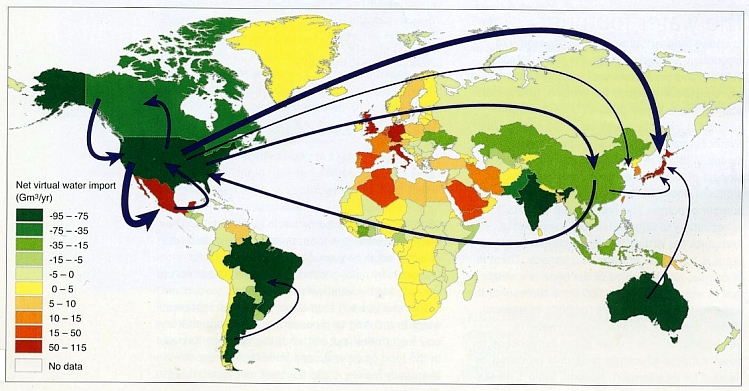
Imports and exports of virtual water represent the “hidden” flows of water involved when food and other commodities are traded from one place to another. The map below (from Hoekstra and Mekonnen, 2012) shows the net imports (imports minus exports) of virtual water for different countries for the decade 1996-2005. Note that only the major flows are shown.

water-virtual-tradeIn North America, both the USA and Canada have a significant positive virtual water balance (i.e. they are major exporters of virtual water), whereas Mexico has a significant negative water balance, and is clearly one of the world’s largest importers of virtual water.

As Allan’s original work suggests, this is not necessarily bad news since it may imply that Mexico is currently using less of its own (limited) water resources than it might otherwise have to. In other words, Mexico’s virtual water imports may be delaying the inevitable crunch time when water usage becomes a critical limiting factor in the nation’s development.

Source of map

A.Y. Hoekstra and M.M. Mekonnen. 2012. The water footprint of humanity. Proc. Nat. Academy of Sciences, 109, 3232-7. Map was reproduced in “Spotlight on virtual water” by Stuart N. Lane in Geography, vol 99-1, Spring 2014, 51-3.

Related posts:

Jun 022014
 

This engaging book analyses the historical geography of the port of San Blas, on Mexico’s west coast, and its hinterland which includes the small city of Tepic, the state capital of Nayarit. This area held immense importance during colonial times, was one of the main gateways for trade and influence peddling during the nineteenth century, before lapsing into relative obscurity at the end of the that century, and into the twentieth century. The tourism industry has sparked a mini-revival but none of the many grandiose plans for this coast have even been brought fully to fruition.

richter-coverThe Camino Real in Richter’s title is actually a branch from the Camino Real de Tierra Adentro (The Inland Royal Road, the spine of the colonial road system in New Spain). During colonial times, this linked the inland city of Guadalajara to Tepic and thence San Blas, though the modern highways uniting these places no longer follow the same route.

Robert Richter has known this area personally for decades, and his intimate knowledge of the local geography shines through. The book combines his own personal experiences with intensive historical research, both in the library and on the ground. Richter’s objective is to pin down the precise route of the Camino Real, and then find every remaining vestige of it that he can on the ground.

In reading the story of San Blas and the Camino Real, readers are treated to a dazzling array of insights into what made this area tick for so long before subsiding into something of a backwater. This branch of the Camino Real, from Guadalajara to San Blas, played a key role in the history of Western Mexico, and saw everything from pirates and adventurers to soldiers, priests and smugglers.

As Richter points out, “The Matanchen Bay-San Blas region grew in geographic and strategic importance to become the most important Pacific seaport between Guayaquil, Ecuador, and San Francisco, California, in the 1830s, a major international way station for both legal and contraband trade between an ungovernable Mexico and the rest of the world.”

This growth continued and, “In the 1850s, the cultural, economic, and political events roiling all along the Camino Real from San Blas to Guadalajara, especially in the mild sierra valley surrounding the city of Tepic, spawned a new regional identity, and eventually, a new political entity—the Mexican state of Nayarit.”

Richter tells his story with passion and it is impossible not to be drawn into the narrative and share his excitement as he sets out to find “missing” sections of the Camino Real, accompanied by a motley crew of secondary characters. To what extend does he succeed? Sorry, no spoilers here!

Inevitably, the past merges with the present and the future. What began as a seemingly straightforward historical geography becomes at turns a travelogue, journal of fieldwork and short essay about the sustainability of economic development along this coast. Richter is clearly not against change, but argues strongly that local tourist development in the future must take account and respect the region’s ecology, its history and its culture.

As the back cover blurb aptly states, “To explore Nayarit’s wild and gorgeous geography, trying to site the ancient Camino Real, is to stumble over another road running toward the state’s future economic development as part of the Mexican Riviera.”

This book should be of interest to geographers everywhere. It serves to prove that historical geography need not be dull and stuffy but can be made relevant, exciting and even entertaining, at the same time as it offers us valuable insights into possible futures.

One minor plea: please add an index when the second edition of this book is prepared!

Search for the Camino Real, a history of San Bad and the road to get there” is one of several books by Richter centered on the fading coastal village culture of Nayarit and the Mexican Riviera. His adventure novel, “Something like a Dream” (Oak Tree Press, 2014) is an especially entertaining read, with a lively plot and well-described settings ranging from the tourist resort of Puerto Vallarta to Nayarit fishing villages and tiny Huichol Indian settlements high in the Western Sierra Madre.

Map of the beaches of Colima, Jalisco and Nayarit, Mexico shows the location of all the key places mentioned in Richter’s books.

Related posts:

Mar 082014
 

Bananas are the world’s fourth most important dietary staple after rice, wheat and corn (maize). They are a major source of nutrition (low in fat, but rich in potassium and vitamins A, B, C and G) for people living in tropical areas. Of the 80 million tons of bananas produced globally each year, less than 20% enters international trade; the remainder is eaten locally. Bananas that are ripe and eaten raw are called desert bananas; those that are cooked are called plantains.

India is the world’s largest banana producer (31% of the world total) but is not an important exporter. Other leading producers include China (10%) and the Philippines (9%). Mexico (2%) is the world’s tenth largest producer, and the world’s 13th largest exporter. The world’s leading exporters of bananas (in dollar terms) are Ecuador, Costa Rica, Colombia and the Philippines.

How did bananas reach Mexico?

The banana plant is thought to have originated in southern Asia, possibly in the Mekong Delta area. Though the details are sketchy, banana plants were carried from there to Indonesia, Borneo, Philippines and Pacific Islands, including Hawaii. By AD650, bananas had reached Egypt and the Mediterranean coast. In the fiteenth century, Portuguese navigators and slave traders carried bananas to the Canary Islands. By the early sixteenth century, bananas had been introduced by Spanish missionaries to Santo Domingo on the island of Hispaniola in the “New World”.

Bananas reached Mexico for the first time in 1554 when Bishop Vasco de Quiroga (the first Bishop of Michoacán), returning from Europe, brought some plants back with him from his short layover in Santo Domingo.

FAO statistics for the past few years show that Mexico has about 75,000 ha planted with bananas. Total production is close to 2.2 million metric tons a year, giving an average yield of about 30 metric tons/ha. The yield is trending slowly upwards. The yield under irrigation (38.3 tons/ha) is 55% higher than that from rainfed farms. As a result, while irrigated farms account for just under 40% of the total acreage of bananas, they supply 50% of total production. Commercial banana growing provides about 100,000 direct jobs in Mexico and 150,000 indirect jobs.

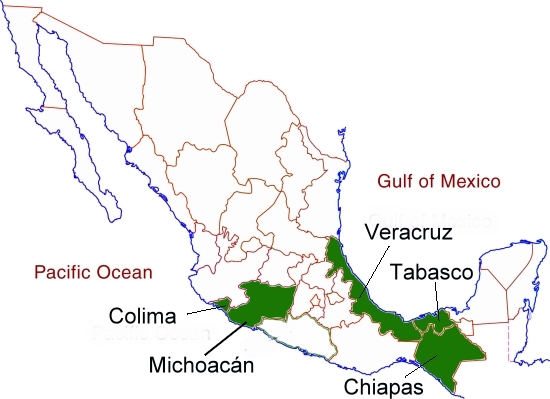
Mexico's banana-growing states

Mexico’s banana-growing states [corrected]

The main banana producing states (see map) in Mexico are:

  • Chiapas (35% of national production), especially the municipality of Tapachula
  • Tabasco (25%), where average price per metric ton is lower. Mexico’s largest banana exporting company, San Carlos Tropical Exports, is based in Tabasco.
  • Veracruz (13%), especially in the municipalities of Martínez de la Torre, Atzalán, Tlapacoyán, Nautla and Papantla
  • Michoacán and Colima (6.5% each)

Bananas are also grown, on a smaller scale, in Jalisco (4.5%), Guerrero and Oaxaca (3% each) and Nayarit (2%).

Maps showing banana cultivation areas in individual states can be generated via SIAP, the Agriculture Secretariat’s online database system.

Trade in bananas

The world’s major importers are the USA (bananas are the single most widely eaten fruit in that country), Germany, Japan, Russia, UK, Italy, France, Sweden and China.

Bananas were first introduced into US diets (from Cuba) in the early 19th century. The earliest large-scale shipments of bananas to the USA were from Jamaica in the 1870s, and were organized by Lorenzo Dow Baker, who later founded the Boston Fruit Company, which later became the United Fruit Company, now Chiquita Brands International.

Banana exports from Mexico have risen rapidly in recent years and reached 307,000 metric tons in 2012 (compared to 60,000 tons in 2005), worth about 140 million dollars. The USA is the world’s largest importer of bananas and Mexico’s main foreign market, receiving 80% of all exports of Mexican bananas.

Source for history of bananas:

  • Jenkins, Virginia S. Bananas: An American History. Washington: Smithsonian Institution, 2000

Other posts related to agricultural products:

Jul 152013
 

More than a year ago, the World Trade Organization (WTO) sided with Mexico and appeared to finally bring to an end a long-running dispute between Mexico and the USA over “dolphin-safe” tuna. The WTO decision confirmed that the methods used by Mexico’s tuna fishing fleet met the highest international standards, not only for protecting dolphins but also for conserving other marine species.

Dolphin-safe-logoThe USA has now responded by strengthening the rules governing the use of “dolphin safe”, a label first established in 1990. According to Mexican officials, the changes effectively circumvent the WTO decision by establishing two distinct regulatory regimes, one for the Tropical Eastern Pacific Ocean area (where the Mexican tuna fleet operates) and another, much less restrictive, for all other regions.

Mexican officials argue that the second regime, which does not include independent observers, has been unilaterally established by the USA in order to protect its own tuna fleet which uses methods that are not environmentally sound.

Part of the conflict over “dolphin safe” tuna revolved around the very different methods of fishing employed in the two countries. Mexican tuna fishermen use the encirclement method which involves locating tuna by chasing dolphins that swim with the tuna schools. Large purse seine nets are then employed to scoop up the fish. Decades ago, this method did indeed result in many dolphins being caught as bycatch. This led to justifiable outrage from environmentalists and the “dolphin safe” system. It quickly led to Mexico’s fleets employing specially-adapted nets and changes in procedure to ensure that any dolphins accidentally trapped can escape or are released and returned (alive) back to the ocean. According to the best available data, these improvements quickly reduced dolphin bycatch to close to zero.

Most US tuna fishermen, on the other hand, rely on either long-line fishing, in which every species hooked is killed, or employ fish aggregating devices to encourage the tuna to school. Both methods used by US tuna fisherman kill many immature tuna as well as numerous other species, including sharks and marine turtles (especially the critically endangered Pacific leatherback turtles), as well as seabirds (especially albatrosses and petrels).

The WTO agrees with Mexico that the method used by its tuna fleet is the most sustainable of those permitted by the International Dolphin Protection Program, and protects not only dolphins but also avoids the bycatch of juvenile tuna, ensuring the long-term viability of the tuna fishing industry.

The WTO resolution appeared to finally end this acrimonious dispute which had begun thirty years ago and included a US embargo against Mexican tuna which lasted for more than a decade. It meant that Mexico’s tuna fishermen could legally stamp “dolphin-safe” on their exports to the USA, the world’s largest tuna importer, certifying that the tuna had been caught in full compliance with the International Dolphin Protection Program. The revised US rules mean that most Mexican-caught tuna will still not qualify for the “dolphin safe” label.

Mexico’s tuna catch (mainly yellowfin tuna) peaked at 166,000 tons in 2003 when more than 20,000 tons were exported, mainly to Spain, and has since declined to around 115,000 tons. About 20,000 families in Mexico depend on tuna fishing for their livelihood. This figure includes not only fishermen but also those working in associated processing and packing plants. Mexico’s 130-vessel tuna fleet is the largest in Latin America.

The USA-Mexico tuna war is a classic example of a cross-border fishing/trade dispute. The new US regulations mean that the ball is now firmly back in Mexico’s court. Mexican fishing officials were quick to criticize the new rules, but have not yet announced their next move in this long-running saga which looks set to rumble on for quite some time.

Want to find out more?

Related posts:

Globalization: Mexico exports almost all motor vehicles it produces, but imports new cars

 Updates to Geo-Mexico  Comments Off on Globalization: Mexico exports almost all motor vehicles it produces, but imports new cars
Jan 082013
 

Which company exports the most motor vehicles in Mexico? In term of units exported, Ford was the leader with 449,925 units. Ford exported over 97% of the vehicles it made in Mexico in 2011. Though Ford sold many new cars in Mexico, virtually all were imports, mainly from the USA or Canada. GM was a relatively close second with 443,237 vehicles exported, 81% of the total produced.

VW was next with 439,925 units exported, 84% of their total. Nissan was fourth with 411,660 vehicles exported which was a significantly lower percentage (68%) of its total production. Nissan sells about a third of its Mexican produced vehicles in Mexico, by far the highest percentage among auto manufacturers in Mexico.

Chrysler/Fiat exported 266,117 vehicles, 79% of their total production. Toyota was next with 49,549 vehicles exported for an amazing 99.9% of the total manufactured. Surprisingly only 47 of the almost 50,000 Toyotas made in Mexico in 2011 were sold in Mexico; all of the rest were exported to the USA or Canada. Virtually all of the thousands of new Toyotas sold in Mexico are imported. This is a very extreme case of globalization at work under NAFTA. Honda exported 36,429 units in 2011 for 80% of its total production.

Data are not yet available to determine which companies will lead in exports in 2012 and the percentage of total production that is exported. Overall production is expected to rise by over 20% in 2012 and perhaps even faster in future years judging by the amount auto companies are currently investing in Mexico. Obviously, production levels in 2013 and beyond will be closely tied to demand in the USA and Canada.

Related posts:

Sep 292012
 

Industrial exports from Mexico are growing rapidly and diversifying. Some of this growth is coming at the expense of China and other Asian countries. For example, as Adam Thompson reported in the Financial Times, Siemens of Germany recently moved its facilities for assembling high voltage electrical equipment for power substations from China and India to Querétero, Mexico. By next year, most of the 160 parts for this equipment will also be produced in Mexico. Siemens has eight other factories in Mexico and over 6,000 employees. As a result of investments like this, Mexico now exports more manufactured products than the rest of Latin America combined.

It is well known that the USA imports a great deal of manufactured goods from China including toys, electronics, clothing, shoes, etc. But China’s market share of US imports has declined recently, from 29.3% in 2009 to 26.4% to day. On the other hand, Mexico’s market share has increased from 11.0% in 2005 to 14.2%. According to The Economist, “HSBC reckons that by 2018 Mexico will overtake Canada and China to become America’s main source of imports”.

Mexico’s location next to the giant US consumer market is a big factor (see “US firms are near-shoring jobs from China to Mexico”.

It is much faster and cheaper to ship goods from Mexico to the USA rather than from Asia. For example, it usually takes two to seven days from Mexico versus 20 to 60 days from China. Mexico’s locational advantage is particularly important for trendy time-sensitive goods and bulky items. For example, in 2009 Mexico became the world’s leading exporter of flat-screen TVs, surpassing South Korea and China. Mexico is also the leading supplier of smartphones for the US market. Furthermore, as Itizar Gomez Jimenez reports in “Beyond the Refrigerator Door: Success of the Electric Home Appliance industry in Mexico”, most of the large household appliances sold in the USA come from Mexico, including refrigerators, kitchen ranges, dishwashers, microwave ovens, washers and dryers.

Attractive wage rates in Mexico are also a consideration. A decade ago wages in Mexico were roughly four times those in China, but now they are only about 30% higher and the gap is closing (see, “Rising Chinese labor costs: good news for Mexico”). Less red tape under NAFTA also gives Mexico an advantage (see, “Can Mexico’s industry compete with China?”). Mexico is fully committed to globalization. It has free trade agreements with 44 other countries, twice as many as China and four times as many as Brazil. To date, drug war violence has not been a serious constraint to Mexico’s growing manufactured exports.

logo-made-in-mexicoMexico’s maquiladora export industries used to assemble mostly imported parts into finished products for export to the USA. Now, most of the parts are manufactured in Mexico for such industries as electronics, automobiles, appliances and airplanes. (see: “Mexico’s vibrant autoparts sector” and “The reasons why Mexico is fast becoming a key player in aerospace manufacturing). Mexico is also broadening its export market. In 2000, about 90% of Mexico’s exports went to the USA, but now it is down to 80%. Mexico is even exporting manufactured items to China such as the new Chrysler Fiat-500 micro automobile.

While Mexico manufactures products under the names of many foreign brands, it also has its own brands and OEM (original equipment manufacturer) companies that design and build products that are incorporated into foreign branded products. For example, Mexico’s Mabe designs and builds two-thirds of the gas ranges and refrigerators imported into the USA. Furthermore, most of the appliances sold under the General Electric brand in North and South America are manufactured by Mabe. LANIX, Mexico’s largest domestic electronics company, makes desktops, laptops, netbooks, tablets, LCD and LED TV and monitors and smartphones for a range of brand names.

A careful look around a typical household in the USA would reveal that many, perhaps a majority, of the durable manufactured goods would carry a “Made in Mexico” label, including automobiles, flat panel TVs, smartphones, all types of appliances, garden and small power tools, etc. etc.

Sources:

  • Adam Thomson, “Mexico: China’s unlikely challenger.The Financial Times, September 19, 2012 (registration required).
  • Itizar Gomez Jimenez, “Beyond the Refrigerator Door: Success of the Electric Home Appliance industry in Mexico” (pdf file). Cover Feature: Domestic Consume.

Related posts (specific industries):

Food speculation fuels a tortilla crisis in Mexico

 Books and resources, Teaching ideas  Comments Off on Food speculation fuels a tortilla crisis in Mexico
Oct 292011
 

The Ecologist Film Unit has produced an excellent 8-minute video on how financial speculation on corn (maize) has led to a dramatic rise in the price of corn tortillas, with potentially disastrous effects for the health and well-being of the many of Mexico’s poorest. Reporter Tom Levitt’s video, accompanied by text, presents a compelling case, one which would be an excellent starting-point for class discussions.

Two short quotes set the scene:

“For many Mexicans, particularly the estimated 40 million living on less than $5 a day (£3), tortillas account for almost half of their average daily calorie intake. As a whole, the country consumes 23 times more maize than rice.”

“In 2000 there was $6 billion invested in commodities, by 2011 it was $340 billion, of which $126 billion, according to data from Barclays Capital, is reported to be invested in food. The vast majority of this new investment has been by speculators with no interest in the agricultural sector or in actually taking delivery of the commodity.”

The result? Higher prices for corn, greater unpredictability in prices, and adverse changes to the diet of tens of thousands, as corn becomes more expensive than meager household budgets permit.

The video is a powerful indictment of the harm being done to ordinary people in many parts of the developing world by rich-world market speculators and investment banks. Watch it now, or read the full article:

The financial flows involved in Mexico’s vehicle manufacturing industry

 Other, Teaching ideas  Comments Off on The financial flows involved in Mexico’s vehicle manufacturing industry
Sep 192011
 

In previous posts, we have seen Where Mexico’s vehicle assembly plants are located, as well as looked at some of the reasons for Mexico’s success in this industrial sector and examined Mexico’s vibrant autoparts sector.

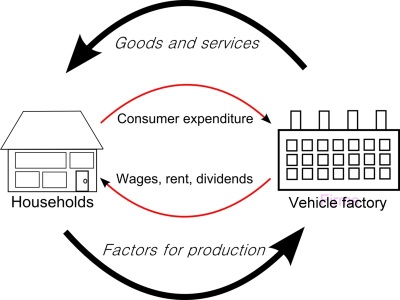
In this post we analyze the varied financial flows involved in the industry. Both local and international financial flows underpin vehicle manufacturing in Mexico.

financial flows

The following are some of the most important financial flows in the vehicle manufacturing sector.

  • International financial flows are in green
  • Domestic/local financial flows are in magenta

1. Foreign firms form Mexican subsidiaries and invest in Mexico; start-up capital to construct the factory and set up the business comes almost entirely from outside the country and enters Mexico as FDI. In recent years, FDI for auto firms has varied from $1 billion to $3 billion.

2. In many cases, local partners are involved, and they also contribute some of the start-up funds.

3. The factories employ workers, in some cases several thousand of them. These workers earn wages and spend most of their wages in the local economy. Each manufacturing job therefore has an economic multiplier effect, and generates more (indirect) jobs in the local economy. These jobs include positions in shops, services, transport, banking, auto-repair, etc. It is estimated that the economic multiplier for vehicle manufacturing is 3:1 – in other words, for every dollar spent in the industry three more are spent in the economy.

4. The factories purchase parts (components), some from Mexican suppliers, and some from overseas.

5. The factory produces vehicles, some of which are sold in the local market, via a series of vehicle distribution/sales points. This generates smaller two-way financial flows within the country.

6. Most of the parts and vehicles made in Mexican auto factories are exported. This generates another major financial flow, as purchasers overseas send funds back into Mexico to pay for their goods. This financial flow (a) allows production to continue and (b) generates profits for the factory owners (the car firms and shareholders).

7. The majority of these profits leaves Mexico, and is repatriated to the corporation’s home country, but both the workers in the factory, as well as the factory owners, pay taxes (state and federal) which remain in Mexico. In the case of shareholders, it is usually a financial flow towards their home country.

Previous posts in the mini-series:

Class exercise:

Use the description of financial flows above to draw an annotated diagram or a map to show the financial flows associated with the manufacturing of vehicles in Mexico. If you can think of additional flows that might be important, add those as well. Compare your diagram/map with that of other students and discuss the results.

The reasons why Mexico has become one of the world’s top ten vehicle-making countries

 Other  Comments Off on The reasons why Mexico has become one of the world’s top ten vehicle-making countries
Sep 052011
 

As we saw in an earlier post – Where are Mexico’s vehicle assembly plants located? – Mexico’s autoparts and vehicle assembly industry plays a vital role in Mexico’s economy, attracting foreign direct investment (FDI), providing employment and bringing in billions of dollars in export earnings each year.

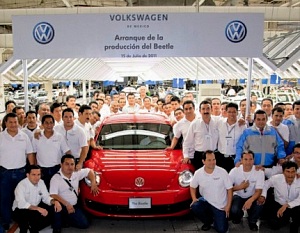
vw-plant-mexico

Mexico also has a large internal (domestic) market for vehicles. According to the Mexican Automotive Distributors’ Association, 820,000 vehicles were sold on the national market in 2010. The market leader is Nissan (with 23.5% of the domestic market), followed by General Motors (19.5%) and Volkswagen (13.2%). Mexico’s best-selling cars are the Nissan Tsuru/V16 and the Volkswagen Jetta. Nissan aims to have domestic suppliers for 90% of all its components by the end of 2011.

Why has Mexico become one of the world’s top ten vehicle-making countries?

  • Mexico already had a highly competitive manufacturing sector
  • Mexico has an excellent communications network, with several trans-border highways and rail lines, as well as several major ports. This means lower shipping costs
  • Stable exchange rate
  • Significant domestic market (population 112 million)
  • Mexico has formed an outstanding network of trade and investment agreements. Mexico has the world’s largest free trade agreements network, spanning three continents, and offers preferential tariffs to more than 44 countries.
  • Competitive labor costs
  • Responsible federal fiscal policies have increased the resilience of the national economy
  • Availability of skilled labor and well-educated, multilingual managers
  • Proximity to the USA, both for investments and for markets
  • Lower production costs: since 2009, the manufacturing costs for vehicles in Mexico has been between 80% and 90% of the equivalent cost in the USA.
  • Total production and delivery costs: For vehicles sold in the USA, costs are lower for vehicles made in Mexico than for those made anywhere else, including China, India and Brazil.
  • Government support: To stimulate higher-value activities (engineering, design, testing, R&D), Mexico’s government offers numerous incentives, including job training and tax credits.

Vehicles made in Mexico are high quality
Mexican manufacturing plants have consistently done well in the annual quality surveys undertaken by market research firm JD Power and Associates. The study has been conducted annually for the past 17 years and provides an important benchmark for the automotive sector. Vehicles made in Mexico usually have fewer defects than those made in the USA. In 2008, the Toyota plant in Baja California won the award for the top ranking plant in the Americas.

The top ten manufacturers:

According to the latest figures from the International Organization of Motor Vehicle Manufacturers (OICA), Mexico was the world’s 9 th largest vehicle-maker (2.2 million vehicles) in 2010, behind China, Japan, USA, Germany, South Korea, Brazil, India and Spain, but ahead of France, Canada, UK, Italy and Russia.

Further information:

For more facts and figures (with graphs and maps useful for teaching purposes): Mexico and the Automotive Industry, a strategic place to invest. Gerardo Ruiz Mateos, Ministry of Economy. June 2010. (pdf file)

US firms are near-shoring jobs from China to Mexico

 Mexico's geography in the Press, Updates to Geo-Mexico  Comments Off on US firms are near-shoring jobs from China to Mexico
Aug 112011
 

 Near-shoring means “the transfer of business or IT processes to companies in a nearby country, often sharing a border with your own country” (definition from SourcingMag.com). It is closely related to offshoring, now usually limited to similar transfers as near-shoring, but to more distant locations. Among the best examples of near-shoring are the hundreds of US companies that have set up factories and assembly plants in Mexico under the long-running maquiladora program (analyzed in detail in chapter 20 of of Geo-Mexico: the geography and dynamics of modern Mexico).

Maria Elena Rigoli, the President of Collectron International Management Inc., which helps companies make the move from the USA to Mexico, was interviewed about near-shoring for the 20 December 2010 issue of Food Manufacturing News. Despite reflecting her obvious vested interests,  the transcript of the interview is still interesting reading for geographers.

Rigoli first explains how Mexico’s maquiladoras work and then lists the major benefits of moving a company’s operations to Mexico:

  • Extremely fast shipping times offered by such a close location
  • Reduced labor costs
  • Trade agreements with many different countries, including NAFTA
  • Decades of experience in manufacturing and exporting
  • Highly-skilled, well-educated workforce

Quotes from the interview:

“Mexico is one of the world’s five largest developing economies. Global market research firm EuroMonitor International forecasts that Mexico will replace Italy as the 10th largest economy in the world within the next decade.”

“The technology used when producing goods in [Mexico’s] maquilas is the same or superior to that in the United States, as technology is typically transferred by the contracted companies individually. Additionally, the large pool of educated technicians coming out of Mexico’s many technical universities are trained to assemble, package, test and manufacture products in a maquiladora setting. This training is either on par or above the average training manufacturing personnel receive north of the border.”

“The growth of Mexico’s share in the aerospace industry speaks volumes about the craftsmanship and quality of products produced in Mexico. Originally, companies like Boeing and Bombardier only outsourced high volume-low tech operations to Mexico, now entire fuselages are designed and built here.”

How do Rigoli’s claims match up to what is happening today?

Well, among the numerous press reports that US manufacturers have started ‘near-shoring’ work from Asia to Mexico, is this one in Asian Shipper., that quotes figures from a survey conducted by consultancy AlixPartners of 80 big US companies.

The survey found that:

  • 9% have already shifted some or all of their operations from Asia to the Americas (= near-shoring).
  • 33% are considering doing it in the next three years

Is Mexico the most attractive location for near-shoring?

  • 63% say, “Yes!”
  • 19% think the USA is better.

What are the major advantages of near-shoring?

  • 30% said lower freight costs
  • 25% said speed-to-market
  • 18% claimed lower inventory costs
  • 16% said time-zone advantages such as easier management coordination
  • 11% liked closer cultural ties with North American managers.

What started as a trickle of US firms moving manufacturing back from China to Mexico seems to be becoming a clear trend. Globalization may have expanded the reach of many such US firms, but near-shoring now seems to be pulling some of them back, closer to home.

Related posts:

The cultivation of chiles in Mexico

 Updates to Geo-Mexico  Comments Off on The cultivation of chiles in Mexico
Apr 182011
 

In a previous post, we saw how chiles (Capsicum spp.) have been cultivated in Mexico for centuries (the oldest record of domestication dates back to 4100BC) and they made an important contribution to Mexico’s traditional cuisine being recognized by UNESCO as an “Intangible Cultural Heritage of Humanity.”In this post we take a closer look at where they are grown, how many are produced and how valuable the annual crop is for the domestic market and for export.

For an overview of different kinds of chiles, see these two articles by Karen Hursh Graber on MexConnect:

Area cultivated

The area cultivated for chiles has declined slightly over the last decade from 145,000 hectares to 141,000; about 85% of this area is irrigated. However, the volume of total production has risen by an average of 1.5%/yr, due to the application of improved techniques, knowledge and equipment, especially the increased use of greenhouses. Each year, a small percentage of the cultivated area is not harvested due to the adverse impacts of diseases, pests and climatic events.

Cultivation location, production volumes and value

Mexico’s total annual chile production is around 2 million tons [cf China’s 14.3 million tons]. By variety, about 30% of production is jalapeño chiles, followed by serrano (10.9%), poblano (9.7%) and morrón (8.1%). These four account for 60% of production:

  • jalapeño (619,000 tons in 2009): Chihuahua (42%), Sinaloa (12.9%), Jalisco (6.6%) and Michoacán (6.3%)
  • serrano (217,000 tons): Tamaulipas (38.7%) and Sinaloa (30.9%)
  • poblano (192,000 tons): spread between 16 states, led by Zacatecas (32.7%), Sinaloa (20.6%) and Guanajuato (13.2%)
  • morrón (162,000 tons): Sinaloa (96%)

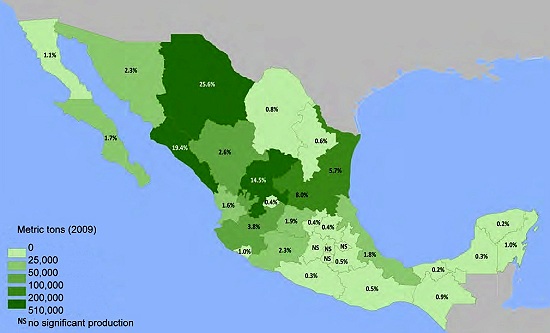
Production of chiles in Mexico
Production of chiles in Mexico, 2009. Source: SAGARPA 2010

The map shows total production volume on a state-by-state basis.

In summary, 2 out of every 3 green chiles grown in Mexico come from Chihuahua, Sinaloa, Zacatecas and San Luis Potosí.

Domestic market for chiles

The average consumption in Mexico is about 15 kg/person. For the period 2000-2010, domestic consumption oscillated around 1.5 million tons/yr. As international demand rises, there is a slightly reduced supply of chiles to the domestic market.

Trade in chiles (exports and imports)

International trade in chiles began shortly after Columbus introduced them to Europe as “peppers of the Indies”.

Today, as noted earlier, Mexico is the world’s leading exporter of green chiles, and ranks 6th for dried chiles. About 25% of Mexico’s chile production is exported. Over the last decade (2000-2009), exports have grown at a rate of about 15%/yr in volume, and 13% in value. In 2009, chile exports were worth 720 million dollars. Exports go to 52 countries, though a whopping 98% go to the USA, followed by the UK, Canada, Germany and Japan.

Mexico also imports some chiles each year. From 2000-2009, imports (almost entirely dried chiles) averaged 30,000 tons, at a cost of around 100 million dollars. China is Mexico’s main provider, followed by Peru, the USA and Spain.

Chile tourism
La Feria del Chile (The Chile Fair) in Queréndaro, Michoacán

Recipes with Chiles:

Main source (pdf file): Un panorama del cultivo del chile, SAGARPA: Servicio de Información Agroalimentaria y Pesquera, June 2010.
[accessed January 28, 2011]

Agriculture in Mexico is analyzed in chapter 15 of Geo-Mexico: the geography and dynamics of modern Mexico. Ask your library to buy a copy of this handy reference guide to all aspects of Mexico’s geography today! Better yet, order your own copy…

The changing geography of drug trafficking routes in Mexico

 Mexico's geography in the Press  Comments Off on The changing geography of drug trafficking routes in Mexico
Feb 262011
 

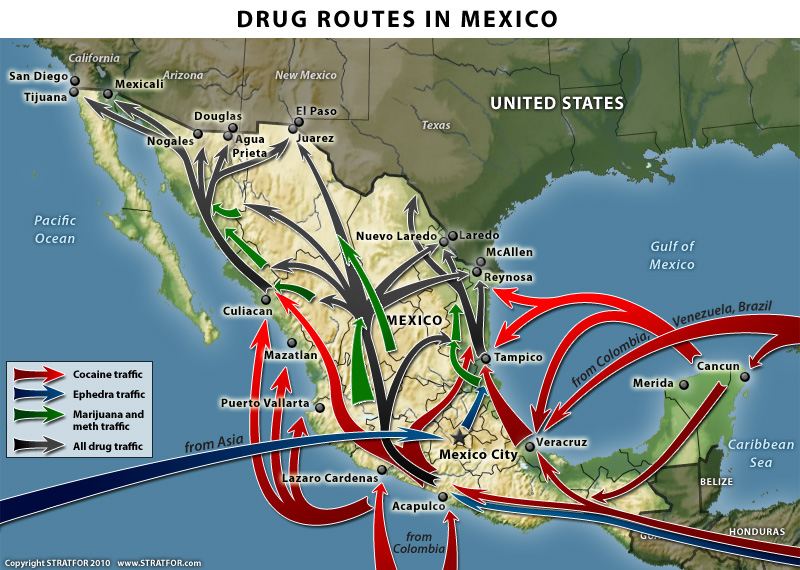
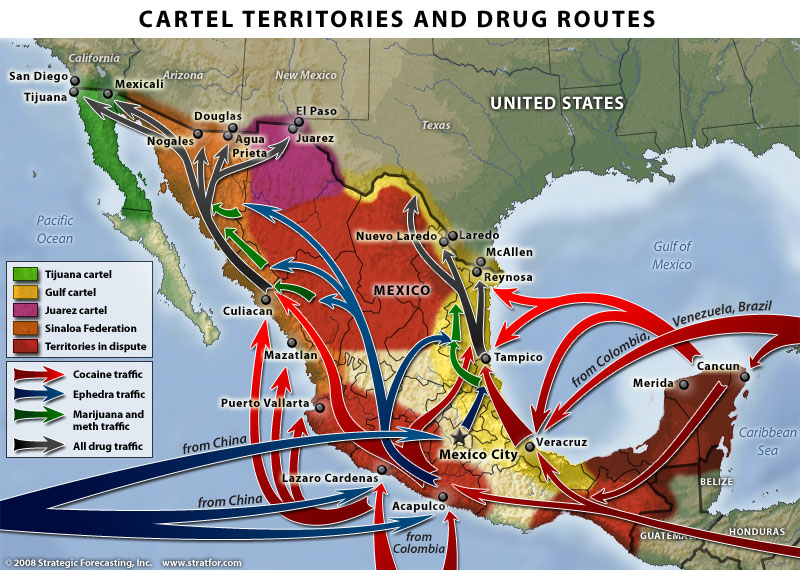
Last year, we reproduced an earlier version of this Stratfor map in The geography of drug trafficking in Mexico. The recently released new version, shown below, shows several changes from the earlier version.

Drug routes through Mexico

Drug routes in Mexico. Copyright Stratfor. Click map for enlarged version.

Map © Copyright 2010 Strategic Forecasting Inc, STRATFOR www.stratfor.com. This map is republished with permission of STRATFOR.

The main changes are that the new map:

  • does not show the territories controlled by each of the major drug cartels. As we have noted previously, the boundaries between cartel territories are hotly disputed and in a constant state of flux.
  • shows more marijuana traffic originating from Jalisco and Michoacán states.
  • labels the importing of ephedra from Asia as coming “from China”
  • adds a new route for ephedra trafficking from Central America through Guatemala and along Mexico’s Pacific Coast towards Acapulco.
  • strengthens the arrows showing a much larger movement of “all drug traffic” northwards from central Mexico through Chihuahua state and towards the border city of Ciudad Juárez, with branches of this flow extending not just to the Pacific Coast (as in the old map) but also to the Gulf Coast.

What do these changes mean?

First, it is apparent that the overall pattern of drug trafficking routes is more complex than originally thought. Shifting alliances between trafficking groups means that the “map” is being constantly redrawn to reflect the changing relative strengths of the different cartels and drug gangs.

These shifts in routes, and in the zones at the margins of each cartel’s territory mean that the focus of drug-related violence in Mexico is not limited to fixed locations, but that virtually anywhere in the country could find itself “in the wrong place at the wrong time” at some point in the future.

This is quite different to the pattern of drug-related violence 30 or 40 years ago, when most of the problems were concentrated in a relatively small number of generally isolated areas where the drugs were actually grown.

To read more posts about the geography of narcotic drugs in Mexico, use the “drugs” tag in the navigation bar on the left hand side of each page.

Other relevant link

Geo-Mexico: the geography and dynamics of modern Mexico discusses drug trafficking in several chapters.  A text box in chapter 20 looks at the drug trafficking business and efforts to control it.  Buy your copy today to have a handy reference guide to all major aspects of Mexico’s geography!

Feb 192011
 

Tomatoes are one of the many native Mexican plants that have become essential ingredients in the cuisine of many countries. Mexico is the 10th largest tomato producer in the world, after China, USA, India, Turkey, Egypt, Italy, Iran, Brazil and Spain (FAO 2008).

Mexico produces both red tomatoes (tomate or jitomate, depending on the region) which have high yields and account for about 75% of total tomato production, and green tomatoes (tomate verde) which have a lower yield and account for the remaining 25% of production.

The statistics in this post apply to the production and export of red tomatoes only.

The main varieties of red tomatoes in Mexico are:

  • vine-ripe large rounds
  • cherry tomatoes
  • Roma tomatoes, which now account for 54% of all tomato plantings in Mexico, as demand for them has increased at the expense of other kinds
  • greenhouse tomatoes (the collective name for several other varieties)

Greenhouses

The single most significant trend in tomato growing in Mexico is the increasing volume of production coming from greenhouse (including shade house) cultivation. Greenhouse cultivation still represents only a small portion of total tomato production in Mexico, but results in greatly improved yields.

Mexico has around 3,200 hectares of horticultural greenhouses in total. An earlier post analyzed the essential characteristics and advantages of the production of horticultural products in greenhouses.

The major advantages for tomato production are:

  • helps to raise yields
  • enables producers to move away from seasonal production and grow tomatoes virtually the entire year
  • ensures a higher quality and consistency of product
  • facilitates better food safety
  • helps to ensure that production and packing plants meet or exceed international standards

Rising yields

Yields are rising. Open field yields have risen from 23 metric tons/ha in 1990 to 28 mt/ha in 2000 and to 39 mt/ha in 2010. The highest open field yields are about 45 mt/h in Baja California and Sinaloa, due in part to their efficient pest and disease control protocols.

Greenhouse cultivation of tomatoes gets much higher yields, but also requires more capital investment and more expensive inputs of labor, fertilizers and pesticides. Open field cultivation of tomatoes in Sinaloa and Baja California costs between $3,800 and $6,000/ha. Greenhouse and shade house production of tomatoes can cost up to $22,000/ha. (All figures in US dollars.) The costs associated with many imported inputs (agrochemicals, seeds and fertilizers) are high; they are also dependent on the peso/dollar exchange rate.

Greenhouse yields in Mexico are generally about 150-200 mt/ha. Tomato growers in the USA and Canada using greenhouses achieve yields of up to 450mt/ha, so Mexican producers still have plenty of room for continued improvement.

The largest area of greenhouse tomato cultivation is in Spain (20,000 hectares). By comparison, the USA has only around 350 ha of greenhouse tomatoes, Canada has 650 ha and Mexico 730 ha.

Area cultivated and volume of production

The total area (greenhouse and open field) devoted to tomato cultivation in Mexico has decreased in recent years, from 85,000 ha in 1990 to about 60,000 in 2010.

Tomato production in Mexico for the 2010/11 season is forecast to reach 2.2 million metric tons.

Seasonality

There are two major seasons:

1. In the winter season (October-May), growers in Sinaloa are the main producers and exporters of fresh tomatoes. Michoacán, Jalisco, and Baja California Sur also produce significant amounts in the winter season. Sinaloa growers have adopted very modern cultivation methods, selecting varieties with an improved and extended shelf life, employing highly efficient drip irrigation, and using plastic mulch to maintain their high yields. Sinaloa has 15,000 hectares devoted to tomatoes, of which 1,340 hectares are using greenhouses or shade houses.

2. During the summer season (May-October), growers in Baja California are the main producers and exporters of fresh tomatoes, along with growers in Michoacán, Jalisco, and Morelos.
Tomatoes on a stamp

Mexico Exports: Tomatoes

Domestic consumption and the export market

The final consumption figure for the domestic market depends largely on the volume of tomato exports (primarily to the USA), since domestic consumption is essentially restricted to those tomatoes that do not enter the export flow. Volumes of exports, and price/ton depend on numerous factors beyond the control of farmers in Mexico, including, for example, the seasonal weather in Florida which will help determine the volume of tomatoes produced in the USA.

The USA imports tomatoes from both Canada and Mexico. Mexico’s share of USA tomato imports has risen rapidly since 2000 on account of their lower costs. Mexican tomatoes are less expensive for USA buyers than their Dutch or Canadian counterparts, due to Mexico’s cheaper labor rates, lower transport costs, and their modern cultivation and packing systems.

Mexico’s 1.1 million tons a year of tomato exports are worth 1.1 billion dollars. Mexico does import some tomatoes, but the annual value of imports rarely exceeds 65 million dollars.

Potential risks faced by Mexico’s tomato growers

  • extreme heat may make tomatoes ripen earlier than usual, as happened in Sinaloa in December 2009
  • the switch from open field tomato production to protected production (in greenhouses or shade houses) requires an expensive investment in infrastructure and technology.
  • international prices each year are a major determinant of how many hectares of tomatoes are planted the following year

Note on the first GM tomato

The first GM tomato to be commercially cultivated was the Flavor Saver from the Calgene company, planted in 1995 in Mexico, California and Florida. It was marketed as the MacGregor tomato. It was primarily developed because it did not spoil as quickly as previous varieties of tomato. MacGregor tomatoes last at least 18 days without spoiling, from the time they are picked. Conveniently, consumers also preferred their taste to then-existing varieties. Developing the first GM tomato cost Calgene 25 million dollars and took 5 years.

Main source:

Flores, D and Ford, M. Tomato Annual: area planted down but production up. USDA Foreign Agricultural Service GAIN (Global Agricultural Information Network) Report, January 2010
Jan 212011
 

Mexico’s Agriculture Secretariat (SAGARPA) has refused permission for transnational seed firm Monsanto to undertake larger-scale field trials of its GM corn in Sinaloa, and is opposing similar projects involving transgenic corn in Sonora and Tamaulipas. Monsanto is appealing SAGARPA’s initial decision. The other firms hoping to hold second-stage trials besides Monsanto are Dow Agrosciences (a unit of Dow Chemical Co.) and Pioneer Hi-Bred International (currently owned by DuPont).

Yum Kaax, the Mayan god of corn

What would Yum Kaax, the Mayan god of corn, think about GM corn?

As we noted in “The debate over GM corn in Mexico“, Mexico does not yet permit the commercialization of any genetically-modified corn, but Monsanto is betting on a relaxation of current rules as Mexico currently has to import large volumes of corn each year in order to satisfy domestic demand. Mexico’s corn imports are expected to rise from 10 to 15 million metric tons by 2020. Corn prices are also likely to rise since an increasing portion of the annual US corn crop is  destined for biofuel production rather than human consumption.

Monsanto argues that Mexico cannot guarantee its future food security unless it embraces the new agro-technology, and is threatening to withdraw 200 million dollars in planned investments over the next five years. A dozen agricultural organizations in the northern Mexico states of Sinaloa, Sonora, Chihuahua and Tamaulipas, have come out in support of Monsanto’s efforts to introduce transgenic corn, arguing that it is the best way for them to increase productivity and therefore becomes more competitive. The growers’ organizations claim that introducing GM crops has given their commercial competitors a competitive advantage in the marketplace.

The Agriculture Secretariat’s position reflects the concerns of farmers in other regions and ecologists who fear that the introduction of GM corn will displace or eradicate some of Mexico’s existing (non-GM) varieties. Protecting existing varieties of corn is the major motive behind the declaration by the governments of the Federal District and the state of Tlaxcala that their jurisdictions  are “GM-free zones”.

Jan 102011
 

We saw in an earlier post – Mexico’s shoe (footwear) manufacturing industry: regional clustering – that Mexico’s shoe manufacturing is concentrated in three major areas: León (Guanajuato), Guadalajara (Jalisco) and in/around Mexico City.

Shoes are also an important international trade item. Latin America’s largest international footwear trade show is SAPICA (Salón de la Piel y el Calzado), which is held in León twice a year. Each time, it attracts 12,000 buyers from the USA, Canada, Europe, Japan, and Central and South America.

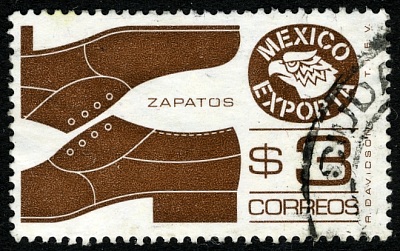
Mexico exports: shoes

Mexico exports: shoes

Exports

  • Export volume: 15 million pairs/yr
  • Value of exports: $250 million (dollars). Exports have risen steadily since 2006, despite the global economic difficulties.
  • Export destinations, by volume: USA 82%, Brazil 5%, Guatemala 2%, Japan 2% and Canada 2%.
  • Export destinations, by value: USA 84%, Japan 4%, Canada 2%, France 1% and Brazil 1%.

Imports

  • Import volume: 45 million pairs/yr
  • Value of imports: $450 million; this figure is rising at 15-20%/yr
  • Sources of imports, by volume: Vietnam 39%, Indonesia 21%, China 11%, Brazil 7%, Malaysia 5% and Thailand 5%.
  • Sources of imports, by value: Vietnam 43%, Indonesia 16%, China 14%, Italy 7% and Spain 6%.

Q. What can you deduce about Mexico’s international shoe imports and exports by comparing the percentages for trade by volume and trade by value? (eg. which countries supply more expensive shoes?)

The threat from China

At first sight, these figures do not suggest that Mexican manufacturers have much to worry about from Chinese shoe manufacturers. However, it is believed that many of the shoes entering Mexico from Vietnam and Indonesia actually originate in China. In addition, some Chinese shoes are thought to be repackaged in the USA for eventual export to Mexico.

Shoe manufacturers’ representatives in Mexico opposed China’s entry into the World Trade Organization (WTO) since they feared it would unleash a flood of cheap Chinese imports into the country. In an effort to help protect national manufacturers, the Mexican government has, for most of the past 20 years, levied a compensatory 35% tariff on shoes originating in China.

Challenges faced by Mexico’s shoe industry

  • Mexico’s shoe industry faces periodic shortages of some raw materials. In addition, the sector’s supply chains and delivery systems need strengthening.
  • The improvement of product quality may require further investment in technology and research.
  • As tariff barriers are lifted, Mexico’s shoe manufacturers will face greatly increased competition from overseas.

Source of statistics: CICEG (Guanajuato Shoe Manufacturers Association) Situación de la industria del calzado en México.

Related posts:

Mexico’s economic geography is analyzed in chapters 14–20 of Geo-Mexico: the geography and dynamics of modern Mexico. Buy your copy of this invaluable reference guide today!

Jan 052011
 

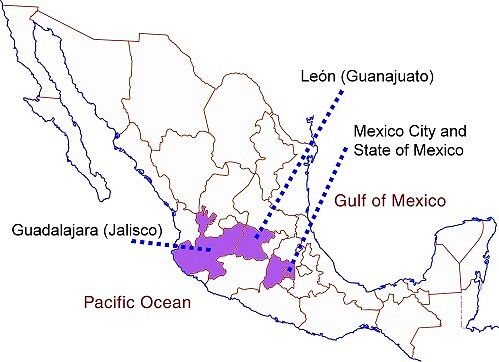
Mexico’s footwear industry is heavily concentrated in three main locations. Manufacturing is focused on the city of León in the state of Guanajuato. Factories and workshops in León account for about 68% of all shoes made in Mexico. The two other important manufacturing areas for footwear are Guadalajara (Jalisco) where about 18% of the national production originates, and Mexico City (together with surrounding parts of the State of Mexico), responsible for 12%.

How has this concentration come about?

León, in Guanajuato, is the center of one of the world’s most complete leather and footwear clusters. The area is a leading supplier and exporter of footwear, saddles and hats.

Footwear has been made in Guanajuato since 1645. The earliest association of shoe makers dates back to 1808. The sector is dominated today by firms with majority Mexican capital. Several of the foreign firms which manufactured shoes here prior to the second world war, changed the focus of their production lines in the early 1940s to specialize in supplying military footwear, leaving the making of consumer footwear to firms with national capital.

Footwear industry in Mexico

Concentration of shoe industry in Mexico.

The advantages of concentration

1. Local raw materials. Local inputs of leather and synthetics reduce the transportation costs (and time) for obtaining raw materials

2. Shared suppliers. Supporting the leather and footwear firms are local suppliers which offer machinery and equipment for tanneries, chemicals, leathers and skins, synthetic materials, dyes and textiles, as well as more specialized shoe-related items such as lasts, soles and heels, accessories and fittings. Shared information and machinery Because the shoe firms are grouped together in a cluster, ideas and information and even specialized machinery can all be shared.

3. Labor. This area has long specialized in footwear and leather products, so all firms benefit from the skilled local labor force.

4. Linkages. Both vertical and horizontal linkages between companies are important in the shoe industry. Vertical linkages occur when one company controls many or all stages in the production line. For instance, a company may make its own accessories and fittings to attach to the shoes it makes, or it may tan its own leather.  Horizontal linkages exist where one company is supplied with components (heels, soles) made by another company.

5. Economies of scale.

6. Educational infrastructure. The León area has a variety of educational, training and research centers all supporting the leather and footwear sector. This increases the chances of technological innovations, and the speed of their adoption.

The major advantages of León as an industrial location:

The position of León is key to its success. It is located in central Mexico, close to the major urban areas of Mexico City, Querétaro and Guadalajara. On a broader scale, it is close to the major export markets of the USA, Canada and Central America.

Market proximity is enhanced by an excellent communications network, including good road and rail links, easy access to several major airports, and to seaports such as Manzanillo.

The basic statistics (2009-2010):

  • Number of footwear-related firms: about 8000, half of them in Guanajuato.
  • Size of firms: 56% micro (fewer than 10 employees), 33% small (10-50 employees).
  • Employment: the footwear sector provides 140,000 direct jobs, and twice as many indirect jobs, for a total of 420,000.
  • Mexico’s largest shoe maker: Emyco, whose 4,500 workers make 6 million pairs of shoes, boots and sandals (various brands) every year. This firm alone introduces 100 new models every three months.
  • Production volume: 250 million pairs/yr, about 1.6% of world total.
  • Domestic market: 285 million pairs/yr (average of 2.5 pairs/person/yr)

The domestic market is focused on low-cost shoes, with a few exceptions, such as the market for “cowboy” boots. The manufacture of hand-crafted, high-priced cowboy boots is dominated by smaller firms such as Botas Je-Ver, Botas Jaca and Rancho-Boots, each of which employs 50-200 workers. Some cowboy boots are made from exotic hides, such as crocodile, cayman, armadillo, iguana, ostrich and snake. They are a much-prized status symbol among the upper echelons of Mexico’s drug cartels!

In future posts, we will examine Mexico’s imports and exports of shoes, and see if it is possible to identify any patterns to the distribution of shoe retailers in some of Mexico’s major cities.

Source of statistics: CICEG (Guanajuato Shoe Manufacturers Association) Situación de la industria del calzado en México.

Related posts:

Mexico’s economic geography is analyzed in chapters 14–20 of Geo-Mexico: the geography and dynamics of modern Mexico. Buy your copy of this invaluable reference guide today!

Aug 072010
 

The copper industry in Mexico embraces two extremes: from a major Mexican multinational, Grupo México, to hundreds of dedicated, but poorly remunerated coppersmiths living in a small town in Michoacán.

Large-scale copper mining in Mexico

Grupo México is the largest mining corporation in Mexico, and the world’s third largest copper producer. The company has faced a series of financial and labor issues over the years, which have sometimes restricted its output. It operates two major mines in Mexico, both in the northern part of the state of Sonora:

  • Cananea – this mine, which dates back to 1899, produced 163,804 tons of copper in 2006. It has some of the largest reserves in the world.
  • La Caridad – proven reserves of 600 million metric tons.

Grupo Peñoles started extracting copper from the Milpillas copper deposit, also in Sonora, in 2006. Copper miens in Sonora account for 83% of national output. Other states where copper is mined include:

  • Zacatecas (6%), where copper is one of several metals obtained from Industrial Minera México’s mine at Sombrerete
  • Chihuahua (4%), where copper is mined at Santa Bárbara and Naica.
  • San Luis Potosí (6%), where copper comes from the polymetallic mine of Charcas (also Industrial Minera México)
  • minor amounts are also obtained in Durango, Hidalgo, Michoacán, the State of México and Sinaloa.

335,000 tons of copper were mined in 2007

Mexico Exporta - CopperSanta Clara del Cobre

The artisans of Santa Clara del Cobre are justly world-famous for their coppersmithing skills.

A great time to visit the town, one of Mexico’s Magical Towns, is during the annual Copper Fair. The XLV National Copper Fair and LXV Hammered Copper Competition run from 7-17 August 2010. The competition offers 89 prizes with a total prize fund of 414,000 pesos (33,000 dollars).

How did Santa Clara, in Michoacán, come to be associated with copper working?

In pre-colonial times, local Indians mined for copper in various regions of Mexico including the state of Michoacan in Central Mexico, where the local P’urhepecha Indian group produced magnificent copper, gold and silver jewelry. They also made copper handaxes, used as currency throughout MesoAmerica.

In 1538, the Spanish missionary, Vasco de Quiroga, the first Bishop of Michoacan, helped develop local crafts. To avoid competition between villages, he encouraged each village to specialize in a particular craft. Coppersmithing was the craft allocated to Santa Clara (now Santa Clara del Cobre).

Santa Clara became the most prominent copper-producing town in colonial New Spain. During the 17th century, the town was the main source for hand-hammered copper kettles.In the 20th century, when demand for these collapsed, the townspeople, supported by government programs, started making a variety of other objects.

A National Copper Fair was started, and state-sponsored coppersmithing competitions began. Santa Clara de Cobre has a museum dedicated to copper working, where many of the prize-winning entries from previous years are displayed.

Further artistic and commercial impetus to Santa Clara copper came in the 1970s from American James Metcalf and his Mexican wife Ana Pellicer. Metcalf created the Olympic torch for the 1968 Mexico City Olympic Games.

While most copper pieces are designed to be utilitarian, the number of decorative items has increased in recent decades, with many items incorporating other metals, stone and ceramics. Many of the workshops continue to employ traditional techniques; a single hand-crafted piece may take an entire month to make.

The economy of coppersmithing

About 82% of households in Santa Clara depend on copper working for their livelihood. The town has more than 300 workshops. Between them, they transform 450 tons of copper a year. In an average year, sales of copper items reach about 4 million dollars.

Smelting the copper in colonial times required large quantities of charcoal. Charcoal production contributed greatly to the region’s deforestation.

The industry depends on recycled copper wire and cable, which in some years includes imports from the USA. One of the great ironies of this is that American tourists now visit Santa Clara to buy back (admittedly at a much higher price and in a more artistic form) the same copper they once threw away.

When electricity was first brought to Santa Clara, it is said that the electric company had a hard time keeping the lines functioning as they were often stolen to be hammered into copper posts and pans for the next market day.

Curiosity

Perhaps Santa Clara’s most famous son is J. Jesús Pérez Gaona, better known as “Pito Pérez”. Born in 1867, he began studying to be a priest, but never completed his studies. He then became a clerk, a drunkard and—mainly—a wonderful dreamer. He was immortalized in Rubén Romero’s great work, “La vida inútil de Pito Pérez” (The useless life of Pito Pérez), later turned into a movie.

Mexico’s mining sector is analyzed in chapter15 of Geo-Mexico: the geography and dynamics of modern Mexico. Buy your copy of this invaluable reference guide today!

El Camino Real or Royal Road, the spine of the colonial road system in New Spain (Mexico)

 Excerpts from Geo-Mexico  Comments Off on El Camino Real or Royal Road, the spine of the colonial road system in New Spain (Mexico)
Aug 042010
 

By the start of the 16th century, the Aztec Empire had a well developed system of “roads”.  However the Aztecs had neither wheels nor beasts of burden to transport themselves or their goods.  Obviously this limited transportation to the speed, range and endurance of foot power.  Their system of roads was essentially a system of foot trails.

Map of Camino RealThe Spanish conquistadors found the Aztec roads completely unsuitable for horse traffic and animal-drawn carts. They were forced to undertake expensive re-routing, flattening, widening, and upgrading.  In 1550, they started construction of the first section of El Camino Real (the royal highway) linking Mexico City with Spain through the port of Veracruz.  The opening of this new road greatly facilitated communication and the transfer of Aztec gold to Spain, and Spanish goods to Mexico’s interior. To counter the threat of bandits, the road was constantly patrolled by soldiers.

Towns along this route gained new importance. Puebla become the second largest and most important city in New Spain, a position it was to hold for 300 years. In the late 1550s, the road was extended north to Zacatecas, to facilitate transporting gold and silver from that area back to Mexico City and then on to Spain.

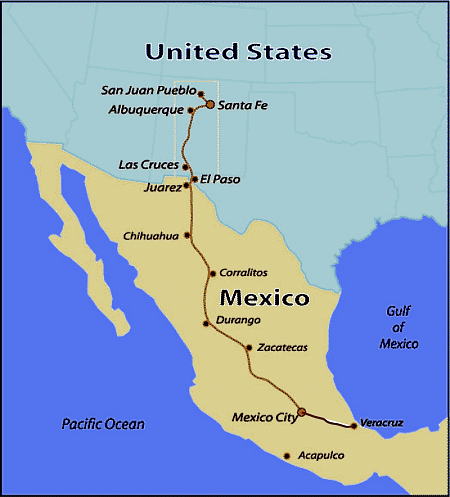
El Camino Real was later extended to other important cities and mining districts.  By 1600 it reached as far north as Chihuahua and was later extended to Santa Fe (in what is now New Mexico).  Many other roads were added to the system to facilitate administration, communication and economic exploitation.

In 1565, the Spanish decided it was safer to ship Asian goods from their colony in the Philippines back to Spain by crossing the Pacific, transshipping the cargo across the breadth of Mexico, and then sailing from Veracruz to Spain. To support this, the El Camino Real was expanded to link Mexico City to Acapulco. This section was only serviceable for pack mules; a road suitable for wheeled vehicles was not completed until well into the 20th century.

For 250 years, Spanish galleons carried Mexican silver to Manila, and returned with spices, silk, porcelain, lacquer ware, and other exotic oriental goods destined for Spain.

The development of Mexico’s transportation system is discussed in chapter 17 of Geo-Mexico: the geography and dynamics of modern Mexico. Ask your library to buy a copy of this handy reference guide to all aspects of Mexico’s geography today! Better yet, order your own copy…

The economic benefits to Mexico of the drugs trade

 Mexico's geography in the Press  Comments Off on The economic benefits to Mexico of the drugs trade
May 032010
 

The economics of the drug trade

The amount of money pouring into Mexico annually is stunning. It is estimated to be about $35 billion to $40 billion each year. The massive profit margins involved make these sums even more significant. Assume that the manufacturing sector produces revenues of $40 billion a year through exports. Assuming a generous 10 percent profit margin, actual profits would be $4 billion a year. In the case of narcotics, however, profit margins are conservatively estimated to stand at around 80 percent. The net from $40 billion would be $32 billion; to produce equivalent income in manufacturing, exports would have to total $320 billion.

In estimating the impact of drug money on Mexico, it must therefore be borne in mind that drugs cannot be compared to any conventional export. The drug trade’s tremendously high profit margins mean its total impact on Mexico vastly outstrips even the estimated total sales, even if the margins shifted substantially.

On the whole, Mexico is a tremendous beneficiary of the drug trade. Even if some of the profits are invested overseas, the pool of remaining money flowing into Mexico creates tremendous liquidity in the Mexican economy at a time of global recession. It is difficult to trace where the drug money is going, which follows from its illegality. Certainly, drug dealers would want their money in a jurisdiction where it could not be easily seized even if tracked. U.S. asset seizure laws for drug trafficking make the United States an unlikely haven. Though money clearly flows out of Mexico, the ability of the smugglers to influence the behavior of the Mexican government by investing some of it makes Mexico a likely destination for a substantial portion of such funds.

The money does not, however, flow back into the hands of the gunmen shooting it out on the border; even their bosses couldn’t manage funds of that magnitude. And while money can be — and often is — baled up and hidden, the value of money is in its use. As with illegal money everywhere, the goal is to wash it and invest it in legitimate enterprises where it can produce more money. That means it has to enter the economy through legitimate institutions — banks and other financial entities — and then be redeployed into the economy. This is no different from the American Mafia’s practice during and after Prohibition.

The paragraphs above are taken from a Stratfor Geopolitical Intelligence Report about Mexico’s fight against the drug cartels, Mexico and the Failed State Revisited, by George Friedman, published on 6 April 2010.

“This report is republished with permission of STRATFOR” © Copyright 2010 STRATFOR.

An overview of the geography of drug trafficking in Mexico forms part of chapter 20 of Geo-Mexico: the geography and dynamics of modern Mexico. Buy your copy today!

Related articles in this mini-series:

Mexico’s export trade in drugs

 Mexico's geography in the Press  Comments Off on Mexico’s export trade in drugs
Apr 282010
 

These paragraphs come from a Stratfor Global Security and Intelligence Report by Fred Burton and Ben West, When the Mexican Drug Trade Hits the Border, published 15 April 2009 (republished with permission of STRATFOR).

Though the drug trade as a whole is highly complex, the underlying concept is as simple as getting narcotics from South America to the consuming markets — chief among them the United States, which is the world’s largest drug market. Traffickers use Central America and Mexico as a pipeline to move their goods north. The objective of the Latin American smuggler is to get as much tonnage as possible from Colombia, Peru and Bolivia to the lucrative American market and avoid interdictions by authorities along the way.

However, as narcotic shipments near the U.S.-Mexican border, wholesale trafficking turns into the more micro process of retail distribution. In southern Mexico, drug traffickers move product north in bulk, but as shipments cross the U.S. border, wholesale shipments are broken down into smaller parcels in order to hedge against interdiction and prepare the product for the end user. One way to think about the difference in tactics between trafficking drugs in Central America and Mexico and distributing drugs in the United States is to imagine a company like UPS or FedEx. Shipping air cargo from, say, New York to Los Angeles requires different resources than delivering packages to individual homes in southern California. Several tons of freight from the New York area can be quickly flown to the Los Angeles area. But as the cargo gets closer to its final destination, it is broken up into smaller loads that are shipped via tractor trailer to distribution centers around the region, and finally divided further into discrete packages carried in parcel trucks to individual homes.

As products move through the supply chain, they require more specific handling and detailed knowledge of an area, which requires more manpower. The same, more or less, can be said for drug shipments. This can be seen in interdiction reports. When narcotics are intercepted traversing South America into Mexico, they can be measured in tons; as they cross the border into the United States, seizures are reported in kilograms; and by the time products are picked up on the streets of U.S. cities, the narcotics have been divided into packages measured in grams. To reflect this difference, we will refer to the movement of drugs south of the border as trafficking and the movement of drugs north of the border as distributing.

As narcotics approach the border, law enforcement scrutiny and the risk of interdiction also increase, so drug traffickers have to be creative when it comes to moving their products. The constant game of cat-and-mouse makes drug trafficking a very dynamic business, with tactics and specific routes constantly changing to take advantage of any angle that presents itself.

The only certainties are that drugs and people will move from south to north, and that money and weapons will move from north to south. But the specific nature and corridors of those movements are constantly in flux as traffickers innovate in their attempts to stay ahead of the police in a very Darwinian environment. The traffickers employ all forms of movement imaginable, including:

  • Tunneling under border fences into safe houses on the U.S. side.
  • Traversing the desert on foot with 50-pound packs of narcotics. (Dirt bikes, ATVs and pack mules are also used.)
  • Driving across the border by fording the Rio Grande, using ramps to get over fences, cutting through fences or driving through open areas.
  • Using densely vegetated portions of the riverbank as dead drops.
  • Floating narcotics across isolated stretches of the river.
  • Flying small aircraft near the ground to avoid radar.
  • Concealing narcotics in private vehicles, personal possessions and in or on the bodies of persons who are crossing legally at ports of entry.
  • Bribing border officials in order to pass through checkpoints.
  • Hiding narcotics on cross-border trains.
  • Hiding narcotics in tractor trailers carrying otherwise legitimate loads.
  • Using boats along the Gulf coast.
  • Using human “mules” to smuggle narcotics aboard commercial aircraft in their luggage or bodies.
  • Shipping narcotics via mail or parcel service.

These methods are not mutually exclusive, and organizations may use any combination at the same time. New ways to move the product are constantly emerging.

“This report is republished with permission of STRATFOR” © Copyright 2010 STRATFOR.

An overview of the geography of drug trafficking in Mexico forms part of chapter 20 of Geo-Mexico: the geography and dynamics of modern Mexico. Buy your copy today!

Related articles in this mini-series:

The geography of drug trafficking in Mexico

 Maps, Mexico's geography in the Press  Comments Off on The geography of drug trafficking in Mexico
Apr 242010
 

This article dates back to 2010. For updates, see:

This map of drug cartel territories and drug trafficking and export routes comes from a Stratfor Global Security and Intelligence Report by Fred Burton and Ben West, When the Mexican Drug Trade Hits the Border, published 15 April 2009.

Map of Cartel Territories. Copyright Stratfor. Click map for enlarged version.

Click here to see map in its original context. Map © Copyright 2008 Strategic Forecasting Inc, STRATFOR www.stratfor.com. This map is republished with permission of STRATFOR.

The map shows the major routes for Mexico’s imports, transport and exports of drugs.  The boundaries between cartel territories are in a constant state of flux as rival cartels fight to enlarge their territories.

Perhaps the single biggest shift in the geography of drug trafficking in Mexico in recent decades has been that involving drugs originating in Colombia. Prior to the 1980s, Colombian drugs reached the US and Canada either direct or via the Caribbean. During the 1980s, as US pressure mounted on these routes, Colombian cartels shifted their supply routes to Mexico, where they needed the help of Mexican gangs. These gangs rapidly became better organized and have become the powerful Mexican cartels operating today.

Mexico’s on-going “war” against drugs cartels has had most success so far against the Gulf cartel and the Zetas, who started life as the enforcing arm of the Gulf cartel. On the other hand, the influence of the Sinaloa cartel appears to be spreading. For an analysis of the Gulf cartel, including the effects of globalization on its operations, see Stephanie Brophy’s “Mexico Cartels, corruption and cocaine: A profile of the Gulf cartel” (Global Crime, vol. 9, #3, August 2008, pp 248-261)

This article dates back to 2010. For updates, see:

An overview of the geography of drug trafficking in Mexico forms part of chapter 20 of Geo-Mexico: the geography and dynamics of modern Mexico. Buy your copy today!

Related articles in this mini-series: