Cleaning up the Juanacatlan Falls, the “Niagara of Mexico”

 Other  Comments Off on Cleaning up the Juanacatlan Falls, the “Niagara of Mexico”
Jan 142016
 

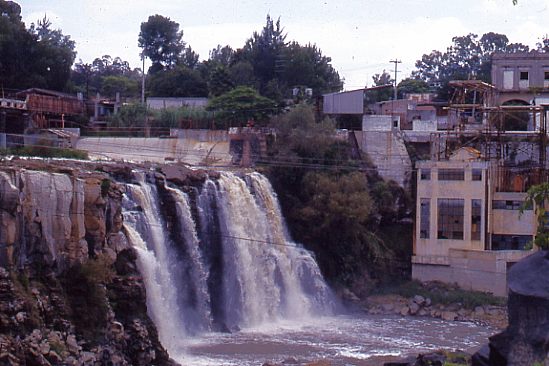
Geo-Mexico has repeatedly lamented the sad state of the Juanacatlán Falls, the “Niagara of Mexico”, near Guadalajara. More than a century ago, they were considered a national treasure. Indeed, in 1899, they were among the earliest landscapes to be featured on Mexican postage stamps.

In 2012, we reported that Greenpeace demands action to clean up Mexico’s surface waters. Greenpeace activists chose to protest at the Juanacatlán Falls to call attention to the poor quality of Mexico’s rivers and lakes. The activists cited government statistics showing that 70% of Mexico’s surface water was contaminated, mostly from toxic industrial dumping, rather than municipal sewage.

Greenpeace activists at El Salto de Juanacatlán, 22 March 2012. Photo: Greenpeace.

Greenpeace activists at El Salto de Juanacatlán, 22 March 2012. Photo: Greenpeace.

Last year, we returned to the theme and looked at how the Juanacatlán Falls had been transformed from the “Niagara of Mexico” to the “Silent River”.

Our concluding paragraph on that occasion bears repeating:

Is it too much to hope that the government, corporations and society in the El Salto area can all come together to remedy this appalling tale of willful mismanagement? Local residents are right to insist on the enforcement of existing water quality regulations and on the implementation of remedial measures to reverse the decline of this major river and its once-famous waterfalls. Even more importantly, urgent measures are needed to reverse the deteriorating public health situation faced by all those living or working nearby.

Finally, some good news. Author and activist John Pint, who has done far more than most to publicize the scenic wonders of Western Mexico (including dozens of places that fall way outside the usual tourist guides) reports that the inflow from the 66-km-long Ahogado River, one of the rivers that feeds into the Santiago River just before the Juanacatlán Falls is being cleaned up, with a dramatic, positive impact on the beauty of the Falls themselves. According to Pint’s first-hand report and photographs – Is Guadalajara’s most infamous waterfall now clean? – the smelly, toxic foam that has marred the Falls for decades has become a thing of the past. While this does not mean the water is completely clean, it is certainly an encouraging start.

The Ahogado River itself continues to receive pollutants, and its water remains heavily contaminated, but a  300-million-peso treatment plant, which apparently began operations in 2012, is removing some of the worse contaminants prior to the river joining the Santiago River. There is still a lot of work to be done here if the Juanacatlán Falls are going to be restored to their former pristine beauty, but Geo-Mexico is delighted to hear that progress is (finally) being made.

What a shame that it took the death of eight-year-old Miguel Ángel López in 2008, and years of adverse effects on the health of local inhabitants, before federal and state authorities took decisive action. Later this year, Geo-Mexico hopes to revisit the Falls for the first time in twenty years to see just how much they’ve improved. Watch this space!

Related posts:

The River Santiago and the Juanacatlan Falls: from the “Niagara of Mexico” to the “Silent River”

 Books and resources, Mexico's geography in the Press  Comments Off on The River Santiago and the Juanacatlan Falls: from the “Niagara of Mexico” to the “Silent River”
Jun 112015
 

In summer 1987, while living in Guadalajara, I entertained a fellow UK geographer, who arrived with a long list of places he wanted to visit. Over the next few weeks, we ticked them off one by one. Near the end of his visit, he asked why I hadn’t yet taken him to see the famous Juanacatlán Falls, the “Niagara of Mexico”, despite them being in his “top ten” places to see. “OK”, I said, “let’s go!”

Traffic was heavy and as we drove across Guadalajara, I could see his impatience building. Finally, he asked me, “Where are they? How close are we?” I replied that we were “fairly close” but that I was absolutely certain that he would recognize them before they came into sight. A few minutes later and he screwed up his nose and said, “Ughh. What’s that smell?” “See?”, I said triumphantly, “I knew you’d recognize them before you saw them!”

Juanacatlán Falls in 1989. Photo: Tony Burton. All rights reserved.

Juanacatlán Falls in 1989. Photo: Tony Burton. All rights reserved.

Even thirty years ago, long before NAFTA, the Juanacatlán Falls were a sorry sight (and source of a worse smell). Since then, and since NAFTA, they have only become worse. These once-majestic falls, the first Mexican landscape on a postage stamp back in 1899, have been reduced to a trickle of foul-smelling effluent. At the start of the twentieth century, the falls provided hydro-electric power for Guadalajara and turned the wheels of a cotton and woolen mill, the ruins of which now stand to one side.

A recent piece of investigative journalism about the River Santiago, the river which created these waterfalls, makes for disturbing reading. It provides plenty of evidence that the rapid increase in factories along the river, mainly post-NAFTA, may have provided 50,000 new jobs, but has also led to worsening water quality to the point where exposure to the river presents a serious public health risk.

In “River of Death“, Steve Fisher lays bare the terrible reality faced by those living and working close to the river. This is a harrowing tale, with heart-rending testimony from several local residents. On a positive note, the related video, Fusion Investigates: Silent River (below) describes how Sofía Enciso and her family have defied death threats and are determined to confront the factories responsible, while demanding that the relevant authorities take action to enforce federal water quality regulations, and start to clean up the river.

Perhaps the most telling single statistic is that precisely zero companies were fined for failing to comply with water discharge regulations between 2005 and 2011.

In the video, the mayor of El Salto, the main town near the Juanacatlán Falls, claims that the river has become polluted in the past thirty years. I guess he must be too young to remember that they were seriously polluted long before that.

Is it too much to hope that the government, corporations and society in the El Salto area can all come together to remedy this appalling tale of willful mismanagement? Local residents are right to insist on the enforcement of existing water quality regulations and on the implementation of remedial measures to reverse the decline of this major river and its once-famous waterfalls. Even more importantly, urgent measures are needed to reverse the deteriorating public health situation faced by all those living or working nearby.

Related posts:

Toxic spill in Sonora copper mine causes environmental disaster

 Other  Comments Off on Toxic spill in Sonora copper mine causes environmental disaster
Sep 112014
 

A toxic spill at a copper mine in the northwestern state of Sonora is the Mexican mining sector’s worst environmental disaster in recent history.

The mine is owned by mining giant Grupo México, Mexico’s largest mining corporation and operated by its Buenavista del Cobre division. Grupo México is the third largest copper producer in the world and has a rail transport division, Ferrocarril Mexicano (Ferromex), that operates Mexico’s largest rail fleet. The Buenavista del Cobre mine, part-way through a $3.4 billion expansion plan, has some of the largest proven copper reserves in the world and is the world’s fourth largest copper mine.

The spill allowed 40,000 cubic meters of toxic copper sulfate acid to enter the Tinajas stream in the town of Cananea on 6 August 2014. Buenavista del Cobre claimed the spill was the result of an unforeseeable heavy rain storm, which triggered a rise in the level of water and copper sulfate in a holding tank being constructed at the copper mine. Grupo México has formed a team of 20 experts from the University of Arizona and Mexican universities to investigate the spill.

However, an initial report by the National Water Commission (Conagua) determined that the spill was caused by a flawed polyethylene pipe at one of the mine’s leachate tanks, together with a faulty valve at another tank. Conagua attributed the environmental disaster to negligence on the part of the company. Mexico’s federal environmental protection agency (Profepa) reported that the contaminants from the spill included copper, arsenic, aluminum, cadmium, chromium, iron, manganese and lead.

Sonora-Copper-Mine-Spill-

Credit: Jesus Ballesteros/Expreso-Cuartoscuro.com

Mexico’s Environment Secretary Juan José Guerra Abud called it the “worst natural disaster provoked by the mining industry in the modern history of Mexico,” and confirmed that the spill contaminated not only the 17.6-kilometer-long (11-mile-long) Tinajas stream, but also the River Bacanuchi (64 kilometers in length), the River Sonora (190 kilometers long) and the El Molinito reservoir which stores 15.4 million cubic meters of water.

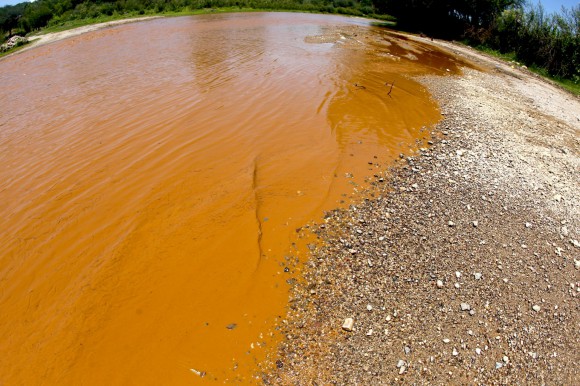
The contamination turned the waterways orange (see image) and affected the water supply of 24,000 people in seven communities along the rivers, forcing schools to close for several weeks while environmental authorities clean up the mess. More than 300 wells were shut down. The Sonora state government has been providing millions of liters of water via trucks to residents in the affected area. It has also started a temporary employment program to reactivate the local economy. The mining company has provided 13 million liters of water and $266,000 in immediate assistance to affected communities.

Some 800 mine workers, members of Mexico’s national mining and metallurgical workers union, blockaded the mine entrances in protest at the company’s failure to prevent the spill. Workers have been fighting over contracts since a strike in 2007.

The total clean-up costs are unknown, but likely to run into tens of millions of dollars.

On 18 August, Profepa filed a criminal complaint against Buenavista del Cobre and another Grupo México unit, Minera México, for their alleged roles in the spill. Grupo México could be fined up to 3.3 million dollars if the complaint is upheld.

Sonora State Governor Guillermo Padrés Elías has announced that the seven municipalities affected by the leached copper spill are filing a civil claim for damages.

Eight years ago in the northern state of Coahuila, an explosion in a coal mine belonging to Grupo México left 65 miners trapped underground; only two bodies were ever recovered.

Related posts:

Recent progress in waste water treatment in Mexico

 Mexico's geography in the Press  Comments Off on Recent progress in waste water treatment in Mexico
Aug 252014
 

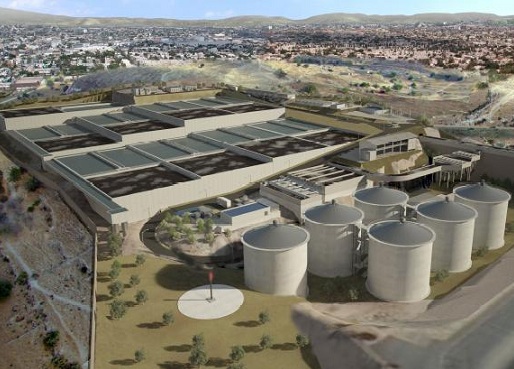
Two wastewater treatment plants have been in the news recently. The first is the $230 million Agua Prieta wastewater treatment plant, located north of Guadalajara in Jalisco, which was formally inaugurated last month. It is the first stage in a plan to restore the heavily polluted Santiago River back to health. The Santiago is the outflow from Lake Chapala and receives pollutants from the industrial zone of El Salto outside Guadalajara. The initial capacity of the Agua Prieta plant is 6,500 liters/second, almost all of which is returned to the river after treatment.

The plant was built by a consortium led by ICA subsidiary Conoisa, Atlatec, and Servicios de Agua Trident under a 20-year concession. President Enrique Peña Nieto claims on his government webpage that, “Integrated, sustainable water management is a government priority. The challenge is even greater because almost 50% of the wastewater returned to the environment does not undergo any form of treatment… The Agua Prieta Wastewater Treatment Plant in Zapopan… [will] improve the quality of life of 3.3 million inhabitants in the metropolitan area of Guadalajara… It will treat 82% of the wastewater in the area, and 100% when the complementary sewage works are completed.”

agua-prieta-wastewater-According to government figures, waste water treatment coverage at the national level is currently 50.3%, with a 2018 target of 63%. Agua Prieta has raised national coverage to 53.3%, and will boost it to 54.3% once the plant is operating at full capacity and treating 8,500 liters/second of wastewater. At the state level, Jalisco is now treating 32% of its wastewater.

The Agua Prieta plant is currently the largest of its kind in Mexico and is powered by biogas derived from the wastewater sludge. However, an even larger plant is under construction, in the state of Hidalgo in central Mexico. The Atotonilco Wastewater Treatment Plant is being built by a consortium, including Mexican construction companies ICA and IDEAL, Mitsui subsidiary Atlatec and Spanish firm Acciona Agua, that won the concession to design, build, and operate this plant for 22 years, at which point the plant will be transferred to federal ownership. Work began in 2010 and is due to be completed by 2015.

The Atotonilco Wastewater Treatment Plant will be the largest wastewater plant in Latin America and one of the largest in the world, with a biological treatment capacity of 23,000 liters/second (1.99 million m3/day). The wastewater treatment is performed by a series of conventional processes, with an additional chemical process during the rainy season. Treated waters from this plant are already being used in agriculture without any additional cleaning steps. The plant is self-sufficient in terms of energy usage, since it converts the methane offgas from the wastewater sludge into electrical energy.

Related posts:

Monitoring air pollution in Guadalajara

 Books and resources, Teaching ideas  Comments Off on Monitoring air pollution in Guadalajara
Jun 162014
 

Air pollution in the city of Guadalajara, the state capital of Jalisco, has worsened over the past decade, though there are some recent signs of improvement :

The Jalisco Environmental Agency now has a webpage where residents and travelers alike can now monitor Guadalajara’s air quality on an hourly basis. Readings for 10 stations are superimposed on a basemap on that page, together with links to graphs showing recent trends and other meteorological data. Tabs above the map also give a link to the current wind conditions across the city. Historical data (in Spanish) can also be accessed via the link to “Datos”.

Screenshot of Guadalajara air monitoring webpage

Screenshot of Guadalajara air monitoring webpage. Note: Two stations are shown as undergoing maintenance.

The map provides summary data in IMECAs, which stands for Índice Metropolitano de la Calidad del Aire (Metropolitan Index of Air Quality). IMECAs are a compound index combining measurements of concentrations of ozone (O3), sulphur dioxide (SO2), nitrogen dioxide (NO2), carbon monoxide (CO) and particles smaller than 10 micrometers (PM10).

In Guadalajara, formal smog alerts are issued if average readings rise above 150 IMECAs (“Very Bad”) for more than two consecutive hours. If readings rise above 200 IMECAs (“Extremely Bad”), then “serious alerts” impose restrictions on vehicle use and may lead to the suspension of school classes.

In Guadalajara, the worst air quality tends to be in the southern and eastern sections of the city. It also tends to occur in the months of April and May, immediately before the rainy season gets underway. The webpage system gives everyone an easy way to check these assertions!

In Guadalajara, mitigation efforts are centered mainly on reducing vehicle emissions (partly by stricter emissions testing and verification, and partly by improvements to the public transport network) since they are the main source of pollution. To date, there are no plans in Guadalajara to introduce a “Day without car” program similar to that in Mexico City:

Teaching idea

Use the Jalisco Environment Agency webpage to monitor Guadalajara’s air pollution and identify any patterns or trends related to air pollution in the city. Consider suggesting one or more hypotheses, such as “Air pollution gets worse in the afternoon”, or “The level of air pollution in eastern Guadalajara is worse than in western Guadalajara”, before testing your ideas using the online data.

Related posts:

Pemex works at its Clean Fuels Policy

 Mexico's geography in the Press  Comments Off on Pemex works at its Clean Fuels Policy
May 222014
 

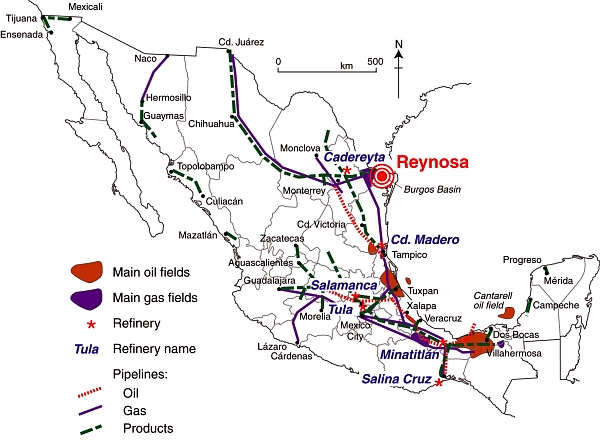
As part of its Clean Fuels Policy, Pemex is modernizing its refineries in Ciudad Madero, Minatitlán, Salamanca, Salina Cruz and Tula.The total investment involved is 3.4 billion dollars. The plan, which will take 4 years to complete, includes the construction of new plants in several of the locations

Pemex installations in Mexico. (Adapted from Fig 15.5 of Geo-Mexico). All rights reserved.

Pemex installations in Mexico. (Adapted from Fig 15.5 of Geo-Mexico). All rights reserved.

The objective is to produce Ultra Low Sulfur diesel fuel (UBA) in the five refineries, in compliance with Mexican standards. The new technology will reduce vehicle emissions of carbon dioxide and nitrogen oxides by between 50 and 80%.

Since last September, 42,500 barrels/day of ultra low sulfur gasoline is already being produced at the Pemex refinery in Cadereyta, Nuevo León.

Related posts:

Apr 282014
 

Environmental noise is everywhere in Mexico, from traffic and fiestas to garbage collection and gas delivery. For more examples, see The distinctive sounds of Mexico’s towns and cities and The Sounds of Mexico. The traffic whistles made by police are an important subset of the sounds in any Mexican town or city. They have a mini-language of their own, explored in this MexConnect article: Did you know that different traffic whistles in Mexico mean different things?

This 3 minute Youtube video is a fun introduction to some of the Sounds of Mexico City though it must be admitted that some of the sounds are far more melodious than others:

Sounds and whistles may be very useful, but exposure to environmental noise can have deleterious effects on an individual’s well-being. Research in many countries has supported legislation to limit people’s exposure to loud noise on the grounds that such exposure can seriously damage health. Working days are lost and the resulting healthcare costs are considerable.

For example, a Spanish group, The National Association Against Noise Pollution, claims that the volume of music blasting out of automobile speakers makes many of that country’s younger generation “candidates for deafness”. The Association has lobbied for “coherent and efficient” legislation to prevent this modern urban environmental problem. It wants buildings with improved sound insulation and building codes which take account of the “sound maps” of each city.

Environmental noise, even if not sufficiently loud to damage our hearing, can make communication much more difficult, not to say frustrating, and can also interfere with our concentration, increasing the likelihood of potentially dangerous situations in the workplace or on the road. Excessive noise can increase stress and provoke fatigue.

What level of noise is safe? Three factors come into play. First, how intense, or loud, the noise is. This “noise level” is relatively easy to record and is measured in decibels (dB). The second factor is how long the noise lasts – the duration of any particular noise makes a huge difference to its effects on our hearing system. This is also relatively easy to quantify. The third factor – our individual susceptibility to noise – remains extremely difficult to predict in advance, meaning that noises that prove innocuous for some members of the family may permanently damage the hearing of others.

The following list indicates the peak decibel level (dBA) of various recreational and environmental noises:

  • Normal breathing: 10
  • Average home interior: 50
  • Conversational speech: 65
  • Vacuum Cleaner: 85
  • Lawn Mower: 95
  • Video Arcade: 105
  • Car horn: 110
  • Center of Guadalajara: 110
  • Screaming child: 115
  • Chain saw: 125
  • Automobile Stereo: 125-155
  • Fireworks (at range of 3 feet or 1 meter): 162
  • Hand gun:  165

This list clearly suggests that it is unwise to spend all day mowing the lawn or vacuuming your house, let alone using a chain saw or cruising the streets with your car stereo turned up high!

The World Health Organization (WHO) currently considers that 65 decibels (65 dB) should be the maximum noise level to which people are exposed for any prolonged period of time such as a working day. It estimates that at least 120 million people worldwide, mainly city residents, are suffering from hearing problems caused by exposure to excessive noise.

Mexico’s official noise norm NOM-081-SEMARNAT-1994 was first published in 1995 and follows the WHO guidelines. By comparison, the U.S. Occupational Safety and Health Administration standards are a maximum 8 hours exposure to 90 dB, 2 hours exposure to 100 dB, 1 hour to 105 dB or 15 minutes to 115 dB.

noise-chartIn November 2013, Mexico modified the technical details attached to its noise norm, and issued a new chart (see above) showing the maximum permitted noise levels in a variety of different settings. Note that the limits apply to “fixed sources” of noise, not to the occasional passing vehicle with loud-speakers!

The new rules are welcome. As John Pint eloquently puts it in New Federal Norms list decibel limits, this legislation “gives ordinary people a chance to defend themselves from Acoustic Terrorism.”

Related posts:

Nov 062013
 

Mexico City and its surrounding areas have a strict “Hoy no circula” (“Today you can’t drive” or “Day without a Car”) program. The program is intended to reduce air pollution from vehicle emissions.

Day without a car table

The graphic shows the major rules for most vehicles. With few exceptions, these rules apply to all tourist vehicles as well as Mexican-plated vehicles.

Click here for a Wikipedia article with more details of the rules, including Saturday rules and exceptions

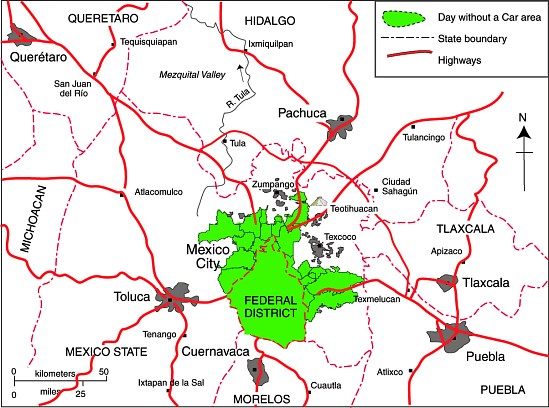
Area subject to “Day without a Car” rules, November-2013. All rights reserved.

As of November 2013, the “Hoy no circula” program applies to the Federal District and the following 18 adjoining municipalities in the State of Mexico (see map):

  • Atizapán de Zaragoza
  • Coacalco de Berriozabal
  • Cuautitlán
  • Cuautitlán Izcalli
  • Chalco
  • Chimalhuacan
  • Chicoloapan
  • Ecatepec de Morelos
  • Huixquilucan
  • Ixtapaluca
  • La Paz
  • Naucalpan de Juárez
  • Nezahualcóyotl
  • Nicolás Romero
  • Tecámac
  • Tlalnepantla de Baz
  • Tultitlán
  • Valle de Chalco Solidaridad

No responsibility or liability is assumed for any situation arising from the information contained within this post, which is believed to be accurate at the time of writing. For more details about the growth of Mexico City, and its urban issues and management strategies, consider buying a copy of Geo-Mexico: the geography and dynamics of modern Mexico, available from all good bookstores, as well as via amazon.com or this webpage.

Aug 052013
 

A recent study published by the Clean Air Institute analyzed air pollution in 22 Latin American cities:

  • Air Quality in Latin America: An Overview (May 2013; pdf file)

Six Mexican cities were included in the study: Mexico City, Guadalajara, Monterrey, Puebla, Ciudad Juárez and León. However, only limited data were available for Puebla, Cd. Juárez and León. One of the main conclusions of the study is that Mexico has about the worst urban air pollution in Latin America. It is believed to be responsible for about 15,000 deaths in Mexico each year.

The focus was on the following air pollutants:

  1. Particulate matter is divided into two measures; particles less 2.5 microns in diameter (PM2.5) and those less than 10 microns (PM10). PM2.5 pollution is extremely harmful because it penetrates deep into lungs causing inflammation and worsening heart and lung diseases. This can be fatal.
  2. Ozone is formed in the air when oxides of nitrogen and volatile organic compounds mix with intense sunlight. The very intense sunlight in Mexican cities makes them particularly prone to ozone pollution.
  3. Nitrogen dioxide (NO2) is caused by high temperature combustion of fossil fuels in vehicles, factories and power plants. It can aggravate lung diseases as well as contribute to ozone and fine particle pollution.
  4. Sulfur dioxide (SO2), which also comes from burning fossil fuels, contributes to heart and respiratory disease. Unfortunately, not all of the 22 cities had data on all four pollutants. Consequently comparisons among cities are a bit limited.

According to the study, Mexican cities had some of the worst urban particulate pollution in Latin America, significantly above WHO standards. Of the 16 cities with data, Monterrey had by far the worst PM10 pollution with 85.9 micrograms per cubic meter (ug/m3); considerably worse than the perennially dusty Lima with 62.2 ug/m3. Guadalajara came second with 70.1 ug/m3, Mexico City was 6th with 57.0 ug/m3, and León placed 11th with 39.0 ug/m3, even worse than Sao Paulo at 36.5 ug/m3. Though not in the study, Mexicali has worse PM10 pollution than Monterrey. Also Monterrey’s PM10 levels are much better than many major world cities including Cairo, Delhi, Kolkata, Beijing, Chengdu, Bangalore, Shanghai, Dacca, Jakarta, and Karachi.

Mexico City air quality in 1980 (Photo: Tony Burton)

Mexico City air quality in 1980 (Photo: Tony Burton)

Mexico did a bit better with respect to the more serious PM2.5. Of the 11 cities with data, Bogota was worst with 35.1 ug/m3 followed by Lima at 31.5ug/m3 and San Salvador and Montevideo at 28.0 ug/m3. The two Mexican cities with data, Mexico City (26.2 ug/m3) and Monterrey (25.9 ug/m3) were 6th and 8th.

Mexican cities also have some of the highest levels of ozone pollution. Of the ten cities with data, five of the six worst were Mexican cities. Guadalajara had the highest ozone pollution with 69.3 25.9 ug/m3 followed closely by León 68.9 at ug/m3. Mexico City was 4th (59.4 ug/m3); Monterrey was 5th (55.2 ug/m3); and Cd. Juárez came 6th (46.3 ug/m3), just ahead of Quito (44.1). Much better ozone levels were recorded by Sao Paulo (36.0 ug/m3), Santiago (28.8 ug/m3) and Bogota (21.1 ug/m3).

Cities in Mexico also had high levels of nitrogen dioxide. The highest levels were in Montevideo (70.0 ug/m3), but Guadalajara (57.2ug/m3), Mexico City (54.2 ug/m3) and León (45.5 ug/m3) placed 2nd, 3rd and 4th worst among the 14 cities with data. Monterrey was much better with the third lowest nitrogen oxide level (29.0 ug/m3), trailing only Lima (12.8 ug/m3) and Quito (23.3 ug/m3).

Mexican cities were also among the worst in terms of sulfur dioxide pollution. Of the 13 cities with data, León had by far the highest level with (23.4 ug/m3), followed by Medellin (16.0 ug/m3). Mexico City was 3rd worst (15.3 ug/m3); Monterrey was 4th (13.1 ug/m3); and Guadalajara was 6th (8.6 ug/m3).

In summary, the study indicates that Mexico has about the worst urban air pollution in Latin America. Fortunately, Mexico City, which used to be considered one of the most polluted cities in the world, has significantly improved its air quality in the last few decades. (see Rhoda and Burton, Geo-Mexico: The geography and dynamics of modern Mexico, p 177)

On the other hand, other major cities in Mexico have not had the same experience. The data in this study appear to suggest that among Mexico’s three biggest cities, Guadalajara has the worst air pollution followed by Mexico City and then Monterrey. (This study found insufficient data for comparisons with Puebla, Cd. Juárez and León.)

Other posts on urban air pollution:

Case study of the June 2013 ecocide in Hurtado Reservoir, Jalisco

 Mexico's geography in the Press  Comments Off on Case study of the June 2013 ecocide in Hurtado Reservoir, Jalisco
Jul 042013
 

This post presents a short case study of the dramatic ecocide in the Hurtado Reservoir in Jalisco a week ago that resulted in the sudden death of between 200 and 500 tons of fish.

What?

  • The ecocide killed between 200 and 500 tons of fish
  • 30 local residents were affected by gastrointestinal problems
  • 15 of them required treatment in local health centers

Where?

The ecocide occurred in the Hurtado Reservoir (Presa del Hurtado, aka the Valencia Dam) in Jalisco, mid-way between the villages of San Isidro Mazatepec and Bellavista, the location of a sugarcane mill (see map). The reservoir can hold up to 8,000,000 cubic meters of water. The two municipalities involved are Acatlán de Juárez and Tlajomulco de Zúñiga. The most affected community is the small village of San Pedro Valencia (about 300 inhabitants),

Location of Hurtado Reservoir (extract from INEGI 1:250,000 map)

Location of Hurtado Reservoir (extract from INEGI 1:250,000 map)

When?

The first reports were made on 25 June when a local government official in San Pedro de Valencia, in the municipality of Acatlán de Juárez, reported to state environmental protection officials that the water in the Hurtado Reservoir was contaminated with something smelling like molasses. Within 48 hours, officials had identified the source, and had conducted a formal inspection, reporting that the water was dark brown in color and contaminated with molasses.

Why?

According to press reports, an unlicensed firm in nearby Potrero los Charros was using molasses (a by-product of sugarcane mills) as an ingredient to make cattle food. Some of the molasses (melaza) was dumped into the San Antonio stream which carried them into the reservoir.

The problem arose because molasses have a very high biochemical oxygen demand (BOD). This means that they require large amounts of oxygen as they decompose. In this case, they required more oxygen than was available in the water in the reservoir, reducing the water’s dissolved oxygen content, effectively depriving all aquatic life of oxygen. While final results are pending, the fish are believed to have died of oxygen starvation.

Effects

  1. The local fishing cooperative of the Hurtado Reservoir has agreed to accept a moratorium on catching, selling or consuming local fish. The fishermen normally catch and market about 100 kg of fish a day.
  2. Health services are offering vaccinations to local residents and all those involved in the environmental clean-up.
  3. 18 local restaurants are closed until further notice. When they reopen, they will likely have to purchase fish from further away (eg the fish market in Guadalajara) at a higher price than they previously paid for local fish
  4. About 100 fish traders in nearby towns (including Tala, Acatlán de Juárez and Villa Corona) have lost a source of income.

Responses

  1. Within 48 hours of the first report, authorities had ordered the business responsible for the pollution to take immediate remedial action. Meanwhile, authorities began to clean up the dead fish. The fish are being buried in a 30 meter by 2 meter trench about one km away from the lake.
  2. Federal officials from the National Water Commission and the Environmental Secretariat were quickly on the scene; they promised access to federal financial assistance.
  3. Most of the clean up was carried out by about 100 local fishermen and volunteers, including firefighters.
  4. State health officials have closed the 18 small fish restaurants near the lake until further notice
  5. Local officials are also cleaning up the storage area, using tanker trucks to remove an additional 8,000 tons of molasses for appropriate disposal elsewhere.
  6. The municipality of Tlajomulco has issued the owner of the company with a fine of about 1.5 million pesos ($120,000) and further legal action is underway.

Remediation

  • Environmental expert Gualberto Limón Macías estimates it will take between two and four years to rehabilitate the reservoir. The priority is to re-oxygenate the water, possibly using solar-powered pumps, and seed the reservoir with young fish.
  • The University of Guadalajara has promised to arrange for a team of experts to provide specialist advice about how best to rehabilitate the lake.

Related posts:

May 272013
 

Kudos to the Earth Island Institute for responding to the many criticisms we and others made of a blog article (“Water Pollution Plagues Mexico’s Scenic Pacific Coast”) by pulling it from their website. The following post has been edited to reflect that fact.

Water quality is a serious concern in many parts of Mexico and Geo-Mexico regularly includes short articles about the main issues as well as case studies related to water pollution (see “Related posts” below).

Ron Granich, a regular Geo-Mexico reader who lives in Pátzcuaro (Michoacán) and recognizes our keen interest in Mexico’s water quality kindly drew our attention to a recent article published on the website of the Earth Island Journal. Sadly, the blog article left much to be desired. The article was subtitled, “Tourists largely unaware that industrial pollution from rivers upstream is making them sick”, and attempted to argue that the pollution of Mexico’s Santiago River is a direct cause of the poor water quality of beach towns such as Sayulita.

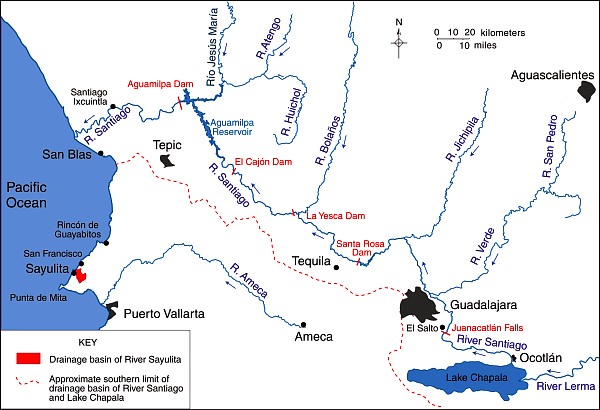
The slight problem with this thesis is that the Santiago River flows nowhere near Sayulita and has no connection to the miniscule Sayulita River, far to its south (see map). There is no question that the Santiago is polluted. It collects serious pollutants from the major industrial area of El Salto (a short distance southeast of Guadalajara) and from Guadalajara, and from many smaller settlements along the way. More contaminants are added near its mouth, where the swampy delta has been transformed into productive fields, including tobacco plantations.

Main rivers of Western Mexico.

Map of the main rivers of Western Mexico. Credit: Tony Burton / Geo-Mexico; all rights reserved.

Pollution of the River Santiago is particularly evident at the Juanacatlán Falls near El Salto:

After the Juanacatlán Falls, the Santiago flows in a deep, steep-sided canyon for most of its course (which explains why no fewer than three major dams for hydro-electric power have been built along this stretch, including the one at La Yesca) before meandering across its delta to flow into the Pacific Ocean a short distance north of San Blas.

The Santiago River has no conceivable influence on the pollution levels in the rivers near Sayulita and San Francisco or indeed on beaches in their vicinity. This is not to say that those beaches are clean. The beaches of the Nayarit Riviera may indeed have high levels of Enterococcus spp, as we reported recently when looking at the murky world of water statistics in Mexico.

Note on clean water standards in Mexico and the USA:

It is sometimes argued that Mexico and the USA have different standards for what represents “clean water”. For marine (beach) environments, the U.S. limit is 35 Enterococci per 100 ml. of water, and is based on calculating a geometric mean of counts performed over a five week period. This method greatly reduces the impact of peak Enterococci counts. However, the Mexican limit of 100 Enterococci/100 ml. is based on a single sample maximum value. As explained in this US EPA technical document, Water Quality Standards for Coastal Recreation Waters: Using Single Sample Maximum Values in State Water Quality Standards, the two limits are approximately equivalent in terms of water quality. In other words, a geometric mean of 35 Enterococci/100 ml. means that the water is about as clean as a single maximum value of 100 Enterococci/100 ml.

Water quality IS a major concern in much of Mexico, and we applaud the Earth Island Institute for seeking to draw attention to the issues involved, and for their recent action in removing the original article, which helps to ensure that discussions of these issues are based on facts and not on misconceptions.

As always, we welcome discussion about this (and all our posts) via the comments feature. If the comments feature is not visible, simply click the title of the relevant post, and scroll down.

Related posts:

Swim at your peril through the murky data for Mexico’s beaches

 Other  Comments Off on Swim at your peril through the murky data for Mexico’s beaches
May 062013
 

In the past few months, it has become harder than ever to assess the cleanliness of Mexico’s beaches. Alejandro Calvillo, director of the consumer rights organization “El Poder del Consumidor” recently published an alarming blog post alleging that Mexican authorities have gone to considerable lengths in recent months to mask the true state of Mexico’s contaminated beaches. (Playas contaminadas en México, un secreto de Estado)

Drain on Mocambo Beach, Veracruz. Credit: La Voz del Sureste.

Drain on Mocambo Beach, Veracruz. Credit: La Voz del Sureste.

Calvillo explains that for several years, government agencies published regular monthly statistics relating to the cleanliness of all the country’s major swimming beaches. While some people queried the veracity of some figures, at least the data was publicly available, and provided some starting point for analysis and discussion. Indeed, this data allowed us to write in Geo-Mexico (p 46) that,

“Coastal waters are also regularly monitored for contamination. The percentage of Mexico’s resort beaches that met national water quality norms rose from 93.7% in 2003 (when 226 beaches in 35 destinations were tested) to 98.4% in 2007 (276 beaches in 46 destinations). Seawater at all coastal resorts is now well within the national standard except for Ixtapa-Zihuatanejo on the Guerrero coast.”

However, soon after the new administration (of president Enrique Peña Nieto) took office, Calvillo claims that a decision was made to cease releasing regular monthly data for beach contamination and to remove the historical time series of beach cleanliness data from government internet sites (such as those of the Health Secretariat and Environment Secretariat). Fortunately, Calvillo’s claims are not the whole truth. Data are still being published for many beaches, via an interactive webpage titled Playas Limpias (Clean Beaches) hosted by the Health Secretariat. However, it does appear to be true that the historical series of pre-2013 data have vanished, and that no data is available, even in 2013, for several beaches that were previously regularly monitored.

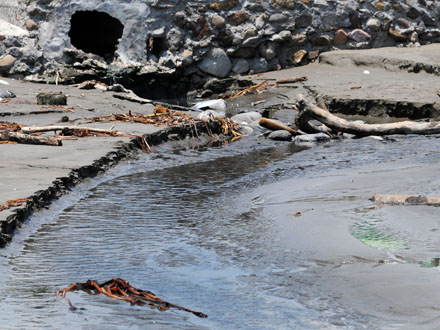
There is no doubt that in recent years hundreds of Mexican beaches have on occasion had excessive levels of Enterrococos faecalis, the main bacteriological indicator. (About a decade ago, counts of Enterococcus spp. replaced fecal coliform counts as the best way to assess the water quality at public salt water beaches.) The major source of contamination, despite years of campaigning by environmental groups, comes from hotels, towns and cities that continue to dispose of their effluent directly into the sea, often in close proximity to popular swimming beaches (see photo). Progress has been made in some states, including Jalisco, Nayarit and Veracruz, but there is still a long way to go.

water quality on beaches

Water quality on Mexican beaches, 2011. Source: Atlas Digital del Agua México 2012;
(green=good; yellow=moderate; red=poor)

Calvillo writes that official reports in 2011 (see map) listed 99 beaches where Enterococus levels had been found in excess of 200 Enterococci/100 ml of water on at least one occasion. Values over 200 Enterococci/100 ml are considered to pose a “health risk”, according to Mexican norms. Of these 99 beaches, 70 were on the Pacific coast. The worst beaches included 1 in Baja California Sur (La Paz), 4 in Nayarit (including Sayulita, Rincón de Guayabitos), 3 in Jalisco (including Playa del Cuale in Puerto Vallarta), 10 in Michoacán (including Caleta de Campos, Chuquapan and Playa Nexpa) and 3 in Guerrero. In the worst locations, the Enterococci count was over 20,000/100 ml.

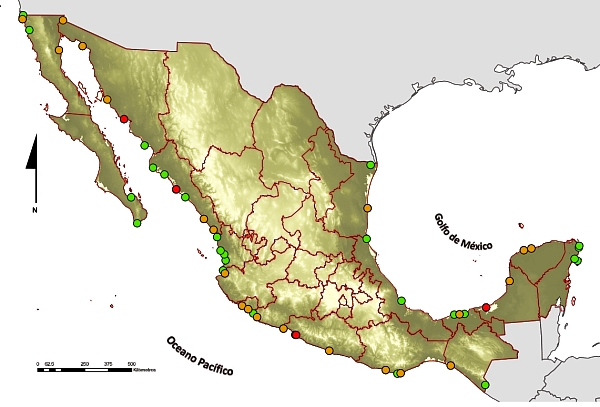
Of the 29 beaches with excessive values on the Gulf of Mexico and on the Caribbean coast, the most polluted were on the Gulf of Mexico, including locations in Tamaulipas, Veracruz and Campeche.

In summer 2012, the 22 beaches that posed a health risk according to the data included Regatas (Veracruz), Rincón de Guayabitos (Nayarit) and Playa Carabali (aka Playa Hornos) in Acapulco (Guerrero).

Despite having made less data available for 2013, in the days leading up to the 2013 Easter vacation period, federal and state government officials repeatedly stressed that all beaches were clean and ready to receive the anticipated hordes of holidaymakers. It is difficult to assess the accuracy of these claims in the absence of more data. Were the beaches really clean, or were tourists in some destinations risking potentially serious gastrointestinal and other diseases every time they went swimming?

Adding another layer of complexity to interpreting the statistics is the fact that several states have massaged the data tables by selectively changing the names of some beaches, and omitting others. For example, Calvillo points out that in 2011 the state government of Veracruz renamed four beaches that had previously experienced high pollution levels so that their historical records would be hard to find:

  • Costa de Oro I became Gaviota II
  • Iguana Norte was renamed Tortuga II
  • Iguana Sur became Pelícano II
  • Penacho del Indio was renamed Pelícano I.

In 2012 Veracruz removed two beaches from its list completely: Iguana Centro and Acuario, which it deemed “no longer of interest to tourists,” perhaps because its 2009 count was a record-breaking 159,490 Enteroccocus/100 ml.

Veracruz is not the only state to have “tweaked” its data. Jalisco decided (in 2009) not to monitor either Conchas Chinas or Boca de Tomatlán, both of which had registered high levels of contamination in previous years. In the state of Guerrero, the main beach in Zihuatanejo (historically one of the most polluted beaches) has not been monitored since 2011 because of “technical problems”. [Note: Measurements began again here in 2013, at about the time this post was first published.]

The moral of this post? The absence of data for any particular beach should not be taken as indicating that it is not contaminated. On the contrary, the absence of data might perhaps better be interpreted as a sure sign that the beach HAS or MIGHT HAVE a problem!

Related posts:

Pemex boosts reserves and reduces its emissions

 Mexico's geography in the Press, Updates to Geo-Mexico  Comments Off on Pemex boosts reserves and reduces its emissions
Dec 032012
 

It may come as something of a surprise to many observers, but during 2012, Mexico’s state-owned oil company Pemex (Petróleos Mexicanos) has received several well-deserved plaudits for its efforts to slash the emissions associated with oil and gas exploration, reserves and production.

For the fifth consecutive year, the Global Reporting Initiative awarded Pemex the highest possible rating for social responsibility. The company also received excellent ratings for sustainable asset management. During 2011, Pemex’s proven reserves increased 1.1%, while the petro-giant cut total emissions by 17.3% compared to the previous year. Crude oil output averaged 2.55 million barrels a day in 2011. Carbon dioxide emissions were down 8.8% in 2011, while sulfur oxides have now fallen more than 50% since 2007.

Meanwhile, the production division of Pemex has been praised by World Bank experts for having reduced burn-off from its giant Cantarell gas field from 31% in 2008 to 3% in July 2011. Pemex has invested more than 1.6 billion dollars in the Cantarell field over the last six years in order to improve efficiency, with the installation of compressors, flow separation devices and re-injection technology. In the past three years, it has reduced total emissions, including greenhouse gases, from 13.6 billion cubic meters a year to 2.1 billion. Pemex is well on track to beat its target of 99% efficiency in gas recovery by 2014.

Crude oil production has risen steadily in 2012. For example, in August 2012, Pemex produced 2.56 million barrels of oil a day (b/d), its highest output since May 2011. The Chicontepec field in Veracruz is doing especially well. Its single best-performing well, named Presidente Alemán 1565, uses innovative technology, including three dimensional seismic mapping and horizontal drilling, to yield as much as the combined output of 28 other wells in the region.

Mexico’s current 3P (proven, probable, possible) reserves are also on the rise, and currently total 43 billion barrels of crude oil equivalent. After years of depletion, Pemex is now adding more oil and gas each year to its reserves than it is extracting. The oil giant recently announced a huge deep water, light crude discovery in the Gulf of Mexico, off the coast of Tamaulipas, its first major find in the Perdido Fold Belt, where the total 3P reserves could be as high as 10 billion barrels. The Trión-1 well, drilled to a total depth of 4,500 meters (14,800 feet), is 40 km (25 miles) inside Mexico’s territorial waters and is expected to yield up to 400 million barrels of high quality crude.

Pemex also recently reported the largest land-based discovery of oil for about a decade. The Navegante-1 well, drilled in the South-East Basins 20 km from Villahermosa (Tabasco) found light crude oil with an APR gravity of 45 degrees, at a depth of 6800 meters. The field is 87 square kilometers in area and has estimated 3P reserves of about 300 million barrels of crude oil equivalent.

Related posts:


The geography of tequila: trends and issues

 Other  Comments Off on The geography of tequila: trends and issues
Sep 152012
 

The production and export of tequila has been one of Mexico’s major agro-industrial success stories of recent times. In this post, we look at some of the related trends and issues.

Rapid rise in production

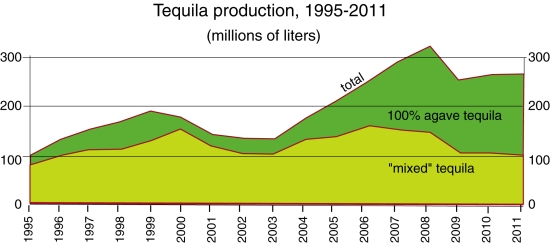
For the period 2009-2011, Mexico produced about 250 million liters of tequila a year. Of this total, 60% was “100% agave tequila“, where all the sugars are directly derived from the Agave tequilana weber azul, and the remaining 40% was “mixed tequila” (tequila mixto) where at least 51% of the sugars are from Agave tequilana weber azul, but the remaining sugars come from other non-agave sources.

Tequila production, 1995-2011. Data: Tequila Regulatory Council.

Tequila production, 1995-2011. Data: Tequila Regulatory Council.

This is a dramatic increase compared to the period 2001-2003, when the average production was about 140 million liters a year. During that period, 100% agave tequila contributed only about 20% of the total. The relative importance of 100% agave tequila has clearly increased very rapidly in the past decade.

Agave supply: from shortage to glut

While there is a clear upward trend in total production, there are periods where production has fallen, most recently from 2008 to 2009, when production fell by 60 million liters. One of the possible reasons for a short-term blip in tequila production is if there is a shortage of agave. Agaves take about 10 years to mature, so there is a lengthy time lag between planting and the first harvest of newly planted areas.

As demand for tequila has risen, some of the major producers have experienced temporary shortfalls and been unable to source as much agave as they would have liked. One of the consequences was that independent agave producers entered the market, seeking to profit from such periods. Such independent producers could do well, provided they were able to predict agave shortages a decade in advance. During the 1990s, hillsides all over Jalisco were planted with agave, many for the first time, providing a significant boost to agave supply a decade later.

Not all independents came out of this on top. The supply of agave now exceeds demand. Many of the major tequila companies have increased their own acreage of agave, or have signed forward-looking contracts with major independent growers in other areas of the designation of origin zone. Many independent agave farmers are losing out; they planted agave a decade ago, but failed to forecast the current glut.

Tequila makers currently consume about 1 million metric tons of agave a year. The Agriculture Secretariat estimates that there are about 20,000 independent growers who have no contracts, and 223 million agave plants of diverse ages for which there is no current or short-term market. As many as 30 million agave plants were considered “very mature” in 2009 and a total loss in 2010. It is likely to be several years before the production of agave falls back to a level sustainable with demand.

Exports continue to rise

Tequila exports have risen very rapidly since 2001, with only minor anomalies along the way. Mexico currently exports about 160 million liters a year. Tequila exports have performed well despite the now lengthy economic woes being experienced by the major importing countries.

Foreign ownership

Mexico’s tequila makers have undergone a similar experience to the country’s major brewing companies, in that all but one of the major tequila firms are now owned by foreign corporations. A proposed deal in which the last of the big Mexican tequila companies, José Cuervo, would also have been taken over by British firm Diageo (which owns Baileys, Johnnie Walker, J&B, Smirnoff, Captain Morgan and Guinness) was called off in December 2012.

Environmental concern

The major environmental problem associated with tequila making is wastewater. For every liter of tequila, 10 liters of wastewater (vinazas) are produced. The vinazas are nitrogen-rich, and contain high concentrations of chemicals, including heavy metals and salt.

The National Chamber of the Tequila Industry recognizes that only about 60% of vinazas are disposed of properly. Most of the remaining 40% (about 2.5 billion liters in 2008) are thought to be pumped untreated into local streams and ponds, damaging the ecosystem and destroying stream life.

The Mexican government fines distilleries that do not have adequate treatment plants for the vinazas they produce, but in the past many companies have opted to pay the fines rather than solve the problem at source.

The vinazas problem was one of the reasons why UNESCO recently considered revoking the Tequila region’s World Heritage status, awarded in 2006. Another issue that made UNESCO unhappy was a recent decision to locate a landfill site in Amatitán in the center of the World Heritage zone. In the end, UNESCO officials agreed that progress was being made; the area kept its heritage status.

There is hope on the horizon. A new cost-effective option for tequila firms seeking to dispose of viñazas has been developed by a local corporation Tecnología Nacional de Aguas. Called Proshiemex, it uses the viñazas to produce methane-rich biogas which can contribute to heating the boilers of the tequila distilleries. The remaining sludge can be easily treated in accordance with all applicable environmental norms.

Source of data:

  • Tequila Regulatory Council Statistics

Related posts:

Two examples of Mexico-USA trans-border water pollution

 Mexico's geography in the Press  Comments Off on Two examples of Mexico-USA trans-border water pollution
Aug 092012
 

In a previous post – Update on the severe drought in northern Mexico – we mentioned two cases where water was being transferred across the Mexico-USA border and where it was proving impossible to meet the terms of existing water treaties in the face of the severe drought in northern Mexico and the southern USA.

In this post, we look at two examples where the major trans-border concern is about water quality not quantity.

Case 1: The New River, California

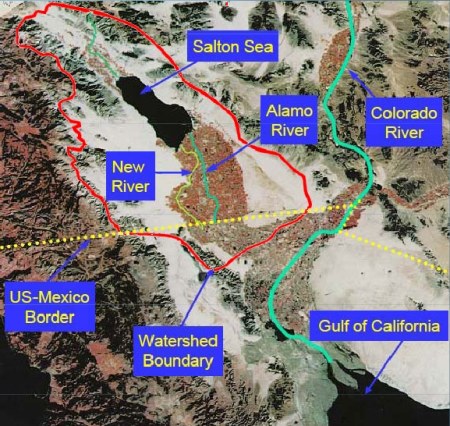
The New River begins in Mexico as the Río Nuevo and receives agricultural runoff and industrial and domestic wastewater from the 1,000,000 or so residents of the metropolitan area of Mexicali, where a water treatment plant now operates. The New River then crosses the border northwards into California (west of the Colorado River) and flows into that state’s largest lake, the Salton Sea. The New River is about 130 kilometers long, with only the first 25 kilometers in Mexico.

The trans-border drainage basin of the New River

The trans-border drainage basin of the New River. Credit: IBWC.

The New River has a long history of high pollution levels, well documented in this Wikipedia entry: New River (Mexico – United States) and is possibly the most polluted river of its size anywhere in the USA. It is also one of the routes used by undocumented migrants entering the USA, as pointed out in this 2-minute video:

The California-Mexico Border Relations Council’s technical advisory committee recently announced a strategic plan to start cleaning up the polluted waters of the New River. In the Californian border city of Calexico, the plan calls for the installation of a 90-million-dollar water disinfection system and trash screens. Downstream, it also includes the creation of water-filtering wetlands in parts of the Imperial Valley, one of the USA’s most important agricultural areas. The strategic plan will also develop an integrated water quality monitoring and reporting program, so that changes in water quality can be quickly traced to source and any necessary cleanup measures can be implemented. The condition of the New River has been improving in the past decade, but much work remains to be done.

Case 2: Wastewater in Nogales, Arizona.

Further east along the border, Arizona state officials are suing the International Boundary and Water Commission (IBWC) for violations to the United States Clean Water Act, alleging that untreated Mexican industrial wastewater, mixed with domestic sewage, continues to cross the USA-Mexico border into the city of Nogales, Arizona. The suit claims that the wastewater has levels of cadmium, cyanide and ammoniacal nitrogen well above legal limits. The Arizona Department of Environmental Quality is demanding that the IBWC install an industrial waste treatment system at the Nogales International Wastewater Treatment Plant.

Related posts:

Greenpeace demands action to clean up Mexico’s surface waters

 Mexico's geography in the Press  Comments Off on Greenpeace demands action to clean up Mexico’s surface waters
Apr 052012
 

Greenpeace activists chose the Juanacatlán Falls (“The Niagara of Mexico”) for their latest protest to call attention to the poor quality of Mexico’s rivers and lakes. They cited government statistics that show 70% of Mexico’s surface water is contaminated. Most of the pollution comes from industrial dumping, rather than municipal sewage.

It is hard to imagine a better choice. The activists, clad in protective clothing and wearing masks to avoid inhaling toxic gases, paddled kayaks into the River Santiago immediately below the malodorous falls and unfurled banners with slogans such as “Mexican rivers, toxic rivers” (see image).

Greenpeace activists at El Salto de Juanacatlán, 22 March 2012. Photo: Greenpeace.

The activists called on the government to commit to a policy of zero dumping of toxic substances into rivers and lakes by 2020, with sanctions for actions leading to pollution and its effects.

In a coordinated action, thirty NGOs in Jalisco announced the creation of the “Broad Front in Defense of Water and Against Privatization ”, demanding actions towards a fully sustainable use of water. They asked government to take the lead in cleaning up the Santiago River and provide urgent medical attention for residents of communities affected by its high level of pollution (see this blog post). They also called for an end to the privatization of water services.

José Luis Luege, the head of Mexico’s National Water Commission (Conagua), the government body overseeing all Mexico’s water resources, recently presented a portfolio of programs for the country’s 13 water regions which are designed to make Mexico’s water usage sustainable.

Conagua calculates that Mexico currently uses 78.4 million cubic meters of water a year. Of this amount, 66.9 billion cubic meters is taken from surface and underground sources (and is fully sustainable), while about 11.5 billion cubic meters come from the unsustainable use of aquifers, where the rates of abstraction exceeds replenishment. The new programs are designed to reduce and eventually end unsustainable aquifer use, replacing it by a mixture of water-saving programs and by building the necessary infrastructure to obtain more water from sources believed to be fully sustainable.

Related posts:

Value-added from solid waste in Mexico

 Mexico's geography in the Press  Comments Off on Value-added from solid waste in Mexico
Dec 142011
 

In a previous post, we looked briefly at the role of plastics recycling in Mexico City’s waste separation program. In this post, we describe two other developments related to solid waste disposal.

Recycling finally reaches the take-off point in Mexico

Nationwide, it took an entire decade for the plastics recycling rate in Mexico to increase from 10 to 15%. Then, in 2010, as more companies sought part of a potentially very lucrative market, the rate shot up to 17%. Admittedly, though, Mexico still lags far behind the 22% rate boasted by the European Union members in this regard.

Mexican industry generates 3.8 million metric tons of plastic waste a year (36% of it in Mexico City). The nationwide recycling capacity for plastics (geared towards hard plastic or PET) currently stands at only 646,000 metric tons, so there is plenty of room for more companies and recycling plants.

Garbage-powered street lights

The World Bank is helping finance a new bio-energy project in Monterrery which will reduce emissions by the equivalent of a million tons of CO2. This is about the same quantity as the annual emissions of 90,000 vehicles, or the amount of CO2 that would be absorbed annually by a forest with an area of 970 hectares.

The project, run by Bioenergía de Nuevo León, uses methane gas given off by decomposing garbage in one of the city’s landfills, in Salinas Victoria, which receives 5000 tons of garbage a day. The power plant’s installed generation capacity of 17mW should be sufficient to supply 90% of the nighttime street lighting in the Monterrey metro area. During the day, power from the project is supplied to the city’s metro system. Any surplus is sold to the Federal Electricity Commission and fed into the national grid.

photo of garbage

Recycling has a long way to go...

Related posts:


Two examples of trans-border air pollution on the Mexico-USA border

 Excerpts from Geo-Mexico, Updates to Geo-Mexico  Comments Off on Two examples of trans-border air pollution on the Mexico-USA border
May 262011
 

Poor air quality is known to have significant economic and social impacts, including adverse health risks and a lower quality of life. In this post, we examine two examples of trans-border air pollution. We analyze the causes of poor air quality, and describe the strategies being adopted on either side of the Mexico-USA border to improve air quality.

Does air pollution from maquiladoras in Ciudad Juárez affect people’s health?

The worst air pollution along the USA–Mexico border is in Ciudad Juárez in Chihuahua, located across the Río Grande from the city of El Paso in Texas. It is often claimed that this is because of Mexican authorities’ poor enforcement of environmental laws and the high number of maquiladora firms operating in the city.

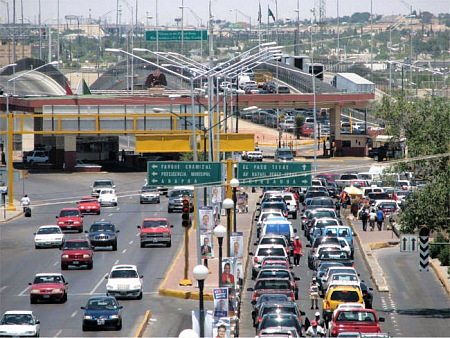
Mexico-USA border traffic in Ciudad Juárez

Mexico-USA border traffic in Ciudad Juárez

Air pollution does adversely affect the health of Ciudad Juárez’s 1.4 million residents, resulting in a higher incidence of respiratory diseases and premature mortality. However, most of the pollutants related to these health issues do not come from the 300 or so maquiladora factories but from dirt roads, vehicles and family-run brick kilns. Industry, including the brick kilns, accounts for only 17% of total sulfur dioxide emissions, and less than 1% of total particulate emissions. Services account for 44% of the sulfur dioxide emissions, and transport a further 38%. Most particulates came from unpaved roads (65% of the total) and from wind-blown soil erosion (31%). Almost all the carbon monoxide (99%) and nitrogen oxide (92%) added to the air came from transportation. (Blackman, A., Batz, M. and Evans, D. 2004 “Maquiladoras, Air Pollution, and Human Health in Ciudad Juárez and El Paso. April 2003, updated July 2004.”)

Socio-economically poor areas are more affected by bad air quality than richer areas, but this is due to the precise location of the small-scale brick kilns, which have no pollution controls, rather than to the locations of maquiladora plants. Most of the city’s 350 brick kilns are in densely populated low-income residential neighborhoods such as Anapra, Division del Norte, Fronteriza Baja and Waterfill.

When the kilns were first built, these areas were on the perimeter of the city, but they have since been enveloped by urban sprawl. The health damages arising from the brick kilns are estimated at almost $50 million a year in Ciudad Juárez and an additional $13.4 million a year in El Paso.

How are the cross-border twin cities of Nogales (Sonora) and Nogales (Arizona) trying to improve their air quality?

Further west, the border cities of Ambos Nogales (Both Nogales) share many of the same air quality issues as Ciudad Juárez. Nogales in Sonora has a population of about 250,000, more than ten times that of its cross-border twin in Arizona. Inevitably (given the size differential) most of the pollution, including dust and vehicle emissions, comes from south of the border. Air quality is also adversely impacted by natural hazards such as wildfires in the region. The air in Nogales, Arizona, regularly fails to meet the US Environmental Protection Agency’s limits for coarse particulate (PM10) pollution.

However, now, according to a recent news report, steps are being taken to ameliorate the air pollution in Ambos Nogales by authorities either side of the border.

On the Mexican side, reliable air quality monitoring systems are being installed, with the financial help of international agencies. The Sonoran state government has started a priority program to pave dirt roads in the vicinity of Nogales, responsible for an estimated 9,000 metric tons of dust each year. In the next phase, tighter controls are needed on factory emissions and on the burning of waste.

On the US side, the Arizona Department of Environmental Quality is trying an innovative approach, using federal funds to pay Mexican truck owners to replace their old, leaky mufflers with state-of-the-art catalytic converters. Each conversion costs about $1600. The program should eventually reduce harmful emissions from the particle-spewing diesel-burning trucks by 30%. The next item on the agenda for the US side should be to reduce the waiting times for all trucks crossing the border, so that emissions are further reduced.

We will look at the success (or failure) of these strategies to ameliorate trans-border air pollution in a future post.

The disposal of solid wastes in Mexico

 Excerpts from Geo-Mexico  Comments Off on The disposal of solid wastes in Mexico
Oct 252010
 

The disposal of solid wastes has become a serious problem almost everywhere in the world. In general the more affluent a society, the more solid waste it generates. Technologically-advanced civilizations tend to produce many wastes that are not biodegradable, further complicating the disposal problem. With each succeeding decade, Mexico faces greater and more complex challenges in managing its solid waste.

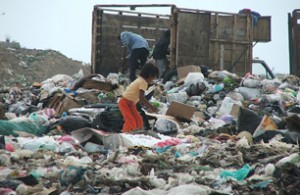
Garbage recycling at Oaxaca City dump

Garbage recycling at Oaxaca City dump. Photo: Conrad Fox, World Vision Report

In terms of weight, the vast majority of solid waste is produced by the agricultural sector. Fortunately most of this waste in readily biodegradable and is produced in areas of relatively low population density. However, agricultural wastes in the form of fertilizers and pesticides which are carried into steams and rivers have significant impacts on water quality. Animal wastes from concentrated feed lot operations are another major concern particularly because they are often located relatively close to densely populated areas.

Municipal solid waste includes waste from most commercial establishments and many small industrial operations. Mexico’s urban waste exceeds 36 million tons a year, three times the equivalent figure for Canada. Many municipalities in Mexico have initiated recycling programs, primarily focused on aluminum, glass, certain plastics and paper. However, in 2008 only 3.3% of Mexico’s total urban waste was recycled. Waste from larger towns and cities, about half of the total, is deposited in properly operated sanitary landfills. Waste from smaller communities often ends up in dumps, two thirds of which are uncontrolled.

The management (treatment or recycling) of hazardous wastes has improved greatly in recent years, particularly in the states of Nuevo León, Tamaulipas, Mexico, Tabasco and the Federal District. About half of all hazardous waste originates either in the state of Chihuahua (31% of the total) or in Mexico City (17%).

See also:

This is an excerpt from chapter 30 of Geo-Mexico: the geography and dynamics of modern Mexico. Buy your copy today, and learn more about Mexico’s fascinating geography.

Air quality improving in Mexico City but not in Monterrey

 Mexico's geography in the Press, Other  Comments Off on Air quality improving in Mexico City but not in Monterrey
Aug 102010
 

A recent short piece in The Economist, “A breath of fresh air” (31 July 2010) echoes Geo-Mexico’s contention that air quality has been improving in Mexico City in recent years, but declining in other large cities, especially Monterrey.

The improving air quality in Mexico City is attributed to:

  • relocation of heavy industry away from the city
  • closure of the Azcapotzalco oil refinery (1991); part of this area is now a public park
  • vehicle emissions standards, and enforcement
  • “Día sin coche” (Day without a car) policy for all but the newest vehicles
  • improvements to public transport, such as introducing Metrobus; starting in 2011, taxi owners have incentives to use hybrid or electric vehicles
  • on-going, effective monitoring of air quality since the mid 1980s
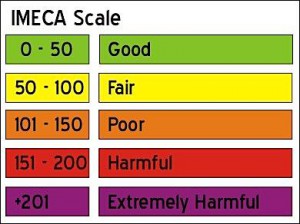
The IMECA scale for urban air quality

The IMECA scale for urban air quality

Air quality still exceeds environmental norms in Mexico City many days each year, but far fewer than during the late 1980s and early 1990s when air pollution was at its peak. Even low-level ozone measurements are showing improvement. Ironically, ozone in the lower atmosphere rose immediately after the introduction of a new unleaded gasoline, designed to  ensure that the major source of brain-damaging lead pollution was removed. The new gasoline, it emerged, simply traded one serious pollutant for another.

Latest pollution values for Mexico City.

Mexico’s other big cities still face enormous challenges with regards to air pollution. Monterrey’s air regularly has very high concentrations of microparticulates (PM10); the levels now exceed Mexico City’s peak readings from twenty years ago.  The air in Guadalajara is improving, but not as rapidly as in Mexico City.

Geo-Mexico: the geography and dynamics of modern Mexico examines the trends in air quality (ozone, microparticulates and carbon monoxide) for Mexico’s three largest cities and also asks whether the air pollution from maquiladora plants in Ciudad Juárez raises public health issues.

Ask your library to buy a copy of this handy reference guide to all aspects of Mexico’s geography today! Better yet, order your own copy…

Previous post on this topic: Mexico City air quality continues to improve

Is the BP Deepwater Horizon accident the biggest Gulf of Mexico oil spill in history?

 Mexico's geography in the Press  Comments Off on Is the BP Deepwater Horizon accident the biggest Gulf of Mexico oil spill in history?
Jun 042010
 

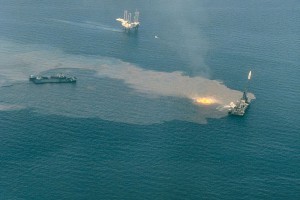
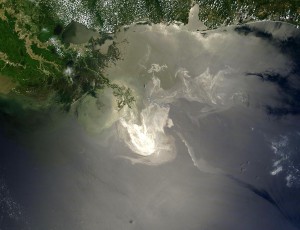
Judging from the recent coverage in the US and world media, most people would immediately respond “Yes!”, citing the current BP spill resulting from the April 20 explosion of the Deepwater Horizon offshore rig.

Ixtoc-1 blow out

However, at present this would not be the correct answer.  The largest oil spill in the Gulf of Mexico followed the June 3, 1979 blowout from the PEMEX Ixtoc I exploratory well in the southern part of the Gulf of Mexico 100 kilometers from the Campeche Coast. Though the well was in only 160 feet of water, the leak was very difficult to plug.  The flow started at an estimated 30,000 barrels a day (b/d); but was reduced in July by pumping mud into the well.  In August PEMEX pushed steel, iron and lead balls into the well to further reduce the flow.  Though PEMEX drilled two relief wells to reduce the pressure, the leak continued for 295 days until March 23, 1980.  An estimated total of 140 million gallons oil escaped making the Ixtoc I the largest oceanic accidental oil spill in history.

The next largest accidental oceanic spill was that same year when in July, 1979 the two tankers, the Atlantic Empress and the Aegean Capitan, collided off Trinidad and spilled about 90 million gallons.  The largest oil spill ever was during the Gulf War Gulf when the Iraqi Army intentionally sabotaged the oil fields in 1991 spilling about 525 million gallons.  The second largest was the Lakeview Gusher which occurred on land near Bakersfield, California in 1909 and spilled an estimated 370 million gallons.

BP oil spill approaches the US coast

The current BP leak south of Louisiana spilled an estimated 19 to 39 million gallons during its first six weeks.  At this rate, it could surpass the Ixtoc I spill between by September or October.  Everyone hopes that the leak is stopped long before then…

Update (16 July 2010). BP has capped the well, and no more oil is leaking into the ocean. The total volume of oil that has already spilled from the BP well is estimated at between 90 and 180 million gallons, comparable to, and possibly even exceeding, the Ixtoc I spill.

Update (16 August 2010). A team of US scientists now estimates that BP’s Macondo oil well, which exploded on 20  April 2010 spewed 170 million gallons of crude into the Gulf of Mexico during the 87 days before 15 July, when it was  finally capped. A further 34 million gallons of oil were captured by BP during efforts to cap the well. This makes the BP disaster the world’s largest accidental offshore oil spill ever.

More details? Wikipedia’s extensive account of the Deepwater Horizon oil spill.

Reducing pollution from the making of corn tortillas

 Mexico's geography in the Press  Comments Off on Reducing pollution from the making of corn tortillas
Mar 202010
 

The traditional way of turning corn (maize) into tortillas pollutes large volumes of water and uses copious amounts of energy. Researchers at the biotechnology department of the Autonomous Metropolitan University of Mexico (UAM) are developing a greatly improved “greener” way of  making tortillas.

Tortilla-making. Photo: krebsmaus07 (Flickr)

Tortillas cost less than a dollar a kilo in Mexico, but price rises for corn (and therefore tortillas) in recent years have caused the consumption of tortillas to fall to about 80 kg per person each year. According to the National Institute of Nutrition, tortillas account for about 45% of all the  calories consumed in Mexico.

Conventional tortilla mills cook the corn in a solution of calcium hydroxide (limewater) and then ground it into a dough. The process, known as nixtamalization, was originally developed in pre-Hispanic times. A ball of dough is then flattened into a round which is cooked on both sides on a hot comal to produce a tortilla. Residue from the nixtamalization proces contains starches, cellulose and calcium and is discarded into local drains.

About 54% of all the tortillas consumed in the country are made this way. The remainder come from a ground corn-flour mix to which water must be added to form a dough, marketed by giant commercial producers such as Maseca and Minsa.

Processing a single kilogram of corn for tortillas the conventional way requires two liters of water. There are 20,000 corn mills in Mexico; each one can pollute more than 1,000 liters of water every day. The UAM researchers were able to reduce pollution by conventional mills by 80% simply by introducing a more efficient filtering system for the cooked mass, allowing more dough to be extracted.

The researchers have now turned their attention to energy usage. Using solar energy to help heat the water should reduce the amount of natural gas required by as much as 40%. This could save mills a considerable amount of money. Each mid-sized mill (supplying dough to an average of 10 tortilla factories) spends about 2,300 dollars a month on energy.

Mar 172010
 

Geo-Mexico looks in some detail at air quality issues in several Mexican cities, focusing on trends in carbon monoxide, ozone and microparticulates (PM10) from 1995-2008. Among other things, it concludes that,

“As a result of aggressive government efforts, the quality of air in Mexico City has improved significantly. Since 1990 the number of hours that air pollution exceeded the city’s quality standard has declined by about two-thirds. Ozone continues to be a problem as do minute particulates under 10 microns (PM10), both of which can have serious health consequences.”

Mexico City air quality in 1980. Credit: Tony Burton

In the two years since 2008, the trend towards improvement of the air quality in Mexico City has continued according to this article which has appeared in numerous newspapers including the online version of The Independent, a UK daily.

That is very good news indeed. Hopefully air quality in all Mexico’s major cities will improve over the coming decade. When last we looked, Monterrey’s air pollution statistics were still headed in the wrong direction.