Mar 312016
 

The River Atoyac, a river more than 120 kilometers (75 miles) long, in the state of Veracruz, has suddenly dried up. The dramatic disappearance of the river is believed to be due to the collapse of the roof of a cavern in the underlying limestone. This caused the formation of a narrow sinkhole, 30 meters (100 feet) long, that now swallows the river and diverts its water underground.

rio_atoyac-mapa-el-universal

Drainage basin of the Río Atoyac. Credit: El Universal

The collapse happened on Sunday 28 February; residents of the small ranch town of San Fermín heard a thunderous noise at the time. Within 48 hours, the river had disappeared.

The River Atoyac rises on the slopes of the Pico de Orizaba, Mexico’s highest peak. Unfortunately, the cavern collapse occurred only 3 kilometers from the river’s source, leaving almost all of its course dry, with potentially serious consequences for up to 10,000 people living in the river basin who have now lost their usual water supply.

The disappearance of the river will also have adverse impacts on fauna and flora, and jeopardize sugar-cane farming and other activities downstream. The fauna of the river included fresh-water crayfish (langostinos) which were an important local food source.

The municipalities affected are Amatlán de los Reyes, Atoyac, Yanga, Cuitláhuac, Felipe Carrillo Puerto, Cotaxtla, Medellìn and Boca del Río.

The course of the river approximately follows that of federal highway 150D, the main toll highway between the cities of Orizaba and Veracruz.

Related posts

Dec 072015
 

The 2015 hurricane season in Mexico for Pacific coast storms started on 15 May and ended on 30 November. For Atlantic storms, the hurricane season extended from 1 June to 30 November. Hurricanes are also known as typhoons or tropical cyclones.

saffir-simpson-scale

This year, predictions for hurricane activity in the Atlantic were fairly close to reality, but the Pacific Coast forecast fell well short of predicting the number and severity of hurricane activity.

Atlantic and Caribbean hurricanes

The early season (May) prediction for 2015 for hurricane activity in the Atlantic was that it would be below the 1981-2012 average, with 7 named storms forming in the Atlantic: 4 tropical storms, 2 moderate hurricanes (1 or 2 on the Saffir-Simpson scale), and 1 severe hurricane (3, 4 or 5 on the Saffir-Simpson scale).

In reality, the 2015 Atlantic season did turn out to be slightly less active than the long-term average, but still saw the Caribbean and Gulf coasts affected by 11 named storms: 7 tropical storms, 2 moderate hurricanes and 2 severe hurricanes.

Eastern Pacific hurricanes

For the Pacific coast, Mexico’s National Meteorological Service (Servicio Meteorológico Nacional, SMN) was anticipating 19 named storms in 2015: 8 tropical storms, 7 moderate hurricanes, and 4 severe hurricanes. The 2015 season actually turned out to be the second most active Pacific hurricane season ever, with a total of 26 named storms: 10 tropical storms, 5 moderate hurricanes, and 11 severe hurricanes.

The number of hurricanes (16) in the eastern Pacific tied the all-time record, and the number of severe hurricanes (11) broke all previous records. The activity included Hurricane Patricia, the most powerful hurricane ever. Fortunately for most of Mexico, this storm lost power very rapidly once it came onshore.

Nov 232015
 

As we discussed in this earlier post, historical analysis combined with greater climatological understanding shows that many of the worst droughts and floods in Mexico have been associated with either El Niño Southern Oscillation (ENSO) events or with the related Pacific-North American Oscillation. Perhaps 65% of the variability of Mexican climate results from changes in these large-scale circulations.

The World Meteorological Organization (WMO) says the 2015-2016 ENSO is expected to be one of the three most powerful ENSO events since 1950 with effects that will last for up to eight months.

What will this winter’s El Niño bring? 

  • slightly higher ocean water temperature off west coast; some fish species may migrate northwards
  • some winter rain in north-west
  • increased winter storms, and cooler temperatures, along east coast; risk of flooding, mudslides
  • reduced summer rainfall in Mexico’s central highlands; risk of drought and lower crop yields

This winter, according to the Center for Scientific Investigation and Higher Education of Ensenada (CICESE), the Baja California Peninsula is likely to receive more rain than usual during this year’s very strong ENSO (El Niño) event.

The distribution of fish species is likely to change as the ocean temperatures are higher than usual, resulting in the migration of some species, leaving fewer fish off the coast of Baja California, one of the world’s most important commercial and sports fishing zones. Sardine fishermen may have a difficult season, incurring greater costs as they try to locate viable schools of fish.

A NASA climatologist predicts that California (USA) will be on the receiving end of more winter storms (January-March), and heavier rain, than usual. This increases the risk of hazardous mudslides in some coastal communities. It could also mean more mosquitoes, and an increased chance of contracting dengue fever or chikungunya.

What is the longer term outlook?

The first map shows likely precipitation anomalies for early next year (Spring). Areas shaded brown are areas expected to receive less rainfall than normal. Areas shaded light blue through green are predicted to get more rain than usual.

Spring precipitation anomalies

Spring precipitation anomalies in a strong El Niño year. Source: CNA

The second map shows summer precipitation anomalies. A significant reduction in rainfall is expected across most of central Mexico, though some areas in southern Mexico will likely get more rainfall than normal.

Summer precipitation anomalies in a strong El Niño year. Source: CNA

Summer precipitation anomalies in a strong El Niño year. Source: CNA

We end with one piece of good news for our more active readers. Previous El Niño events have brought great surfing to the west coast of Mexico, so make your travel and hotel plans as soon as possible.

Related posts:

Hurricane Patricia, a Category 5 hurricane, about to hit the Pacific coast

 Mexico's geography in the Press  Comments Off on Hurricane Patricia, a Category 5 hurricane, about to hit the Pacific coast
Oct 232015
 

Follow-up, 28 October 2015: In the event, Hurricane Patricia did not cause anywhere near the catastrophic damage that it might have. This was partly because it was narrower than most hurricanes of its size and happened to continue on a path that missed the major resorts of Puerto Vallarta and Manzanillo, and partly because it then rapidly lost strength as it smashed into the Western Sierra Madre (Sierra Madre Occidental), though it did bring torrential rain to many areas. This post-hurricane report in the Mexico Daily News summarizes the impacts.

Post-hurricane photos and video:

Original post:

As of Friday morning (23 October), Hurricane Patricia is a Category 5 hurricane, the highest rating possible, and “now the strongest ever hurricane to hit the eastern north Pacific region”, according to World Meteorological Organization spokeswoman Clare Nullis, citing an update from the US National Hurricane Center (NHC).

Hurricane Patricia’s central pressure of 880mb is the lowest for any tropical cyclone globally for over 30 years.

The maximum sustained winds associated with Hurricane Patricia are up to 325 km/hr (200 mi/hr), “enough to get a plane in the air and keep it flying”.

hurricane-patricia-2

Hurricane Patricia is heading towards land at 16 km/hr (10 mi/hr), and is currently predicted to make landfall somewhere close to Manzanillo in the state of Colima, later today (Friday 23 October).

Map of Pacific Coast beaches. Copyright 2010 Tony Burton. All rights reserved.

Map of Pacific Coast beaches. Copyright 2010 Tony Burton. All rights reserved.

Hurricane warnings are in effect for several towns along the Pacific coast, including the major resort of Puerto Vallarta. Puerto Vallarta has established 18 shelter locations to house evacuees.

People living in the coastal areas of the states of Nayarit, Jalisco, Colima and Michoacán are all likely to experience severe impacts from this hurricane. The hurricane could cause a significant storm surge up to 2 meters high along much of the coast, and potentially up to 6 meters high in some bays such as Barra de Navidad-Melaque, and neighboring Cuestacomate.

hurricane-patricia

Officials are warning residents to prepare for torrential rain (in excess of 300 mm is expected in some areas), exceptionally-strong winds and power outages, and are readying emergency shelters. Air traffic is already being affected, with delays reported for various domestic flights.

Mexico’s national water commission, CONAGUA, reports that the government has 1,782 temporary shelters available in the states of Michoacán, Colima, and Jalisco with a combined capacity of more than 258,000 people. Around 50,000 people should have been evacuated before the hurricane hits land, according to Mexican Civil Protection agencies.

Once it makes landfall, the hurricane is expected to weaken quickly, though inland areas, such as Guadalajara and the Lake Chapala area, will receive heavy rain.

Related posts:

Thirty years ago: the 1985 Mexico City earthquakes, a major disaster

 Excerpts from Geo-Mexico  Comments Off on Thirty years ago: the 1985 Mexico City earthquakes, a major disaster
Sep 172015
 

The worst earthquake disaster in modern Mexican history occurred thirty years ago this week. On Thursday 19 September 1985 a magnitude 8.1 earthquake struck at 7:19 a.m. and lasted a full two minutes. It was followed by a 7.5-magnitude earthquake 36 hours later.

Mexico's position in relation to tectonic plates

Mexico’s position in relation to tectonic plates.Map: Geo-Mexico.com; all rights reserved

These earthquakes resulted from the Cocos Plate (see map) pushing under the North American Plate. While the epicenters were 50 km off Mexico’s Pacific coast, near the Michoacán-Guerrero border, most of the damage occurred 350 km (215 mi) away in Mexico City because the city center’s subsoil, being former lakebed, is very unstable. The clay and silt beneath the city is up to 50 m thick in the area that received most damage. Geologists have likened the effects of the earthquake to the shaking of a bowl of jelly.

Further damage was caused by liquefaction, a process in which water is squeezed rapidly through the pore spaces in soil, dramatically reducing its cohesion. The sediments beneath Mexico City amplified the ground motions during the earthquakes and many buildings were stressed well beyond building code limits.

Damage from Mexico City's 1985 earthquake

Damage from Mexico City’s 1985 earthquake. Photo: Tony Burton; all rights reserved

Damage estimates range upward to 10,000 deaths, 50,000 injured and 100,000 homeless. More than 500 buildings collapsed, and a further 600 of the 3000 damaged structures were subsequently razed to the ground. The destruction was concentrated in a relatively small area near the city center and included many public buildings, such as government offices, as well as 11 hospitals and clinics, numerous multi-story apartment blocks, 11 hotels and 10 banks. More than 1600 school classrooms were damaged.

Buildings of between 6 and 15 stories were especially hard hit. The underbelly of the city was exposed; dozens of textile sweatshops were destroyed. The damages revealed many instances of poor construction standards and of poor enforcement of building codes. Well-built high rises such as the Latin American tower, designed to be earthquake-proof, were unscathed.

The total cost to the Mexican economy was estimated to exceed $5 billion, equivalent to 2% of the country’s GDP (Gross Domestic Product).

The disastrous 1985 earthquakes led to much tighter building codes, equal or superior to anywhere in the world, and to the formation of well-trained emergency search and rescue brigades. They also resulted in the establishment of a Seismic Alarm System which provides a 50-second warning for any earthquake measuring over 6.0 on the Richter scale occurring off the coast of Guerrero or Michoacán.

This is an excerpt from chapter 2 of Geo-Mexico: the geography and dynamics of modern Mexico.  Many more details of Mexico’s geology and landforms are analyzed in other parts of the book; take a look using Amazon.com’s Look Inside feature before buying your copy today!

Related posts:

An evaluation of Mexico’s early warning system for hurricanes (tropical cyclones).

 Other  Comments Off on An evaluation of Mexico’s early warning system for hurricanes (tropical cyclones).
Aug 312015
 

This interesting graph comes from “El sistema de alerta temprana ante ciclones tropicales desde una perspectiva de riesgo” (“The early warning system for tropical cyclones from a risk perspective”) by Dr. Víctor Orlando Magaña Rueda and his fellow researchers Adalberto Tejeda Martínez and Gustavo Vázquez Cruz, published in: H2O Gestión del agua #1 (Sacmex, 2014).

It shows the economic losses (line graph) and loss of lives (bar graph) resulting from hydro-meteorological events between 1980 and 2013. Some major storm events are named on the graph. The two background colors divide the period into before and after the introduction, in 2000, of Mexico’s early warning system (Sistema de Alerta Temprana ante Ciclones Tropicales, Siat-CT).

Graph from

Graph from Magaña et al (2014)

Overall, the trends are for some reduction over time in loss of life, but a rapid escalation since 2004 in the economic costs associated with storms and other extreme weather events. This echoes the changes seen in impacts around the world for most hazard types in recent decades.

Given that lives are still being lost, however, the researchers suggest that it is time to re-evaluate Mexico’s early warning system for tropical cyclones. Storms such as Wilma and Stan in 2005, Alex in 2010 or Manuel and Ingrid in 2013, they say, show that the system has not been entirely successful in its principal objective of avoiding loss of life.

The increase in economic costs of hazard events is sometimes attributed to insurance payments but in Mexico’s case, and taking the example of Hurricanes Ingrid and Manuel, only about 20% of total losses were covered by insurance, according to the Mexican Insurers Association (Asociación Mexicana de Instituciones de Seguros). Mexico’s federal Finance Secretariat now assumes that hazard impacts will amount to 1% of GDP a year, a figure that reduces the nation’s economic growth rate by about 0.1% a year.

The authors argue that, in addition to an improved early warning system, other changes are needed in order to reduce vulnerability. Specifically, the system should be modified to:

  • target the most vulnerable sectors of the population so that alerts reach them in ample time
  • incorporate periodic reviews, and allow for modifications to be implemented
  • be fully integrated into all levels of government (national, state and local) and the programs of all government agencies

In addition, they suggest that the reliance on the early warning system on the Saffir-Simpson scale, first developed in the 1970s, as a measure of likely damage, should be reconsidered, given that some recent storms (e.g. Stan in 2005, and Manuel in 2013) have led to far greater damage than would have been expected from their position on that scale. The researchers point out that the current model does not do well in predicting local variations in impacts.

As a result, they propose that identifying categories of risk is at least as important as categories of storm intensity. For example, they suggest that the risks associated with both the intensity and accumulation of precipitation should be taken into account, combined with soil conditions and the water levels of streams and reservoirs. Studies of the spatial distribution of impacts after storms could help identify risk factors and suggest ways to improve future warnings.

Even with an efficient early warning system, other actions are still needed. Buildings could be subject to more stringent construction regulations, especially in those coastal areas that are most at risk, while better programs of beach restoration, environmental planning and hazard event response are also needed.

There is no such thing as a perfect prediction and early warning system, but hopefully Mexico will lead the way in Latin America in reducing human fatalities from hazard events.

Related posts:

Case study of Hurricane Alex (30 June–1 July 2010)

Mexico has highest rate of death from lightning strikes in the Americas

 Other  Comments Off on Mexico has highest rate of death from lightning strikes in the Americas
Aug 062015
 

Last year, three Mexico City climate researchers published a comprehensive study of the 7300+ deaths due to lightning in Mexico during the period 1979 to 2011.

In “Deaths by Lightning in Mexico (1979–2011): Threat or Vulnerability?“, G. B. Raga, M. G. de la Parra and Beata Kucienska examined the distribution of fatalities due to lighting, looking for links to population density, vulnerability and other factors.

The number of deaths from lightning averaged 230 a year for the period studied. Given Mexico’s population, this means a rate of 2.72 fatalities from lightning for every million people. This is the highest rate in the Americas.

Fatalities were not distributed evenly. Seven of Mexico’s 32 states accounted for 60% of all lightning fatalities. Almost one-quarter of all deaths from lightning occurred in the State of México. Other states with high rates included Michoacán, Oaxaca and Guanajuato.

More than 45% of all deaths from lightning were young males under the age of 25 (with those aged 10 to 19 at particular risk). Overall, far fewer females died from lightning than males, though for females, too, the highest rates were for the under-25 age group.

Most deaths happened in the first half of the rainy season, between June and August, when thunderstorms are most likely.

Lightning incidence, North America, 2012-2014

Lightning incidence, North America, 2012-2014. Credit: Vaisala

What do all these numbers mean?

The incidence of lightning strikes in not equal across the country. For example, in the period 2012-2014 (see map) there were far more lightning events in in central and southern Mexico than in the northern part of the country and the Baja California Peninsula. This means that there is no clear connection between deaths by lightning and population density. However, neither is there a clear connection between deaths by lightning and the places where most lightning strikes occur.

The key factor is not just how likely a lightning strike is to occur in a particular place but also how vulnerable the local populace is. Some sectors of the population are much more vulnerable than others. Those working outdoors, for example, are at higher risk than those working indoors. This makes rural workers more vulnerable than urban workers. It also makes younger people more vulnerable than older people.

Education and awareness also play a part. Many countries have seen a dramatic fall in deaths from lightning as a direct result of launching campaigns to make people more aware and provide education about safety precautions. In the USA, fewer than 40 people now die each year from lightning, compared to about 400 in the 1930s, when the population was smaller.

For this reason, the study also concluded that the large number of deaths in Mexico is partly due to “the government’s failure to implement education and prevention strategies in communities living and working in vulnerable conditions”. Sadly, this means that there will probably be further tragic incidents similar to the one that took the lives of several members of the same family last month in the remote mountainous community of Mesa Cuata in Guanajuato.

Reference:

G. B. Raga, M. G. de la Parra, and Beata Kucienska, 2014: “Deaths by Lightning in Mexico (1979–2011): Threat or Vulnerability?”. Weather, Climate & Society, 6, 434–444.

Related posts:

Recent eruptions of Colima Volcano, el Volcán de Colima

 Mexico's geography in the Press  Comments Off on Recent eruptions of Colima Volcano, el Volcán de Colima
Jul 122015
 

Colima Volcano (aka el Volcán de Colima or el Volcán de Fuego) continues to erupt, displaying its fiery temper by throwing massive plumes of ash and smoke several kilometers into the air. One recent eruption caused a plume of ash seven kilometers high.


Following the eruptions of 10 and 11 July 2015 (see video clip from Webcams de México), a state of emergency has been declared by the state of Colima in 5 municipalities: Colima, Comala, Coquimatlán, Cuauhtémoc and Villa de Álvarez. This enables rapid access to state and federal funds in preparing to cope with any potential disaster.

A precautionary evacuation has been ordered of all communities within a 12-kilometer radius of the volcano’s crater. The 50-60 residents of the closest community to the volcano, La Yerbabuena, live barely eight kilometers (five miles) away from the crater. Five centimeters (two inches) of ash fell on La Yerbabuena in the past few days.

Authorities are concerned that heavy summer rains could generate dangerous and very fast-moving lahars. Lahars are mudflows of volcanic ash, pumice and rocks; they can travel at velocities of up to 100 km/h and move huge boulders and objects as large as houses.

Where is Colima Volcano (Volcán de Colima)?

Location of Colima Volcano

Location of Colima Volcano (Volcán de Colima). Credit: Tony Burton / Geo-Mexico

The volcano is one of the westernmost volcanoes in Mexico’s Volcanic Axis, which straddles the country from west to east. Colima Volcano’s summit is only 8 km (5 miles) from the inactive Nevado of Colima volcano, Mexico’s sixth-highest peak, which rises 4260 m (13,976 ft) above sea level. (Lovers of geographical trivia should note that, despite their names, the summits of both volcanoes are actually located in the state of Jalisco, not in the state of Colima.)

Colima Volcano is considered one of Mexico’s most dangerous volcanoes. Numerous villages in its shadow keep a wary eye on its level of activity, and emergency evacuations have become a regular event over the past fifty years.

How high is Colima Volcano?

The elevation of Colima Volcano is officially given as 3820 m (12,533 ft) above sea level. In the past 400 years, it has been the most active volcano in Mexico, having erupted at least 30 times since 1576. Recent activity means that this exact height may no longer be correct.

The eruption of Colima Volcano on 21 January 2015, shown in this short video, is typical of recent activity.

How often does it erupt?

Historically, the eruptions of the volcano have fallen into a definite cyclical pattern with periods of activity, each lasting about 50 years, interspersed with periods of dormancy. The first cycle of activity (after the Spanish arrived in Mexico) was between 1576 and 1611. Major eruptions occurred in 1680 and 1690, and further complete cycles occurred between 1749 and 1818, and from 1869 to 1913.

The current eruption cycle

Most geologists agree that current activity is part of the fifth cycle, which began in 1961. Judging by past performance, we should be nearing the end of this cycle, though volcanoes can be extremely unpredictable, so don’t bet your house on this happening within the next decade.

Activity has intensified in the past couple of years. In early 2013, we reported that Colima Volcano had erupted, destroying a lava dome first created in 2007 and later that year we looked at how Popocatapetl Volcano and Colima Volcano continued to erupt. At that time, experts monitoring the volcano were reporting up to 200 eruptive events a day, with numerous minor emissions of lava. Colima Volcano has been exhibiting four distinct types of volcanic activity in recent years:

  • lava dome growth
  • explosive eruptions
  • flank collapse
  • lava flows.

In early 2015, activity began to intensify, with several spectacular eruptions, sending ash and dust up to 8 or 9 kilometers (5-6 miles) into the air. Ash fell on towns up to 25 kilometers (15 miles) away from the volcano, in locations including Tuxpan, Zapotiltic and Ciudad Guzmán, but with no loss of life, or significant property damage.

The volcano can be viewed via this permanent fixed webcam operated by Webcams de Mexico. Below the main image on that site are links to 1-minute time-condensed videos showing the past 24 hours of activity.

Three maps (PDF format, Spanish-language keys and text) showing the areas likely to be affected by the volcanic hazards associated with Colima Volcanocan be found via this webpage of Mexico’s National Center for Disaster Prevention (Centro Nacional de Prevención de Desastres, CENAPRED). :

The area around the Colima Volcano is described in more detail in chapter 15 of my Western Mexico, a Traveler’s Treasury (4th edition; Sombrero Books, 2013).

Related posts:

Hurricane forecast and names for 2015

 Other  Comments Off on Hurricane forecast and names for 2015
Apr 202015
 

The 2015 hurricane season in Mexico for Pacific coast storms starts on 15 May and lasts until 30 November. For Atlantic storms, the hurricane season extends from 1 June to 30 November, though most hurricane activity is concentrated in the months from July to September. Hurricanes are also known as typhoons or tropical cyclones.

The table shows the World Meteorological Organization’s official list of 2015 tropical storm and hurricane names. Note that male and female names alternate. Names are often reused in future years, with the exception of the names of any particularly violent storms, which are officially “retired” from the list for a long time.

2015 Hurricane Names for the Atlantic, Gulf of Mexico and Caribbean
AnaGraceLarryRose
BillHenriMindySam
ClaudetteIdaNicholasTeresa
DannyJoaquinOdetteVictor
ErikaKatePeterWanda
Fred

2015 Hurricane Names for the Eastern Pacific
AndresGuillermoMartyTerry
BlancaHildaNoraVivian
CarlosIgnacioOlafWaldo
DoloresJimenaPatriciaXina
EnriqueKevinRickYork
FeliciaLindaSandraZelda

In their early season forecast for this year, Philip Klotzbach and William Gray, researchers at Colorado State University,  expect hurricane activity in the Atlantic to be below the 1981-2012 average. They predict that in the 2015 season 7 named storms will form in the Atlantic: 4 tropical storms, 2 moderate hurricanes (1 or 2 on the Saffir-Simpson scale), and 1 severe hurricanes (3, 4 or 5 on the Saffir-Simpson scale). These forecasts will be updated on 2 June and 31 July.

saffir-simpson-scaleAs expected, Pacific Ocean hurricanes were more common than usual in 2014, because it was an El Niño year. In 2014, there were 22 named storms (the highest total for 22 years), including a record-typing 16 hurricanes, of which 9 were major hurricanes. Hurricane activity in 2015 is also expected to be higher than the long-term average.

In 2015, for the Pacific coast, Mexico’s National Meteorological Service (Servicio Metrológico Nacional, SMN) is expecting 19 named storms: 8 tropical storms, 7 moderate hurricanes (1 or 2 on the Saffir-Simpson scale), and 4 severe hurricanes (3, 4 or 5 on the Saffir-Simpson scale). The SNM publishes regular updates on hurricane activity (in Spanish) on its webpage and via its Twitter account: @huracanconagua.

How accurate was the 2014 forecast?

The early season (May) prediction for 2014 (last year) was for 9 named storms in the Atlantic: 6 tropical storms, 2 moderate hurricanes and 1 severe hurricanes. This prediction proved to be the fairly accurate. In reality, the 2014 Atlantic season had 8 named storms: 2 tropical storms, 4 moderate hurricanes and 2 severe hurricanes

Related posts:

Mexico’s vulnerability and readiness to adapt to climate change and other global challenges

 Other  Comments Off on Mexico’s vulnerability and readiness to adapt to climate change and other global challenges
Mar 262015
 

The ND-GAIN Index, a project of the University of Notre Dame Global Adaptation Index (ND-GAIN), aims to help businesses and the public sector better prioritize investments for a more efficient response to the immediate global challenges ahead.

The ND-Gain Index summarizes two key characteristics of a country:

  • its vulnerability to climate change and other global challenges, and
  • its readiness to improve resilience.

Both characteristics are compound indices, based on numerous indicators, scored on a scale of 0 to 1. For vulnerability, lower scores are better; for readiness, higher scores are better.

Vulnerability measures a country’s exposure, sensitivity and ability to adapt to the negative impact of climate change. ND-GAIN measures the overall vulnerability by considering vulnerability in six life-supporting sectors – food, water, health, ecosystem service, human habitat and infrastructure.

Three vulnerability components are considered (each has several indicators):

  • Exposure: The degree to which a system is exposed to significant climate change from a biophysical perspective. It is a component of vulnerability independent of socio-economic context. Exposure indicators are projected impacts for the coming decades.
  • Sensitivity: The extent to which a country is dependent upon a sector negatively affected by climate hazard, or the proportion of the population particularly susceptible to a climate change hazard. A country’s sensitivity can vary over time.
  • Adaptive Capacity: The availability of social resources for sector-specific adaptation. In some cases, these capacities reflect sustainable adaptation solutions. In other cases, they reflect capacities to put newer, more sustainable adaptations into place. Adaptive capacity also varies over time.

Readiness targets those portions of the economy, governance and society that affect the speed and efficiency of absorption and implementation of Adaptation projects.

Three Readiness components are taken into account:

  • Economic Readiness: Economic readiness captures the ability of a country’s business environment to accept investment that could be applied to adaptation that reduces vulnerability (reduces sensitivity and improves adaptive capacity).
  • Governance Readiness: Governance readiness captures the institutional factors that enhance application of investment for adaptation.
  • Social Readiness: Social readiness captures the factors such as social inequality, ICT infrastructure, education and innovation, that enhance the mobility of investment and promote adaptation actions.
ND-Gain Index: Trends in Mexico's vulnearablity and readiness

ND-Gain Index: Trends in Mexico’s vulnerablity and readiness

In the case of Mexico (see image), from 1995 to 2013, vulnerability has steadily improved, from a high of 0.362 in 1996 to 0.315 in 2013. Mexico’s vulnerability has decreased for each of the six sectors except infrastructure.

Over the same period of time, readiness in Mexico has also improved, from a low of 0.387 in 1995 to a high of 0.464 in 2013.

The trends of lower vulnerability scores and higher readiness score for Mexico mean that while adaptation challenges still exist, Mexico is well positioned to adapt to future challenges. On the overall ND-Gain Index, Mexico is the 47th least vulnerable country and the 91st most ready country, for an overall rank of #74, of the 190+ countries in the rankings.

Beach replenishment needed in Quintana Roo

 Mexico's geography in the Press  Comments Off on Beach replenishment needed in Quintana Roo
Mar 022015
 

Officials in Quintana Roo claim that beach replenishment in the state requires the investment of at least 500 million pesos (about 35 million dollars) in the next few years, and are asking for federal help.

After Hurricane Wilma in 2005, many beaches in Quintana Roo were badly damaged. Following the hurricane, initial beach restoration efforts were funded by the federal Tourism Secretariat, with maintenance then passed over to local (municipal) authorities and the state government. The restoration program included the planting of more than 8,000 palm trees in an effort to help stabilize the coast. However, storms in late 2014 caused considerable damage to beaches, especially the Gaviota Azul beach in Punta Cancún, prompting tourism representatives to call for renewed investment in restoration.

State officials have singled out five areas where the beaches are of particular concern:

  • Cancún
  • Playa del Carmen
  • Isla Mujeres
  • Cozumel
  • Holbox Island

Quintana Roo has budgeted 5 million pesos in this year’s budget to complete the five Environmental Impact studies needed prior to applying for federal funding.

In related news, four Quintana Roo towns have applied for Magic Town status:

  • Tulum
  • Holbox
  • Isla Mujeres
  • Felipe Carrillo Puerto

Quintana Roo currently has only one Magic Town: Bacalar.

The Tourism Secretariat has previously announced that it plans to add 17 towns to the list this year, bringing the total by year-end to 100. Towns that have applied for Magic Town status will be evaluated in June this year, with decisions expected to be announced in July. Given the number of towns submitting applications, some locations are clearly going to be disappointed in this round of nominations.

Related posts:

Ground subsidence in Mexico City threatens 10,000 homes

 Mexico's geography in the Press  Comments Off on Ground subsidence in Mexico City threatens 10,000 homes
Feb 052015
 

The local authorities in Iztapalapa, in the eastern section of the Mexico City Metropolitan Area, and one of the most interesting locations in Mexico in which to witness Easter celebrations, calculate that around 10,000 homes are in the area are at “high risk” of serious damage due to ground subsidence. Some parts of the city are falling in elevation as the ground contracts by up to 40 cm/yr.

Low-lying Iztapalapa is one of the most densely populated parts of the city, and is also prone to frequent flooding. Experts say that the severe damage evident in many buildings in the area has been occasioned by ground subsidence, due to the excessive volumes of water being pumped out of the subsoil to satisfy the insatiable demand of Mexico City.

In a short 3-minute news video in Spanish that is linked to in this recent article, Lourdes, a local resident offers us a tour of her home, showing us the damages caused by subsidence. She describes how “the crack that started from outside the house has widened every day and is now almost the width of a hand.” The video shows how the walls of her home are separating; the house is clearly in danger of collapse. Lourdes lives in this house with her four children; some rooms are already far too damaged to be safely used by the family.

Related posts:

Sep 082014
 

In mid-August 2014, this significant fissure (see image) appeared near the city of Hermosillo in northern Mexico, with some press reports opting for headlines such as “The Earth Splits Open”:

fissure-hermosillo-eyewitness-news

While many press reports, especially those in English, tried to link this fissure to faulting and earthquake movements, others were more cautious, saying it was caused by movement of water underground followed by subsidence. Which version is correct? Probably neither is completely correct, since geography often fails to provide a single, definitive reason for things!

The crack is about 1000 meters (two thirds of a mile) long and up to 7 or 8 meters wide and 10 meters deep. While some press reports erroneously claimed that the crack extended across the main, paved, highway #26 between Hermosillo and the coast, its location was actually some distance away from the main highway. The road shown in the image above is a rural, unpaved road about 80 kilometers (50 miles) west of Hermosillo, in an area of farmland, some of which is irrigated.

Could the fissure have been formed by faulting associated with earth tremors or an earthquake? If this was the cause, the fence line, and the line taken by the road would have shifted position and no longer be straight. The image clearly shows that the road has been severed, but provides no evidence that the two sides have shifted position. Indeed, a close-up view confirms that even the existing fence remains in place:

fissure-hermosillo-fence-line

The available evidence therefore rules out faulting (or earth tremors or earthquakes) as the cause of the crack.

Could the fissure have been caused by an underground flow of water followed by subsidence (the collapse of overlying rocks)? This certainly looks more likely though it is hard to imagine significant underground flows of water in an area that is as flat as this. On the other hand, this is (a) an area of newly constructed irrigation ditches and ponds, and (b) it received heavy rainfall a few days before the crack was reported.

In all probability, the fissure began as a deep but very narrow “subsidence fissure” where differences in irrigation (or in water extraction) caused some parts to be much wetter than others. The soil and rock particles in wetter areas would tend to expand, while those in drier areas would tend to contract. Such differences could lead to the formation of small initial fissures.

Once the fissure had been started, localized heavy rains and the resulting overland flow could then result in streams flowing (temporarily) in these initial fissures. The moving stream water would rapidly widen and deepen the fissures into the scale of crack shown in the photos. The initial fissure may have been formed several years before this widening process occurred.

For a more detailed look at the evidence for this fissure’s formation (and its true location), see Debunked: The Earth Splitting Open – Giant Crack in Mexico.

Related posts:

6.9 magnitude earthquake strikes Chiapas and Guatemala (7 July 2014)

 Mexico's geography in the Press  Comments Off on 6.9 magnitude earthquake strikes Chiapas and Guatemala (7 July 2014)
Jul 072014
 

Update (14 July 2014):

Civil Protection groups in Chiapas report that a total of 9,000 homes in that state were damaged by the 6.9 magnitude earthquake that struck the region on 7 July 2014 (see below). Three people lost their lives as a result of the ‘quake: two in Hixtla and the other in Mapastepec.

Minor damages have been reported for various public buildings including the Town Hall in Tapachula, primary schools in Tapachula and Tuxtla Chico, two health care centers in Villacomaltitlán and the municipal market in Escuintla.

While all highways remained open to traffic, minor highway damages were reported on several roads including:

  • the road connecting Unión Juárez to Talquián, Córdova and Chiquihuites
  • the road linking Huixtla to El Jocote

A total of 38 municipalities in Chiapas have now been formally declared “Disaster Areas” which gives them access to funds from the federal Natural Disaster Fund.

The municipalities are Acacoyagua, Acapetahua, Amatenango de la Frontera, Arriaga, Bejucal de Ocampo, Bella Vista, Cacahoatán, Chicomuselo, El Porvenir, Escuintla, Frontera Comalapa, Frontera Hidalgo, Huehuetán, Huixtla, La Grandeza, Mapastepec, Mazapa de Madero, Mazatán, Metapa, Montecristo de Guerrero, Motozintla, Pijijiapan, Siltepec, Suchiate, Tapachula, Tonalá, Tuxtla Chico, Tuzantán, Unión Juárez, Villa Comaltitlán, Altamirano, Ángel Albino Corzo, Comitán de Domínguez, El Parral, La Concordia, Tuxtla Gutiérrez, Villa Corzo and Villaflores.

Original post (7 July 2014):

A strong earthquake has rocked Mexico’s southern state of Chiapas and the neighboring San Marcos region of Guatemala. There are two reported fatalities in Chiapas, while in Guatemala casualties were restricted to a new-born baby, tragically killed by falling debris. About 300 homes in 15 municipalities in Chiapas are reported to have been damaged.

The earthquake, at about 6:30 am local (Chiapas) time, registered 6.9 on the Richter scale, though the US Geological Survey had earlier reported it as magnitude 7.1. The epicenter of the earthquake was 2km north-northeast of Puerto Madero, Chiapas, very close to Tapachula.

The airport of Tapachula, close to the Mexico-Guatemala border, is now reported to be operating normally, having sustained minor damages (see below) and having been briefly closed for inspection, with no flights allowed to land or take off.

Credit: @TapachulaCentro

Credit: @TapachulaCentro

A sequence of images posted by Mexico City daily Milenio shows some of the damage and devastation caused by the earthquake.

Damage is also reported to many homes in Tapachula, and the town market in Huixtla (north-west of Tapachula) has been partially closed due to structural damage.

We will update this report as more information becomes available.

Related posts:


Hurricane names and forecast for 2014

 Mexico's geography in the Press  Comments Off on Hurricane names and forecast for 2014
Apr 172014
 

The 2014 hurricane season in Mexico for Pacific coast storms starts on 15 May and lasts until 30 November. For Atlantic storms, the hurricane season extends from 1 June to 30 November, though most hurricane activity is concentrated in the months from July to September. Hurricanes are also known as typhoons or tropical cyclones.

In 2013 only two hurricanes (Manuel and Ingrid) hit Mexico, but they hit simultaneously in September, leading to more than 100 storm-related deaths and millions of dollars worth of property damage in several states, especially Guerrero.

The table shows the World Meteorological Organization’s official list of 2014 hurricane names. Note that male and female names alternate. Names are often reused in future years, with the exception of the names of any particularly violent storms, which are officially “retired” from the list for a long time.

2014 Hurricane Names for the Atlantic, Gulf of Mexico and Caribbean
ArthurGonzaloLauraRene
BerthaHannaMarcoSally
CristobalIsaiasNanaTeddy
DollyJosephineOmarVicky
EduourdKylePauletteWilfred
Fay

2014 Hurricane Names for the Eastern Pacific
AmandaGenevieveMarinaTrudy
BorisHernanNorbertVance
CristinaIselleOdileWinnie
DouglasJulioPoloXavier
ElidaKarinaRachelYolanda
FaustoLowellSimonZeke

For the Atlantic coast, Mexico’s National Meteorological Service (Servicio Metrológico Nacional, SMN) is expecting 10 named storms: 3 tropical storms, 5 moderate hurricanes (1 or 2 on the Saffir-Simpson scale), and 2 severe hurricanes (3, 4 or 5 on the Saffir-Simpson scale).

In their early season forecast for this year, Philip Klotzbach and William Gray, researchers at Colorado State University,  expect hurricane activity in the Atlantic to be significantly below the 1981-2012 average. They write that, “The tropical Atlantic has… cooled over the past several months, and the chances of a moderate to strong El Niño event this summer and fall appear to be quite high…. Historical data indicate fewer storms form in these conditions.” They predict that in the 2014 season 9 named storms will form in the Atlantic: 6 tropical storms, 2 moderate hurricanes (1 or 2 on the Saffir-Simpson scale), and 1 severe hurricanes (3, 4 or 5 on the Saffir-Simpson scale). These forecasts will be updated on 2 June and 31 July.

saffir-simpson-scalePacific Ocean hurricanes tend to be more common in El Niño years, so this year may be more active than usual. For the Pacific coast, Mexico’s National Meteorological Service (Servicio Metrológico Nacional, SMN) is expecting 15 named storms: 5 tropical storms, 7 moderate hurricanes (1 or 2 on the Saffir-Simpson scale), and 3 severe hurricanes (3, 4 or 5 on the Saffir-Simpson scale). The SNM publishes regular updates on hurricane activity (in Spanish) on its webpage and via its Twitter account: @huracanconagua.

How accurate was the 2013 forecast?

The early season (May) prediction for 2013 (last year) was for 18 named storms in the Atlantic: 9 tropical storms, 5 moderate hurricanes and 4 severe hurricanes. This prediction proved to be the least accurate forecast in recent years. In reality, the 2013 Atlantic season had 14 named storms: 1 tropical depression, 11 tropical storms, 2 moderate hurricanes and 0 severe hurricanes. Klotzbach and Gray have since looked at the possible reasons for the poor forecast and concluded that, “It appears that the primary reason was the most significant spring weakening observed since 1950 of the Atlantic thermohaline circulation.” A summary of their findings is available here.

Related posts:

Road collapse in Baja California in December 2013 increases trucking costs

 Mexico's geography in the Press  Comments Off on Road collapse in Baja California in December 2013 increases trucking costs
Mar 292014
 

The adverse effects of the dramatic collapse in December 2013 of a 300-meter section of the Tijuana-Ensenada coastal highway are likely to be felt for at least six months and probably longer. The extent of the problem is clear from the images in the news reports from the time:

tijuana-ensenada road collapseThe collapse took place about 95 km (60 mi) south of the border, and closed the scenic coastal highway near the San Miguel toll booth. It is still unclear whether or not an attempt will be made to rebuild the coastal highway, or whether a new highway, or new sections of highway, will be built further inland.

In the interim, passenger vehicles and light trucks are using the old two-lane road between Tijuana and Ensenada, while heavy goods vehicles are being rerouted via Tecate, adding at least 30% to their costs, according to Mexican National Confederation of Transporters (MNCT).

The MNCT says that 300 trucks a day travel between Tijuana and Ensenada and that the rerouting adds at least  80 km (50 mi) to each trip, with corresponding expenses in gasoline, driver salaries and vehicle maintenance. It also almost doubles the time required. A spokesperson for the MNCT has called for authorities to allow heavy trucks to use the more direct non-toll route (Highway 1). However, the increased traffic on the old road is already leading to backups and an increase in minor accidents, so it is unlikely that authorities will allow any larger trucks to use that route.

It is too early to say how serious the effects will be on Ensenada’s economy. The city has Mexico’s third busiest cruise ship terminal and is the main gateway for travel further south along the Baja California Peninsula.

Related posts:

Mexico and US agree to work together to fight trans-border wildfires

 Mexico's geography in the Press  Comments Off on Mexico and US agree to work together to fight trans-border wildfires
Feb 222014
 

Mexico’s National Forestry Commission (Comisión Nacional Forestal, Conafor) and the US Forest Service have signed an agreement aimed to ensure more efficient fire-fighting when dealing with wildfires on the border of Sonora/Arizona. The agreement, the Bi-national Convention on Forest Fires (Convenio Binacional de Incendios Forestales) is designed to increase public safety on either side of the border, reduce habitat loss, and facilitate the exchange of information about wildfires, leading to improved preventative measures and firefighter training.

The Convention establishes that when a fire is detected in the municipalities of Nogales, Naco, Agua Prieta or Santa Cruz, a united bi-national command can be established to ensure effective collaboration between the two countries’ firefighters. Firefighting brigades, together with supporting vehicles and aircraft, will be authorized to cross the border by up to 16 km (10 miles) in either direction when battling wildfires, provided they give prior notice to the relevant migration, security and customs agencies in the country concerned.

Coahuila wildfire, April 9, 2011 (Earth Observatory, Landsat-5)

Coahuila wildfire, April 9, 2011 (Earth Observatory, Landsat-5)

Mexico’s worst ever year for forest fires was in 1998, when 14,400 were recorded. In the past three years, 2011 was easily the most disastrous in terms of wildfires, with more than 12,000 fires reported:

  • 2011 – 12,113 fires, affecting  956 square km
  • 2012 –  7,170 fires, affecting 347 square km
  • 2013 – 10,406 fires, affecting 413 square km

In 2013, 99% of wildfires were attributed to “human actions”, with 36% of all fires resulting from deliberate agricultural burn-offs getting out of control.

The main wildfire season is from February to May each year. May is the critical month because it marks the end of the dry season in most of Mexico, the time when the natural landscape looks parched. During May, as the landscape waits for the start of the rainy season, precursor electrical storms are relatively common. Electrical storms can easily trigger wildfires if they ignite the tinder-dry vegetation.

Related posts:

National Hurricane Agency and National Atlas of Risks

 Mexico's geography in the Press  Comments Off on National Hurricane Agency and National Atlas of Risks
Jan 232014
 

Speaking at an event to mark the 25th anniversary of the establishment of the National Water Commission (Conagua), President Enrique Peña Nieto announced that the government has allocated 170 million dollars towards modernizing the National Meteorological Service (Servicio Meteorológico Nacional, SMN).

The modernization will include establishing a National Hurricane Agency to coordinate hazard prediction, prevention and mitigation actions with state and municipal authorities to reduce the impacts of natural climatic hazard events.

2013 Atlantic Hurricane Season

Ironically, the 2013 season (shown) was the first Atlantic hurricane season since 1994 to end with no major hurricanes.

In related news, the government has also announced that progress is being made in compiling a National Atlas of Risks. The Atlas is an interactive GIS database containing details of settlements, soils, rivers, dams, highways, rail lines, river basins, oil fields, and many other factors related to the assessment of vulnerability and risk. Due to be completed by 2016, it will help all three levels of government (municipal, state, federal) decide how best to allocate hazard mitigation resources and improve the accuracy of risk assessments utilized in future planning decisions.

Related posts:

Mexico battered by massive storms from both east and west (September 2013)

 Mexico's geography in the Press  Comments Off on Mexico battered by massive storms from both east and west (September 2013)
Oct 192013
 

For the first time since 1958 Mexico was bashed virtually simultaneously by two very destructive storms: Ingrid in the east and Manuel in the west. Before discussing their destructive impact, we will describe the tracks of the two storms (photos below) and chart their chronology.

Track of Hurricane Ingrid

Track of Hurricane Ingrid

On September 10, weak weather disturbances were observed in the Caribbean east of the Yucatan Peninsula and in the Pacific south of Chiapas. The disturbance in the Caribbean gained some strength before hitting land which weakened it. It survived its crossing of the peninsula and re-emerged in warm waters of the southern Gulf of Mexico where it quickly gained strength. By the afternoon of September 12th it was upgraded to an official tropical depression.

Track of Hurricane Manuel

Track of Hurricane Manuel

Meanwhile the disturbance in Pacific moved slowly westward and by the morning of 13th was upgraded to a tropical depression. At about noon of the 13th both storms were upgraded to become named tropical storms (Ingrid and Manuel respectively) meaning they had winds of over 40 mph. In other words, the birth of “Ingrid” and “Manuel” were almost simultaneous (light green spots on the tracking maps). After earlier moving westward, both storms started to move north and slightly east picking up moisture, strength and wind speed over the warm ocean water.

Ingrid continued to move north gaining strength and by the next afternoon, the 14th, it was upgraded to a Category I hurricane with winds of 75mph. It started to move west and winds increased to 85mph on the morning of the 15th. Meanwhile Manuel also started to move west again skirting the coast of Guerrero and Michoacán. Early on the 15th Manuel’s winds reached 70mph. Though wind speeds did not quite reach hurricane level at that time and the eye of Manuel never made landfall, it brought enormous amounts of rain to coastal communities. For example, on September 14th Chilpancingo, Guerrero’s capital, got 393mm (15.5”) of rain while Acapulco got 140mm (5.5”) (Wunderground.com). This, added to considerable rain on preceding and following days, led to horrific flooding.

Satellite image of Hurricane Ingrid and Hurricane Manuel, September 2013

Satellite image of Hurricane Ingrid and Hurricane Manuel, 15 September 2013

On September 15th Hurricane Ingrid with winds of 75-85mph drifted toward Taumalipas in northeast Mexico. Meanwhile. Tropical Storm Manuel with winds about 60mph made landfall near Manzanillo, Colima. Once over land, the storm quickly lost power; by that evening winds were down to 35mph and Manuel was downgraded to tropical depression, but heavy rainfall continued. The next morning on the 16th Manuel’s winds were down to 30mph and it was further downgraded to a “remnant” of a tropical storm. But later that day, the remnant of Manuel move back to the Pacific Ocean near Puerto Vallarta and began to regain its strength.

That same morning September 16th Ingrid, which had weaken to a tropical storm with winds of 65mph made landfall just east of Ciudad Victoria, Tamaulipas. By the next morning, the 17th, Ingrid’s winds were down to 25mph and it was downgraded to a “remnant” though heavy rainfall continued.

Later on the 17th, Manuel regained its status as a tropical depression (winds of 35mph). The next morning, the 18th, it regained tropical storm status and by that afternoon it became Hurricane Manuel with winds of 75mph. Early on the 19th it made landfall west of Culiacan, Sinaloa. Moving east over land Manuel quickly lost power and was down to a remnant by the morning of the 20th. However, the remnant of Manuel continued far north and east joining the remnant of Ingrid and bringing torrential rains and flooding to central Texas, including Austin.

While storms are classified by their wind speeds from tropical depressions to tropical storms and then to hurricanes with intensities one up to five; this classification does not capture the extent of damage that can be caused. The amount of rain combined with the terrain can be far more damaging than the wind speeds. Furthermore the storm surge associated with a storm’s low pressure and high tides can be far more devastating than the winds as we saw with Hurricane Rita in New Orleans and Hurricane Sandy in New York.

In the case of Manuel, the amount of rainfall was far more destructive than the winds. The rains of Manuel as a “tropical storm” off the coast of Guerrero did far more damage than Hurricane Manuel did later in the State of Sinaloa or Ingrid did in eastern Mexico. Manual caused a total of about 84 reported deaths. At least 72 people were reported dead in Guerrero and another 68 were reported missing in the town of La Pintada that was partially buried under a massive mudslide. In Acapulco about 18 died. Floods closed the exit highways and the airport, temporarily stranding 40,000 tourists. These photos from the Guardian and USAToday show the extent of flooding in Guerrero, especially around Acapulco.

In contrast fewer than a dozen people reportedly died in Sinaloa which was later directly hit by Hurricane Manual. While Ingrid had considerably stronger winds than Manuel, its death toll of only about 23 was spread across several states from Puebla just east of Mexico City up to Tamualipas on the Texas border. More than half the total, 12 died in Altotonga, Veracruz, when a mudslide smashed into a bus. Of course, deaths are not the only, nor the best, measure of a storm’s destructive impact. Other commonly used measures are the financial cost of the damage and the number of people who evacuated or become homeless. No matter what measure is used, hurricanes are one of the most destructive natural hazards.

Related posts:

Popocatepetl Volcano puts on an explosive show

 Mexico's geography in the Press  Comments Off on Popocatepetl Volcano puts on an explosive show
Jul 102013
 

This 30-second video update on the eruption of Popocatepetl Volcano speaks for itself. Webcams have made the life of armchair geologists (even those of us who quite like exploring volcanic craters, provided the volcano in question is extinct or at least dormant) a whole lot easier!

The alert level remains at Yellow Phase 3, the highest stage before the two “Alarm” stages of Red 1 and Red 2.

Travel tips:

Several international flights into and out of Mexico City over the past week have been either diverted to other airports or cancelled. If you are flying into Mexico City in the next few days, check with your airline.

Ash has fallen (in varying amounts) over many parts of the city during this time. To avoid getting any ash into your lungs (not good!), consider wearing a damp face mask wherever/whenever the air is not clear.

Related posts:

Jul 062013
 

Popocatepetl Volcano (“Don Goyo” to the people living in its shadow) continues to erupt. On 4 July, several airlines, including American Airlines, US Airways, Delta Airlines and Alaska Airlines suspended operations to and from Mexico City for several hours, resulting in numerous cancelled flights.

Mexico’s National Disaster Center (Cenapred) provides daily updates (in both English and Spanish) on the volcano’s activity. The Volcanic Alert Level was raised today (6 July) to Yellow Phase 3. This includes:

  1. Access is restricted within a radius of 12 km from the volcano’s crater. Permanence in this area is not allowed.
  2. The road between Santiago Xalitzintla (Puebla) and San Pedro Nexapa (Mexico State), including Paso de Cortes, is open only to authorized traffic.
  3. Civil Protection authorities maintain preventive procedures, according to operative plans.
  4. People are advised to follow guidelines provided by official information bulletins.

There are only two higher levels (both described as “Alarm” rather than “Alert”): Red Phase 1 and Red Phase 2.

Since our last update in March, several spectacular images of the volcano have been released.  Activity increases every two or three weeks, as the following brief reports, based on the Cenapred daily updates, reveal:

8 May – Ash rose 3000 m above the volcano before falling on several municipalities in the states of Puebla and Tlaxcala. Residents were advised to sweep it up without using any water to prevent the ash from sticking together and blocking drains. Mexico City’s international airport was closed to flights for a short time.

14 May – Eruptions continued, accompanied by an increase in seismic activity. The Alert Level was raised to Yellow Phase 3 for several days, with evacuation plans about to be implemented. A dome of lava, about 350 m across and 50 m thick, had formed in the crater, prior to being destroyed in an eruption which formed a 3000 m high ash cloud and sent incandescent fragments (“volcanic bombs”) up to 1000 m from the crater. The volcano’s activity subsided within days and the alert level was reduced to Yellow Phase 2.

17 June – A month later, another explosion (see photos) sent ash more than 4000 m into the air, and threw volcanic bombs up to 2000 m from the crater, starting a series of minor wild fires. Winds blowing towards the northwest carried ash towards the south-eastern section of Mexico City. A week later (24 June), minor amounts of ash fell in eight municipalities in the state of Mexico: Amecameca, Tlalmanalco, Temamatla, Cocotitlán, Ozumba, Atlautla, Ecatzingo and Chalco. The local authorities reported no damage, but reminded residents, among other things, to avoid wearing contact lenses if at all possible. The next day (25 June), ash fell on some southern and eastern parts of Mexico City. Three international flights scheduled to land in Mexico City airport were diverted to Querétaro airport.

The typical sequence of activity is shown in the photos. First, pressure from molten rock underground (magma) leads to the formation of a dome of lava in the summit crater (photo below).

Lava dome building in crater of Popocatapetl Volcano

Lava dome building in crater of Popocatapetl Volcano

These domes eventually either collapse or are destroyed by explosions (photos below) that lessen the pressure beneath the surface.

NasaPopocatapetl Volcano erupts, 17 June 2013

Popocatapetl Volcano erupts, 17 June 2013

Following the explosion (shown by the satellite image below), a new dome begins to form, and the cycle of eruptive activity continues.

Geophysicists from the National University (UNAM) who monitor the volcano and analyze its gaseous emissions say that between 1994 and 2008 the volcano emitted 30 megatons (30 million tons) of gases and that it looks set to continue erupting for several years. Popocatepetl is one of the top five volcanoes in the world for emissions of sulfur dioxide. The volcano has added between 6000 and 8000 tons/day to the atmosphere in recent months. Lead researcher Hugo Delgado Granados has been quoted in press reports as saying that the continued gaseous emissions are good news, since the constant releases of pressure should preclude a more explosive eruption.

A YouTube compilation of webcam videos of the volcano provides a time-condensed view of the eruption of 17 June 2013. The 30-second video represented a period of 20-30 minutes, during which the volcano exploded into action, sending a cloud of gases, ash and volcanic fragments high into the air.

Related posts:

Jun 172013
 

Today (June 17) is the UN’s “World Day to Combat Desertification and Drought.”

How does Mexico stand right now in relation to drought? Drought currently affects about 40% of the country (see map). Some parts of northern Mexico have been experiencing a severe drought for almost three years. The worst affected states are Chihuahua, Nuevo León, Coahuila, Durango, Zacatecas, Tamaulipas, San Luis Potosí, together with parts of Querétaro, Aguascalientes, Sinaloa and Sonora.

Areas suffering from short-term and long-term drought, April 2013. Click map to enlarge.

Areas suffering from short-term and long-term drought, April 2013. Click map to enlarge.

Last year’s rains did reduce the area suffering from drought from 55.9% of Mexico to 38.6%, but that figure has risen to well over 40% this year.

In 2012, and earlier this year, many major cities, including Mexico City and Guadalajara, had to enforce water rationing for several months, supplying water to individual households only on certain days each week.

As this year’s rainy season begins in central Mexico, dozens of reservoirs are at critically low levels. Reservoirs in Coahuila average only 10% of their capacity, only slightly better than those in San Luis Potosí (12%). Even the populous state of Jalisco faces problems; its reservoirs are at 27% of capacity.

Things are unlikely to improve any time soon since the current long range forecast for this rainy season is for 30% less precipitation than the long term average.

The drought has already caused significant losses to farmers. Livestock owners in northern Mexico have culled herds and are having to buy in supplies of water to top up their private wells. Rainfall so far in 2013 has been well below long-term averages in central and northern Mexico, which may limit the region’s productivity of rain-fed agriculture (mostly wheat, corn, sorghum and other fodder crops).

Authorities at the three levels of government (federal, state and municipal) in many regions are calling for urgent concerted action to help farmers as well as to ensure supplies of drinking water to towns, cities and rural communities.

In Tamaulipas, at least 60 rural communities are confronting a critical water shortage. Farming representatives argue that while the National Water Commission (Conagua) has guaranteed water supply for urban areas, many rural areas remain vulnerable, and lack both potable water and food support on account of harvest failures due to lack of rain. In Tamaulipas alone, drought has affected 22,000 hectares and killed 800 head of livestock in the past year.

In Nuevo León, citrus farmers fear that their harvest, which begins in October will be 40-50% lower than usual. The state government is supporting a 35-million-dollar support program for farmers which includes supplying water by truck, rehabilitating deep wells and offering subsidies for water that farmers buy direct from private suppliers. The spring harvest in Nuevo León was lost completely, and a “severe drought emergency” has been declared in at least 14 municiapliites (Allende, Cadereyta, Dr. Arroyo, General Terán, Higueras, Juárez, Lampazos, Rayones, Sabinas Hidalgo, Santa Catarina, Villaldama, Hidalgo, García and Mina) allowing them access to federal aid.

Besides loss of livestock and crops, the prolonged drought in Mexico is having many other effects, which include:

Migration – In Durango state, more than 1500 Mennonites have left their homes due to the drought, according to Mennonite leader Enrique Peter Klassen, with some of the migrants headed for neighboring state of Chihuahua and others emigrating to Canada.

Wildfires – The first four months of 2013 was the third worst season for forest fires (more than 7000 were reported) in recent history, after 1996 and 2011. According to the National Forestry Commission (Conafor), wildfires ravaged 170,000 hectares, mostly grassland and wooded pastureland, in the first four months of this year. The states which suffered most were Oaxaca (21,000 ha), Baja California Sur (16,000), Guerrero (13,857) and Jalisco (13,697).

Lake Chapala – In the past two years, the level of Mexico’s largest natural lake, Lake Chapala, has once again fallen to crisis levels. (The lake has a long history of fluctuations in level, discussed in detail in our Geo-Mexico, the geography and dynamics of modern Mexico). The lake currently holds 2.84 million cubic meters of water, about 36% of its capacity. Its level has fallen 1.43 meters since last year’s rainy season, the lake’s most dramatic decline for 20 years. The rainy seasons in 2011 and 2012 raised the lake level by only 24 cm and 50 cm respectively, so unless this year’s rains are exceptionally heavy, the lake will continue to drop.

Previous posts related to drought:

Hurricane names and forecast for 2013

 Mexico's geography in the Press  Comments Off on Hurricane names and forecast for 2013
May 112013
 

The 2013 hurricane season in Mexico is underway. The “official” hurricane season is from 15 May to 30 November each year for Pacific coast storms, and from 1 June to 30 November for Atlantic storms, though most hurricane activity is concentrated in the months from July to September. Hurricanes are also known as typhoons or tropical cyclones.

The table shows the World Meteorological Organization’s official list of 2012 hurricane names. Note that male and female names alternate. Names are often reused in future years, with the exception of the names of any particularly violent storms, which are officially “retired” from the list for a long time.

2013 Hurricane Names for the Atlantic, Gulf of Mexico and Caribbean
AndreaGabrielleLorenzoRebekah
BarryHumbertoMelissaSebastien
ChantalIngridNestorTanya
DorianJerryOlgaVan
ErinKarenPabloWendy
Ferdinand

2013 Hurricane Names for the Eastern Pacific
AlvinGilManuelTico
BarbaraHenrietteNardaVelma
CosmeIvoOctaveWallis
DalilaJuliettePriscillaXina
ErickKikoRaymondYork
FlossieLorenaSoniaZelda

In their early season forecast for this year, Philip Klotzbach and William Gray, researchers at Colorado State University,  expect hurricane activity in the Atlantic to be significantly higher than the 1981-2010 average. They write that, “The tropical Atlantic has anomalously warmed over the past several months, and it appears that the chances of an El Niño event this summer and fall are unlikely”. (A strong el Niño is likely to minimize Atlantic hurricane activity). They predict that in the 2013 season 18 named storms will form in the Atlantic: 9 tropical storms, 5 moderate hurricanes (1 or 2 on the Saffir-Simpson scale), and 4 severe hurricanes (3, 4 or 5 on the Saffir-Simpson scale). These forecasts will be updated on 3 June and 2 August.

saffir-simpson-scale

For the Pacific coast, Mexico’s National Meteorological Service (Servicio Metrológico Nacional, SMN) is expecting 14 named storms: 6 tropical storms, 4 moderate hurricanes (1 or 2 on the Saffir-Simpson scale), and 4 severe hurricanes (3, 4 or 5 on the Saffir-Simpson scale). The SNM publishes regular updates on hurricane activity (in Spanish) on its webpage and via its Twitter account: @huracanconagua.

How accurate was the forecast in 2012?

The late season (3 August) prediction for 2012 (last year) was for 14 named storms in the Atlantic: 8 tropical storms, 4 moderate hurricanes and 2 severe hurricanes. In reality, the 2012 Atlantic season had 19 named storms: 9 tropical storms, 8 moderate hurricanes and 2 severe hurricanes.

Related posts:

Popocatapetl Volcano and Colima Volcano continue to erupt

 Mexico's geography in the Press, Updates to Geo-Mexico  Comments Off on Popocatapetl Volcano and Colima Volcano continue to erupt
Mar 302013
 

In our series of brief updates on topics featured in previous Geo-Mexico posts, we look this week at the continuing eruption of two major volcanoes: Popocatapetl Volcano (between Mexico City and Puebla) and Colima Volcano (on the Jalisco-Colima state border in western Mexico).

Popocatepetl, 30 July 2012

Popocatepetl, 30 July 2012

Since our previous post, about a year ago, entitled Alert level rises as Popocatepetl volcano starts to erupt, Popocatapetl Volcano (photo) has continued to be active, with up to 250 activity events a day. The alert level has been reduced slightly to Yellow Phase 2, the fourth highest level. This level indicates intermediate scale explosive activity and possible expulsion of lava, explosions of increasing intensity and wind-blown ash falling on nearby villages. The volcano is monitored daily, and updates from CENAPRED  (in Spanish and English) are issued every 24 hours.

The report issued on 27 March is typical of recent months. In the previous 24 hours, there were 83 low intensity events with emissions of gas, water vapor and ash. The two largest events sent material rising 1000 meters and 600 meters into the atmosphere respectively, before the wind blew the material north eastwards (away from Mexico City).

Colima Volcano

In January 2013, we reported how Colima Volcano erupts, destroying lava dome first created in 2007. The volcano has continued to erupt in the ten weeks since then. The experts monitoring the volcano have reported up to 200 eruptive events a day, with numerous minor emissions of lava. Local villagers have been asked to remain on alert, though the experts are not yet calling for any villages to be evacuated.

The image below (source: Nasa Earth Observatory) shows Colima Volcano in 2010, part way into its current eruptive phase which is expected to last several years. The image shows the evidence at that time of four different types of volcanic activity:

  • lava dome growth
  • explosive eruptions
  • flank collapse
  • lava flows.

(Note that the 2013 eruptions have significantly altered the top of the volcano since this image was taken).

Nasa Earth Observatory)

Colima Volcano in 2010 (Nasa Earth Observatory)

Related posts:

Paricutin Volcano in Mexico celebrates its 70th birthday

 Other  Comments Off on Paricutin Volcano in Mexico celebrates its 70th birthday
Feb 202013
 

Today (20 February 2013) marks the 70th anniversary of the first eruption of Paricutín Volcano in the state of Michoacán in western Mexico.

The landscape around the volcano, which suddenly started erupting in the middle of a farmer’s field in 1943 and which stopped equally abruptly in 1952, is some of the finest, most easily accessible volcanic scenery in the world. A short distance northwest of Uruapan, this is a geographic “must see”, even if you can only spare a few hours.

Paricutín Volcano, 16 July 1943

Paricutín Volcano, 16 July 1943

What makes Paricutín so special is that in all of recorded history, scientists have had the opportunity to study very few completely new volcanoes in continental areas (whereas new oceanic island volcanoes are comparatively common). The first two new volcanoes formed in the Americas in historic times are just one hundred kilometers apart. The first was Jorullo, which erupted in 1759, and the second is Paricutín.

Dominating the valley where Paricutín now exists is the peak of Tancítaro, the highest point in the state of Michoacán at 3845 meters (12,615 feet), and sometimes snow-capped in winter. In 1943, the local Purépechan Indians inhabited a series of small villages and towns spread across the valley floor. The villages included Angahuan, which still exists today, Paricutín, where all 500 people lost their homes, and San Juan Parangaricutiro. The latter was once famous for hand-woven bedspreads and quilts and consequently known as San Juan de las Colchas (bedspreads). Its church, begun in 1555, had never been finished and only ever had a single tower.

On 20 February 1943, a local campesino named Dionisio Pulido was tending his crops with his wife Paula, their son and a friend. At about 4:00pm, they noticed a small crack and felt the ground shaking under their feet. While they watched, the ground rose more than 2 meters and smoke rose into the air, accompanied by whistling noises and the smell of sulfur. Sparks set fire to a nearby pine tree. Not surprisingly, they fled!

Legend has it that Dionisio first tried to smother the emerging volcano with loose rocks and afterwards was of the opinion that the volcano would never have erupted if he hadn’t plowed his field, but such reports are almost certainly pure fiction.

The volcano grew rapidly, providing onlookers, visiting vulcanologists and residents alike, with spectacular fireworks displays. The month of March was a particularly noisy time in Paricutín’s history—explosions were heard as far away as Guanajuato and ash and sand were blown as far as Mexico City and Guadalajara.

After one week, the volcano was 140 meters high, and after six weeks 165 meters.

In April 1943 there were major lava flows, originating from about 10 kilometers underground. These lavas were basaltic; their chemistry suggested temperatures inside the volcano of between 960o and 1020oC. More than 30 million metric tons of lava flowed from the volcano between April and June 1943, raising the volcano’s height to more than 400 meters before its first birthday.

In early 1944, another lava flow streamed in a gigantic arc reaching the outskirts of the town of San Juan Parangaricutiro. Fortunately, the town had already been abandoned following many earthquakes, some of which rang church bells as far away as Morelia! The lava flowed about 30 meters a day and went right through the church but, miraculously, left the main altar standing. The parts of the church which survived in “old” San Juan, including its altar, can still be visited today, though reaching them involves clambering over jagged blocks of lava.

The villagers who had abandoned the town were escorted to Uruapan for safety. Some of them later founded a new town called San Juan Nuevo. Other villagers moved away to live in Los Reyes, Uruapan, Angahuan, Morelia and Guadalajara.

Yet another lava flow buried the village of Paricutin which fortunately had also been evacuated in time. Nothing remains of this village, covered by lava which is more than 200 meters thick in places! A small cross atop the lava marks its approximate position. Besides lava, ashes and dust were also thrown out by the volcano. The ash was 1 millimeter thick in Guadalajara, 25 centimeters thick in Angahuan, and 12 meters thick near the cone. The volcano rose 410 meters above the original ground surface.

Suddenly, in February 1952, nine years after the volcano first erupted, the lava stopped flowing. In many places, plumes of hot steam still rise as fumaroles from the ground, ground that is still most distinctly warm to the touch.

Enjoying a full day at Paricutín has been made much easier since the construction of rustic tourist cabins on the edge of Angahuan village. The restaurant, which serves tasty local specialties, gives clients a panoramic view encompassing the lava and the half-buried church. A small permanent exhibition of maps, charts and photographs in one of the cabins, describing the volcano’s history and the surrounding area, was inaugurated in February 1993 to commemorate the 50th anniversary of the volcano.

Horses can be hired for a trip to the church or to the more distant cone of the volcano. The latter requires an early start since the last part involves clambering up the loose ashes and cinders which comprise the cone and scrambling onto the narrow rim of the truly magnificent crater. A marvelous view can be enjoyed from atop the crater rim and only then can the full extent of the area devastated by the volcano be fully appreciated. Nothing can quite have prepared you for this startling lunar-like landscape.

Note:

This post is a lightly edited extract from my “Western Mexico: A Traveler’s Treasury” (Sombrero Books, 2013). Chapter 35 describes Paricutín Volcano and its surrounding area, including the fascinating indigenous village of Angahuan, in much more detail. “Western Mexico: A Traveler’s Treasury” is also available as either a Kindle edition or Kobo ebook.

Related posts:

The crater lake of Santa María del Oro yields evidence for climate change

 Books and resources  Comments Off on The crater lake of Santa María del Oro yields evidence for climate change
Feb 142013
 

A magnificent crater lake nestles in a centuries-old volcanic crater a short distance east of the town of Santa María del Oro in Nayarit.

The connecting road from Highway 15 first passes through the former mining town of Santa María del Oro and then rises slightly to offer a splendid view of the beautiful slate-blue lake (known locally as “La Laguna”), set in a ring of verdant hills. In recent years, the lake, a good example of a geomorphosite, has become important for tourism with accommodations ranging from RV spaces to a boutique hotel. It takes about an hour and a half to stroll round the track that encircles the crater lake. Other attractions include visiting an abandoned gold mine (which offers a glimpse into the area’s past), birding, mountain biking, swimming or hiring a rowboat or kayak to venture out onto the lake.

Crater Lake, Santa María del Oro. Credit: Tony Burton

Crater Lake, Santa María del Oro. Credit: Tony Burton

This usually quiet lake has proved to be a valuable source of information for geologists and climatologists investigating the history of climate change in this region of Mexico.

The researchers who published their findings in 2010 in the Bulletin of the Mexican Geological Society extracted a sediment core from the deepest part of the lake. The relatively small area of the drainage basin surrounding the lake and the relatively steep slopes of surrounding hills mean that the sediments entering the lake are rarely disturbed after they are deposited. Wind and wave action are limited. The depth of the lake (maximum 65.5 meters) also helps to ensure that sediments remain undisturbed for centuries. This gives perfect conditions for a reliable sediment core.

Santa María del Oro. Credit: Google Earth

Santa María del Oro. Credit: Google Earth

The team analyzed the titanium, calcium and magnetism levels of successive thin slices of the core. By comparing the core with historic records and previous tree ring analyses from the same general area, they were able to accurately date each slice. The titanium levels in each slice allowed the researchers to quantify how much runoff occurred in that year, a proxy indicator of precipitation.

The team identified 21 significant drought events over a period of 700 years. The six most marked droughts occurred in 1365–1384, 1526, 1655-1670, 1818, 1900 and 1930-2000. They found periodicities of 25, 39, 50, 70 and 117 years for drought events, meaning that droughts occurred at fairly regular intervals of about 20-25 years.

The researchers then looked at the possible correlation between periods of drought and two distinct climatological factors: a shift to the south in the position of the Inter Tropical Convergence Zone (ITCZ) in summer and the occurrence of El Niño Southern Oscillation (ENSO) events. When the ITCZ does not extend as far north as usual during Mexico’s summer rainy season, states such as Nayarit and Jalisco receive less than their normal amount of rainfall. During ENSO events, rainfall is also diminished in central and western Mexico.

Of the 21 droughts identified and studied, 7 proved to be statistically linked to ENSO events, 10 to ITCZ movements, and the remaining 4 events were closely linked to a combination of both.

As the study concludes, titanium analysis of sediments may allow for a more refined record of climate change in the period prior to reliable historic or instrumental records which might improve the understanding of how and why climate change occurred in past

Santa María del Oro is also worth visiting because it is only a short distance away from the edge of the canyon of the River Santiago and the El Cajón hydro-electric power project, one of three major HEP projects located along that river.

Source article:

Susana Sosa-Nájera, Socorro Lozano-Garcí, Priyadarsi D. Roy and Margarita Caballero. Registro de sequías históricas en el occidente de México con base en el análisis elemntal de sedimentos lacustres: El caso del lago de Santa María del Oro. Boletín de la Sociedad Geológica Mexicana, Vol 62, #3, 2010, p 437-451.

Santa María del Oro and surrounding areas are described in chapter 24 of the recently published 4th (Kindle/Kobo) edition of my Western Mexico: A Traveler’s Treasury (Sombrero Books, 2013).

Related articles:

Colima Volcano erupts, destroying lava dome first created in 2007

 Mexico's geography in the Press  Comments Off on Colima Volcano erupts, destroying lava dome first created in 2007
Jan 142013
 

Colima Volcano (aka the Volcán de Fuego) is one of the westernmost volcanoes in Mexico’s Volcanic Axis, which straddles the country from west to east. The Volcano’s summit is only 8 km (5 miles) from the inactive Nevado of Colima volcano, Mexico’s sixth-highest peak, which rises 4260 m (13,976 ft) above sea level. (Curiously, despite their names, the summits of both volcanoes are actually located in the state of Jalisco and not the state of Colima.)

The elevation of Colima Volcano is officially given as 3820 m (12,533 ft) above sea level. In the past 400 years, it has been the most active volcano in Mexico, having erupted at least 30 times since 1576.

It is also considered to be one of the country’s most dangerous volcanoes. Numerous villages in its shadow keep a wary eye on its level of activity, and emergency evacuations have become a regular event in the past fifty years.

Colima Volcano, 11 Jan 2013. Photo: Protección Civil.

Colima Volcano forms new crater, 11 Jan 2013. Photo: Edo de Jalisco Protección Civil.

On a geological time-scale, the volcano first erupted about five million years ago in the Pliocene period, long after activity ceased at the nearby, and higher, Nevado de Colima. It quickly developed into a large volcano which partially blew apart or collapsed during Pleistocene times to form a caldera, five kilometers across. A new cone developed inside the caldera. This is the Volcán de Fuego we see today.

The cone is built mainly of pyroclastic materials (ashes and volcanic bombs) of andesitic composition together with some basaltic lava, making it a classic example of a composite volcanic cone.

Historically, the eruptions of the volcano have fallen into a definite cyclical pattern with periods of activity, each lasting about 50 years, interspersed with periods of dormancy. The first cycle of activity (after the Spanish arrived in Mexico) was between 1576 and 1611. Major eruptions occurred in 1680 and 1690, and further complete cycles occurred between 1749 and 1818, and from 1869 to 1913. Most geologists agree that current activity is part of the fifth cycle, which began in 1961.

A three year sequence of prior activity (2003 to 2005) is shown on this series of NASA satellite images.

Hazard Map of Colima Volcano (2003) Credit: Universidad de Colima, Observatorio Vulcanológico

Hazard Map of Colima Volcano (2003) Credit: Universidad de Colima, Observatorio Vulcanológico. Click for full-size image (large file size)

In each major cycle, the first results of renewed activity force new lava into the existing crater, forming a dome. Once the crater has filled up, any additional lava is ejected from the crater and flows down the volcano’s flanks. If the lava is unable to escape (relieving the underground pressure), the dome is liable to explode, which is exactly what happened a few days ago:

As on several previous occasions, once the subterranean pressure that caused the activity has been relieved, activity should cease, and the volcano will enter another less dangerous dormant phase. Even during this phase, a plume of hot gas often billows out from the volcano.

The dome that was destroyed in January 2013 began to build in 2007. The explosive activity on 6 January and 10 January 2013 left behind a new crater 220 meters (720 ft) across and about 50 m (165 ft) deep. According to the Jalisco-Colima Scientific Committee (which oversees the hazard analysis posed by the volcano), the events of 6 and 10 January emitted an estimated  1.5 million cubic meters of material, which formerly formed the dome. The 10 January explosion, which occurred at 21:40 hrs local time, sent incandescent material down the west flank of the volcano. An ash column rose about 3000 meters into the air before traveling north-eastwards on the wind towards the city of Ciudad Guzmán.

Thermal imaging shortly after the 10 January explosion showed that the temperatures in the crater are below 200 degrees Centigrade, which indicates relatively little gaseous build up and limited risk of further major explosions. Even so, a prudent 7.5 km exclusion zone is being maintained around the volcano.

Update (29 Jan 2013):

Another explosion at 3:58 am on 29 January 2013 created a plume of ash and cinders that rose more than 3000 meters above the volcano. The ash fell of nearby villages, including Los Mazos, Ejido Atenquique, Tuxpan and Huescalapa.

The area around the volcanoes is described in more detail in chapter 15 of “Western Mexico, a Traveler’s Treasury” (4th edition; Sombrero Books, 2013).

Related posts:

The Teziutlán disaster of 5 October 1999, a case study of vulnerability

 Other  Comments Off on The Teziutlán disaster of 5 October 1999, a case study of vulnerability
Oct 042012
 

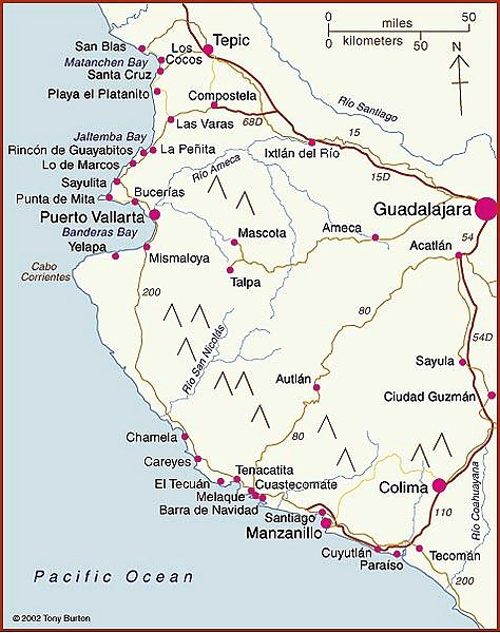
Today marks the 13th anniversary of a major disaster that struck Teziutlán (current population about 65,000), a small city in the Eastern Sierra Madre, in the northeast corner of the state of Puebla, close to the border with Veracruz. The city is noteworthy as the birthplace of two prominent twentieth-century politicians: Manuel Ávila Camacho (served as President, 1940–1946) and Vicente Lombardo Toledano, who founded the Confederación de Trabajadores de México (CTM), Mexico’s largest confederation of labor unions.

The town’s name means “place of the hailstones”. But in 1999, it was not hailstones but torrential rain that triggered the major disaster of 4/5 October, with parts of the city destroyed by a series of landslides and mudflows. More than 80 municipalities were affected to some degree by this tremendous storm. Hundreds of landslides occurred in Hidalgo, Veracruz and Puebla states, causing an estimated US$457 million worth of damage, and at least 260 deaths.

This post focuses only on the consequences for Teziutlán where several hundred homes were completely destroyed and almost a thousand homes suffered partial damage. More than 100 Teziutlán residents lost their life. The local infrastructure, roads, housing, schools and farming were all severely impacted.

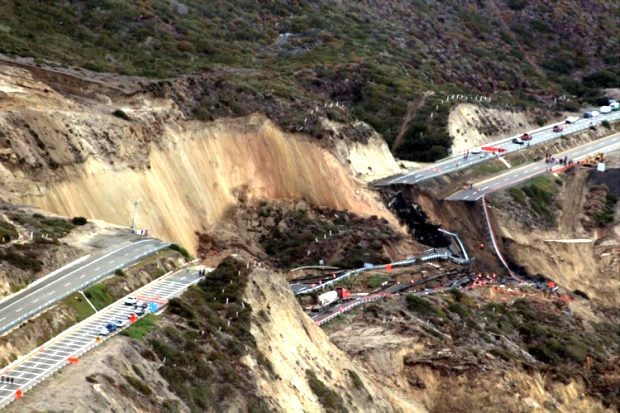
The worst damage was in the La Aurrora district on the eastern side of the city, where a landslide on a 23-degree slope buried more than 130 people. In another district, La Gloria, in the western part of the city, several more slips, flows and slides damaged homes, but without any fatalities.

With the benefit of hindsight, this disaster offers a good case study of the factors which made the inhabitants of Teziutlán particularly vulnerable to such an event. The diagram suggests one general classification of the multitude of factors that can affect vulnerability. In the case of Teziutlán, the discussion that follows suggests that the physical factors were probably the most significant.

factors affecting vulnerability

Factors affecting vulnerability (Geo-Mexico, Figure 7.2) All rights reserved.

Physical factors

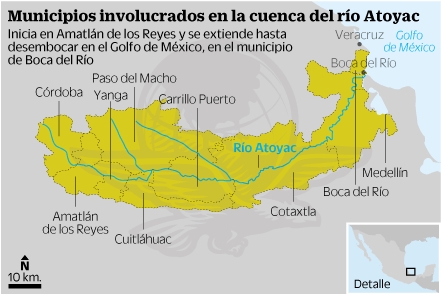
1. Relief and geology. The area ranges in elevation from 300-2,280 meters above sea level and is drained by the El Calvario, Xóloatl and Xoloco rivers. The city is located at the southern limit of the Eastern Sierra Madre (Sierra Madre Oriental), very close to where it is truncated by the geologically more recent Volcanic Axis. The local geology includes a series of loosely compacted, pumice-rich pyroclastic flows, most of which are thought to be associated with the Los Humeros caldera. These deposits are interlaced with palaeosoils rich in clay which are impermeable and restrict the infiltration of rainwater, and overlie older folded rocks. The combination of steep slopes and impermeable, unconsolidated layers increases the risk of landslides and other forms of mass movement.

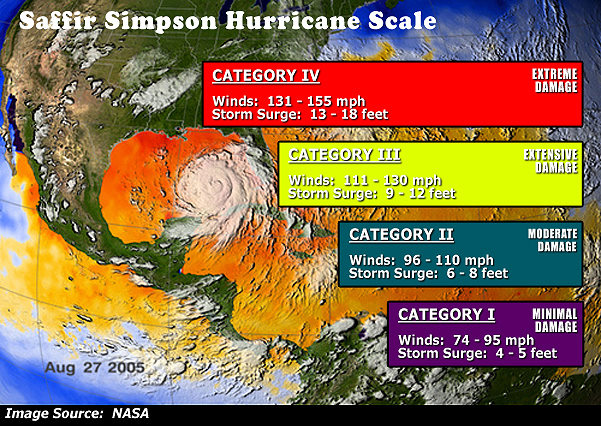
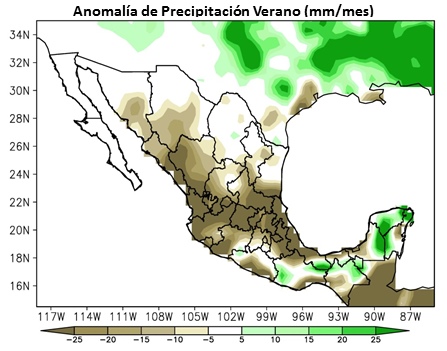
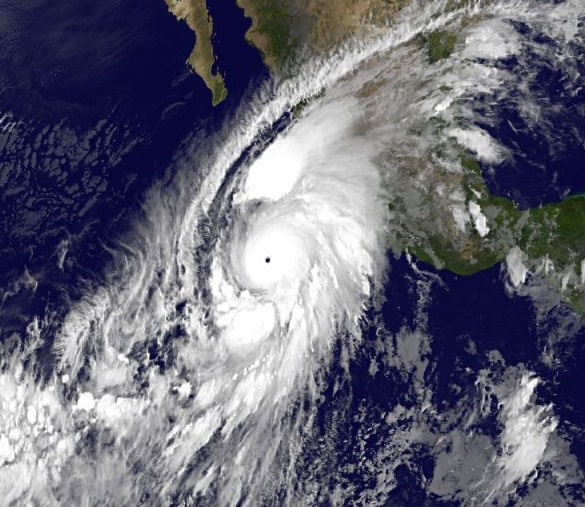
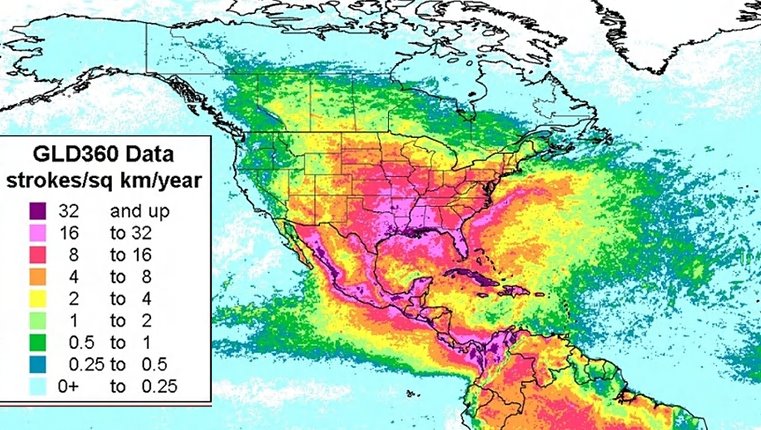
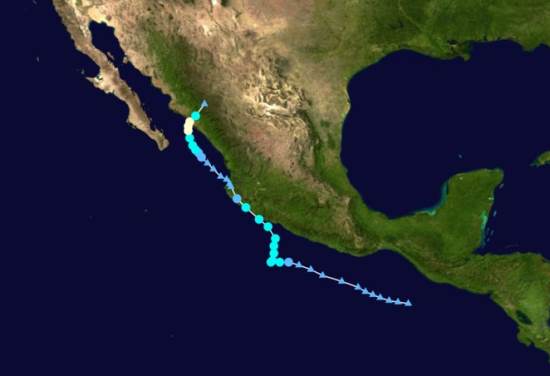
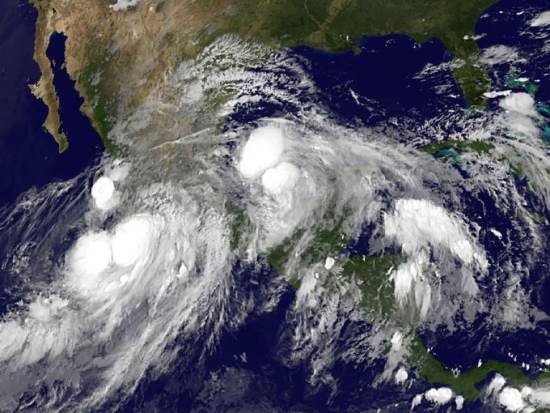
2. Climate.  This mountainous region is one of the most humid and foggiest in Mexico, averaging 280 days of mist or fog each year. Teziutlán has an average precipitation of 1600 mm/yr, though totals of over 2000mm are not that uncommon. Most rain falls between July and October.On 4 October 1999, a moist tropical depression off the coast of Veracruz was prevented from moving by a cold front. This led to an increase in humidity followed  by torrential downpours (over 300 mm of rain) over Teziutlán and the surrounding area. The storm continued the next day when a further 360 mm of rain fell.  The rain that fell on just those two days was equivalent to about 40% of Teziutlán’s usual total for an entire year.

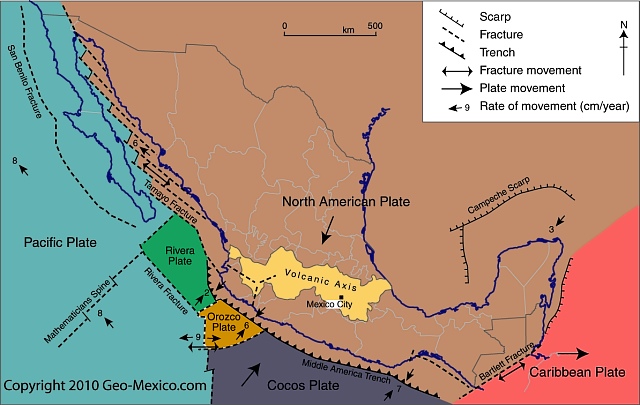
3. Earthquake A few days prior to the storm, on 30 September 1999, a 7.4-magnitude earthquake occurred off the coast of Puerto Escondido (Oaxaca). This earthquake did cause  minor cracks in some homes in Teziutlán, and it possibly played a (minor) contributory role in the severity of the storm’s impacts.

Environmental

Deforestation, as a consequence of unplanned urban growth, was also important. Natural and secondary woodlands were steadily being cleared for construction and agriculture. This had an adverse effect on infiltration rates and the capacity of the land to absorb rainwater. However, given the extreme magnitude of the rainfall event, it is unlikely that the area would have escaped unscathed, even if the natural forest had remained.

In the La Aurrora district, where a landslide/mudflow buried more than 130 people, the construction of  a cemetery on a hill above La Aurrora may have played a part, since it appears that a cemetery wall held rainwater back, allowing more of it to seep into the underlying slope, increasing its susceptibility to a serious slide.

La Aurrora, October 1999. Credit: Periódico Sierra Norte

La Aurrora, October 1999. Credit: Periódico Sierra Norte

Educational

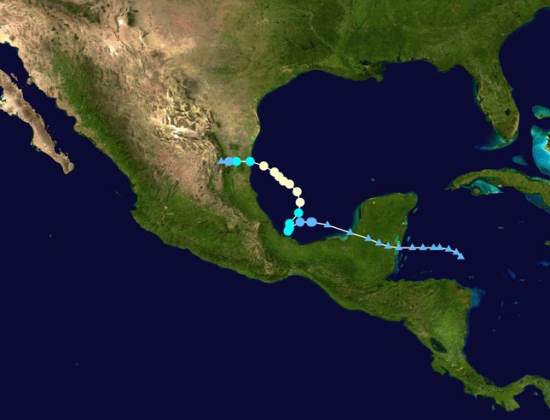
The town had suffered severe mass movements during prior storms. For example, in 1955, the rains that accompanied Hurricane Janet provoked numerous mass movements resulting in the disruption of transport systems, including the main highway, but with no loss of life. However, in general, it is clear that these prior events did not increase Teziutlán’s preparedness for a similar event in the future. In particular, prior events did not lead to building regulations being enforced or prevent buildings from being erected in high-risk areas.

Social/Demographic

In the period following the last major event (in 1955), the population of Teziutlán had increased rapidly, leading to the equally rapid expansion of the urban area. This was uncontrolled and included construction on steep slopes with insufficient attention to stability or possible mass movement mitigation measures being taken. It is worth noting that the population has continued to increase rapidly since the disaster, too.

Economic

Home owners in Mexico do not generally carry insurance on their properties, and even when they do, it often specifically excludes major meteorological events. It is unlikely that any of the residents of Teziutlán were able to make insurance claims. Many of the those affected would not have had savings and would have been forced to rely on family, friends and emergency hand-outs to survive. As a 1999 BBC News article emphasizes, government help was slow to arrive.

Want to see more?

There are several Youtube videos with images of the disaster. Perhaps the most interesting is TEZIUTLAN 1999 – 10 años Después del desastre  because it includes some clips from an investigative 1995 TV program aired in 1995 (four years prior to the landslide) that highlighted the extreme risk of constructing unauthorized buildings on the steep slopes of the town along the main highway. This video includes many excellent photos [warning: some graphic images] of the landslide and its aftermath, with a commentary [in Spanish].

Other valuable Youtube resources include Teziutlan Desastre 1999 which has additional photos, plus some eyewitness memories of the event [in Spanish], and TEZIUTLAN historia y tragedia which has many photos of the disaster, accompanied by music only (no commentary) making it a good choice for English-speaking classes.

Sources:

Alcántara-Ayala, I.  Flowing Mountains in Mexico. Mountain Research and Development, Vol 24, No. 1, Feb. 2004: 10-13.

Flores Lorenzo, Pablo & Irasema Alcántara Ayala. Cartografía morfogenética e identificación de procesos de ladera en Teziutlán, Puebla. Boletín del Instituto de Geografía, UNAM. #49, 2002, pp. 7-26. [pdf file]


Aug 022012
 

The rainy season is now well underway in most of Mexico, but large swathes of the north are still experiencing severe drought conditions. For example, the state of Zacatecas was recently officially declared a drought disaster zone. It is still too early to estimate the total economic impact of the drought, but the U.S. Department of Agriculture (USDA) has reported that the drought has already caused agricultural damages in Mexico of $1.2 billion dollars, in addition to the $8 billion dollars of losses for Texas.

The drought has raised many issues connected to trans-border water agreements and flows, with renewed calls for them to be formally reviewed and updated. Two examples should suffice to show the seriousness of the situation.

1. Under the terms of a 1906 bilateral treaty, Mexico is entitled to 74 million cubic meters from the Elephant Butte and Caballo reservoirs in New Mexico. However, according to Adolfo Mata, foreign affairs officer for the U.S. Section of the International Boundary and Water Commission (IBWC), the USA will only be able to deliver a maximum of 18.5 million cubic meters this year.

2. Meanwhile, south of the border, the governor of the state of Chihuahua has stated that his state is unable to meet its obligation to deliver water to the USA under the terms of a 1944 International Water Treaty between the two countries. He said that, “No one can give what they do not have. Chihuahua cannot meet this treaty, not for a lack of will, but because it has not rained,” adding that Chihuahua was the only desert in the world that was expected to export water. According to the governor, the treaty requires that about 80% of the rainfall that Chihuahua receives is exported.

On a more positive note, researchers at the Ibero-American University have announced the development of a hydrogel capable of absorbing 200 times its own weight of water before gradually releasing it. The hydrogel could be a useful additional to the range of drought mitigation measures available for farmers. Climate change scientists predict that northern Mexico will suffer from more frequent and more severe droughts in coming decades.

The hydrogel, which is expected to cost 800 pesos (60 dollars) a kilo when it comes on the market, is a mix of natural gelatine and polyacrylic_acid  Hydrogel can only be used in orchards or other areas where the soil remains undisturbed by regular plowing, so it will not help farmers growing corn or beans, for example. The hydrogel has been tested in citrus orchards in San Luis Potosí, and succeeded in halving the required frequency of irrigation from twice a week to once a week, saving water and reducing energy costs. Each citrus tree required a kilo of hydrogel each year.

Previous posts related to the drought:

Hurricane names and forecast for 2012

 Mexico's geography in the Press  Comments Off on Hurricane names and forecast for 2012
May 172012
 

The 2012 hurricane season in Mexico is underway. The “official” hurricane season is from 15 May to 30 November each year for Pacific coast storms, and from 1 June to 30 November for Atlantic storms, though most hurricane activity is concentrated in the months from July to September. Hurricanes are also known as typhoons or tropical cyclones.

The table shows the World Meteorological Organization’s official list of 2012 hurricane names. Note that male and female names alternate. Names are often reused in future years, with the exception of the names of any particularly violent storms, which are officially “retired” from the list for a long time.

2012 Hurricane Names for the Atlantic, Gulf of Mexico and Caribbean
AlbertoGordonLeslieRafael
BerylHeleneMichaelSandy
ChrisIsaacNadineTony
DebbyJoyceOscarValerie
ErnestoKirkPattyWilliam
Florence

2012 Hurricane Names for the Eastern Pacific
AlettaGilmaMiriamTara
BudHectorNormanVicente
CarlottaIleanaOliviaWilla
DanielJohnPaulXavier
EmiliaKristyRosaYolanda
FabioLaneSergioZeke

This year, Philip Klotzbach and William Gray, researchers at Colorado State University,expect hurricane activity in the Atlantic to be lower than average, about half as active as last year, when 20 tropical storms, seven hurricanes and four major hurricanes were recorded. They predict that in the 2012 season 10 named storms will form in the Atlantic: 6 tropical storms, 2 moderate hurricanes (1 or 2 on the Saffir-Simpson scale), and 2 severe hurricanes (3, 4 or 5 on the Saffir-Simpson scale).

Want to know more about the way in which the prediction is made and what it is based on?

For the Pacific coast, Mexico’s National Meteorological Service (Servicio Metrológico Nacional, SMN) is expecting 13 storms: 7  tropical storms, 4 moderate hurricanes (1 or 2 on the Saffir-Simpson scale), and 2 severe hurricanes (3, 4 or 5 on the Saffir-Simpson scale). The SNM publishes regular updates on hurricane activity (in Spanish) on its webpage and via its Twitter account: @huracanconagua.

Related posts: