Which are the best states in Mexico for doing business in 2016?

 Mexico's geography in the Press  Comments Off on Which are the best states in Mexico for doing business in 2016?
Sep 232016
 

A study just released by the World Bank and the International Finance Corporation, Doing Business en México 2016, compares Mexico’s 32 states for the paperwork, time and costs associated with four major indicators: opening a new business, obtaining construction permits, registering industrial property rights and the resolution of commercial disputes.

The report concludes that the seven best states in which to do business are Aguascalientes, the State of Mexico, Colima, Puebla, Sinaloa, Guanajuato and Durango, all of which offer a better performance than the average for OECD high income countries.

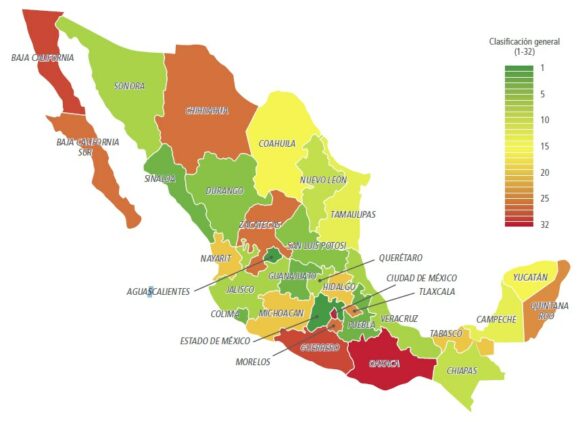
doing-business-2016-fig-1-2

Overall ranking for Doing Business in Mexico 2016 (Source: Fig 1-2 of World Bank Report)

The three states that have advanced the most towards implementing international best practices since 2014 are Puebla, Jalisco and the State of México.

The map shows the rank order of states for doing business, from green (the best) to red (the lowest ranking). Unlike many maps of state-by-state performance, this map does not show any evidence for the north-south divide we have repeatedly commented on in the past.

Related posts:

Which states grew fastest in 2015?

 Updates to Geo-Mexico  Comments Off on Which states grew fastest in 2015?
Aug 112016
 

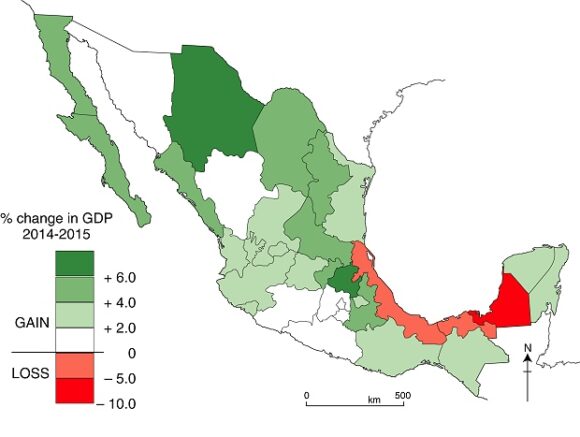
The map shows the percentage change in each state’s GDP during 2015. (Data from the National Statistics Agency, INEGI).

Change in GDP, by state, 2014-2015. Data: INEGI. Cartography: Tony Burton / Geo-Mexico

Change in GDP, by state, 2014-2015. Data: INEGI. Cartography: Tony Burton / Geo-Mexico

The fastest growing states in 2015 were Hidalgo (6.3%), Chihuahua (6.2%) and Nuevo León (5.9%).

While the economy of most northern Mexico states grew at a respectable rate during 2015, the economies of three Gulf coast states actually shrank last year, mainly owing to the drop in oil prices. GDP fell in three oil-rich states: Campeche (- 8.2%), Veracruz (- 2.3%) and Tabasco (- 0.2%).

Related posts:

Mar 072016
 

Tourism accounts for about 9% of Mexico’s GNI and provides almost 4 million direct jobs. In 2015, Mexico welcomed a record 32.1 million international tourists, making it the 10th most popular international destination in the world. They spent a combined $17.5 billion in the country. Almost 50% of these overseas visitors arrived by air; they accounted for 80% of total foreign tourist expenditures.

Mexico_Tourism

This year, tourism officials are predicting that 35 million international foreign visitors will holiday in Mexico, with total spending of 19 billion dollars. Officials believe, probably optimistically, that Mexico can attract 40 million tourists in 2018 and 50 million by 2030. They stress the need for policies that will result in more hotels, additional air routes, new attractions, and packages designed for niche markets including health, religion, and seniors-based tourism.

Related posts:

Jul 092015
 

The Jalisco state government has released an informative 5-minute video highlighting some of the reasons why Jalisco is one of the best locations in Mexico for farming, business and tourism.

The video can be viewed on Facebook: Esto es Jalisco. This is Jalisco.

Following opening shots showing some of the diverse landscapes of the state, including the Piedrotas at Tapalpa, the majestic Volcán de Colima (whose summit is actually in Jalisco, not Colima) and the Horseshoe Falls near the Dr. Atl park on the northern edge of Guadalajara, the video’s subtitles (in English) turn to techno0logy and innovation. Jalisco is the first state in Mexico to have a Ministry of Innovation, Science and Technology. The state capitol Guadalajara is the center for MIND (Mexican Innovation and Design Center) and was chosen by MIT for the establishment of a Creative Digital City.

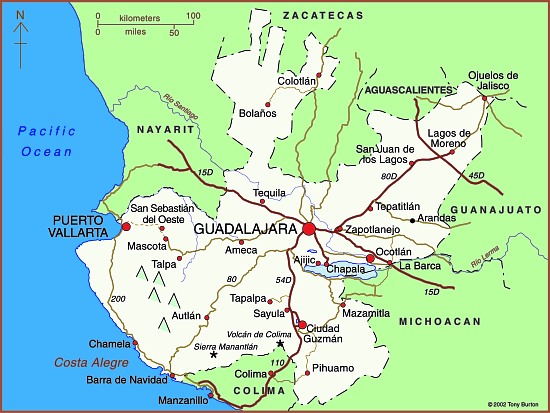
Map of Jalisco state

Map of Jalisco. Copyright 2010 Tony Burton. All rights reserved.

The city also has major cultural and sporting attractions, from libraries to golf courses to hosting international events in the Expo Guadalajara to concerts and its own international film festival. It also hosts the world’s second largest book fair (after Hamburg). Its industrial activity ranges from agro-processing (including tequila) to pharmaceuticals, information technology, automotive and aerospace firms to renewable energy enterprises.

Foreign investment in Jalisco has risen by an average of 17% a year for the past decade, with foreign firms finding the state’s geographic position advantageous for serving central Mexico and with excellent trade links to Asia and the U.S.

The state’s leading coastal resort is Puerto Vallarta, but tourism is also important in the state’s interior. Jalisco has five places with Magic Town status: Lagos de Moreno, San  Sebastian del Oeste, Tapalpa, Mazamitla and Tequila.

Jalisco currently accounts for 6.6% of national GDP and the state government clearly expects this contribution to grow in coming years. This professionally-produced video is an excellent visual introduction to one of Mexico’s most important states.

Related posts:

May 282015
 

Remittances sent home by Mexican migrants (almost all of them residing in the USA) rose to $2.26 billion in March 2015, 7.6% higher than the same month a year earlier. This was the highest monthly figure since May 2012, and the highest ever figure for March.

The average remittance sent to Mexico in March 2015 was $311.30, the highest figure since July 2012, and the number of transfers was 7.25 million.

The March figure brought the total remittances for the first quarter of this year to $5.7 billion, 4.9% higher than the same period in 2014.

Workers in California sent remittances worth $1.59 billion home during the first three months of this year, more than the workers in any other state. Texas came in second place with $763.9 million and Illinois placed third at $199.3 million.

The three main receiving states in Mexico were:

  • Michoacán – $603 million
  • Jalisco – $539 million
  • Guanajuato – $509 million

For an introduction to the topic of remittances, with links to some of the key posts on this blog, see

A comprehensive index page listing all the posts oon Geo-Mexico related to migration and remittances can be found at Migration and remittances: an index page.

Mexico attracting significant inflows of FDI

 Mexico's geography in the Press, Updates to Geo-Mexico  Comments Off on Mexico attracting significant inflows of FDI
May 212015
 

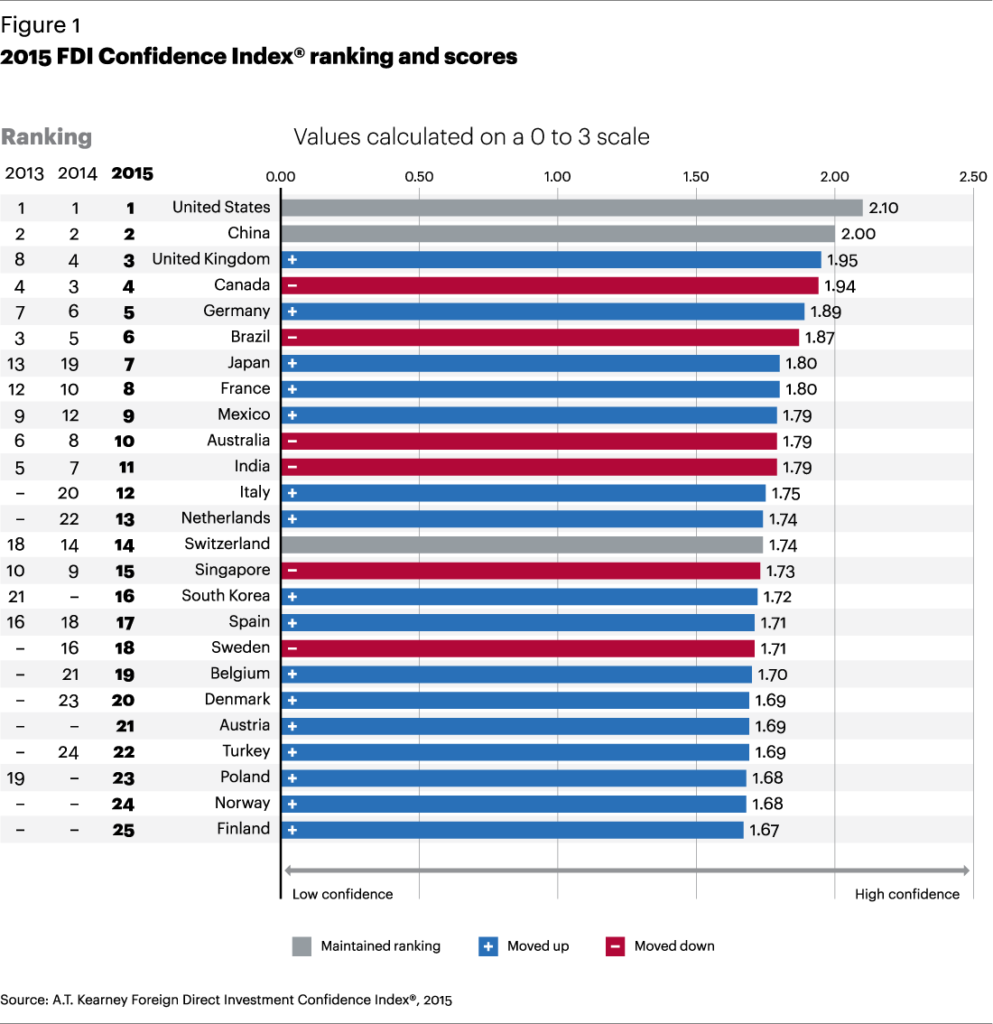
According to the 2015 Direct Foreign Investment Confidence Index of consultancy A.T. Kearney, Mexico is currently the ninth most attractive country worldwide for FDI (Foreign Direct Investment). Mexico has risen 3 places in the rankings since the 2014 Index was released.

The report highlights the improving business climate in Mexico following the implementation of the government’s reform agenda, and says that “investors continue to be drawn to opportunities in many sectors, including manufacturing, energy, and telecoms”.

The top 10 countries in the overall FDI rankings (see graph) are U.S., China, U.K., Canada, Germany, Brazil, Japan, France, Mexico and Australia.

FDI-COnfidence-Index2015

The report says,

Mexico gains three spots to reach 9th, as President Enrique Peña Nieto’s reform agenda continues to improve Mexico’s business climate. Its 2013 FDI levels of $38 billion were an all-time high, with the majority of investment targeted at Mexico’s growing manufacturing sector, including high-value-added electronics. Mexico’s Economy Ministry has reported that flows fell to $22.6 billion in 2014, with inflows of $33.9 billion offset by $11.4 billion in outflows. Significant reforms in the energy sector will occur this year to allow foreign private investment.

As a result of the telecom reforms that targeted Carlos Slim’s América Móvil, which controls 70 percent of the market, customer prices fell nearly 17 percent between February 2013 and January 2015. In response to the policy changes, AT&T made a $5 billion divestment in América Móvil and subsequently acquired Grupo Iusacell SA, Mexico’s third-largest wireless operator, for $1.7 billion. Going forward, these reforms are expected to open up growth opportunities for smaller competitors.

In November 2014, the American chemicals maker PPG Industries acquired paints maker Consorcio Comex for $2.3 billion. This followed the rejection by the Mexican federal competition authority of the sale to Sherwin-Williams for a proposed $2.34 billion on the grounds that it would create unfair market conditions.

According to this recent press report, Mexico’s FDI during the first three months of 2015 totaled $7.573 billion, an all-time record for the first quarter. The figure comes from 1357 separate investments originating from the USA (59.4%), Spain (14.3%), Japan (8.2%), South Korea (4.8%), France (2.9%), and the Netherlands (2.3%), with the remaining 8.1% coming from 48 other nations.

Feb 232015
 

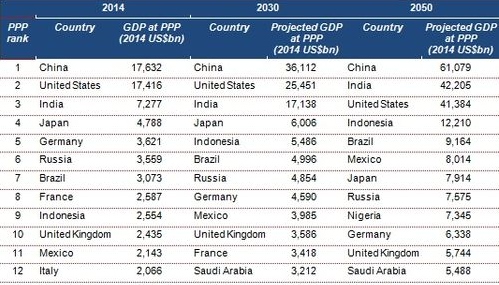
Consultancy PwC, the world’s second largest multinational professional services network has published an updated edition of The World in 2050. In the latest edition, The World in 2050: Will the shift in global economic power continue?, the authors present economic growth projections for 32 of the largest economies in the world, accounting for around 84% of global GDP.

world-2050-updated-version

“We project the world economy to grow at an average of just over 3% per annum in the period 2014 – 50, doubling in size by 2037 and nearly tripling by 2050.

But we expect a slowdown in global growth after 2020, as the rate of expansion in China and some other major emerging economies moderates to a more sustainable long-term rate, and as working age population growth slows in many large economies.

The global economic power shift away from the established advanced economies in North America, Western Europe and Japan will continue over the next 35 years. China has already overtaken the US in 2014 to become the largest economy in purchasing power parity (PPP) terms. In market exchange rate (MER) terms, we project China to overtake the US in 2028 despite its projected growth slowdown.

We project new emerging economies like Mexico and Indonesia to be larger than the UK and France by 2030 (in PPP terms) while Turkey could become larger than Italy. Nigeria and Vietnam could be the fast growing large economies over the period to 2050.”

A summary table in the PwC report shows the firm’s predictions for major economies in 2050 have Mexico continuing to progress up the world ladder, with its economy reaching world rank #6 by 2050, ahead of Japan, Russia, Nigeria and Germany.

Will the PwC forecasts turn out to be accurate? If this blog is still going strong in 2050, we promise to include an update…

The geography of Mexico’s beer industry

 Maps, Other  Comments Off on The geography of Mexico’s beer industry
Jan 292015
 

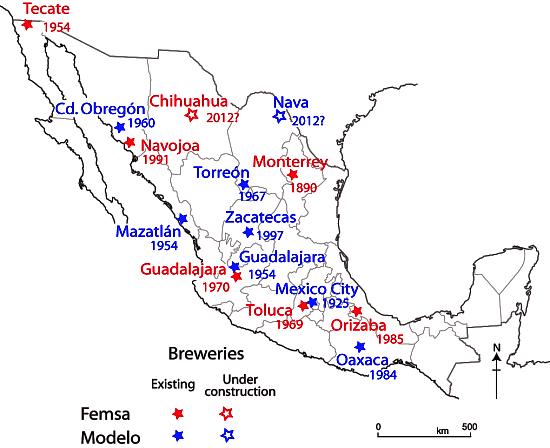
In a previous post – The emergence of two major beer-makers in Mexico – we looked at how Mexico’s beer industry came to be dominated by two large players: Femsa and Modelo, both now owned by foreign corporations.

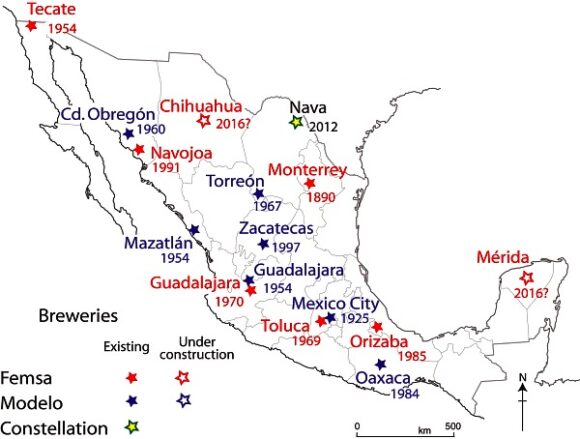
The map below shows the location and date of inauguration of all major breweries in Mexico.

The location and inauguration dates of Femsa and Modelo breweries in Mexico

The location and inauguration dates of Femsa and Modelo breweries in Mexico

How large is Mexico’s market for beer?

A 2010 report from the national beer industry claims that the average annual consumption of beer in Mexico is 60 liters per adult, a figure that has not changed significantly in the last 20 years. The equivalent figure in Germany is 120 liters a person, so there is still considerable potential for growth. Mexico’s breweries provide about 80,000 jobs directly and a further 800,000 indirectly.

Total beer sales each year are worth as much as 20 billion dollars. The value of sales has risen sharply, at about 5% a year, due mainly to higher exports. Mexico has become the world’s second largest beer exporter, after the Netherlands, and is the world’s sixth largest producer and consumer of beer, brewing over 8.6 billion liters a year.

The USA is the main export market. Five of the 25 most popular brands in the USA are Grupo Modelo beers: Corona, Modelo Especial, Corona Light, Pacífico and Negra Modelo. This has helped Grupo Modelo, Mexico’s leading brewer, become the world’s sixth largest brewer. Modelo’s Corona beer has been the #1 imported beer in the USA since 1997. It is one of the world’s top five beers in terms of sales, even though it is not especially popular in Mexico!

One of Modelo’s fastest growing export markets is China, where it has rapidly become the second most popular imported beer. In Mexico’s domestic beer market, Modelo and Femsa face increased competition from imported beers such as Budweiser, Miller and Heineken.

There are several other smaller breweries in addition to those owned by Femsa and Modelo. One significant trend, echoing other regions in North America, has been a marked upswing in the number of small, specialist, boutique breweries, such as Cervecería San Angel and the Santa Fe Beer Company in Mexico City and Minerva Brewery in Guadalajara. Other popular brands of craft beer include Perro Negro from Guadalajara, Insurgente from Tijuana, Libertadores from Michoacán and the varied products of the Baja Brewing Company from Los Cabos.

These smaller “craft” breweries produced 10.5 million liters of beer in 2014, according to the Mexican Beer Makers Association (Asociación de Cerveceros de la República Mexicana, Acermex), and account for only 0.16% of the total market, but their share of the market is growing at more than 40% a year. The association hopes that smaller breweries can enjoy as much as 1% of the market by 2016.

The rise of craft beers has seen a corresponding proliferation of specialist pubs that stock pale ales, pilsners, porters, stouts and wheat beers in the trendier districts of all the major cities, including Mexico City, Guadalajara, Monterrey and Querétaro.

In Guadalajara, in 2008, two local craft breweries – Cerveceria Minerva and  Cerveceria Revolución – co-founded the Guadalajara Beer Festival to showcase Mexican their products and introduce previously unavailable European import brands. The festival is now a three day event that attracts as many as 30,000 visitors a year; it claims to be Latin America’s largest beer festival.

Mexico’s economic geography is analyzed in chapters 14–20 of Geo-Mexico: the geography and dynamics of modern Mexico. Buy your copy of this invaluable reference guide today!

Which states in Mexico are the most competitive?

 Maps, Mexico's geography in the Press  Comments Off on Which states in Mexico are the most competitive?
Dec 032014
 

The Mexican Institute for Competitiveness (Instituto Mexicano para la Competitividad AC, IMCO) has published its annual analysis of the competitiveness of Mexico’s states. The report provides some interesting insights into which areas of Mexico are “most competitive” in business terms, defined as their capacity to attract and retain investments and a talented workforce.

This suggests a business environment that maximizes the socio-economic potential of both the business entities and individuals residing in a a specific area. It also suggests that any improved well-being (economic and social) will be maintained (sustained).

The index is based on 89 indicators in 10 sub-indices. The 10 major factors include the reliability and objectivity of the legal system, the sustainable management of the natural environment, the stability of macroeconomic policies, the degree to which society is non-divisive, educated and healthy, and the stability and functioning of the political system.

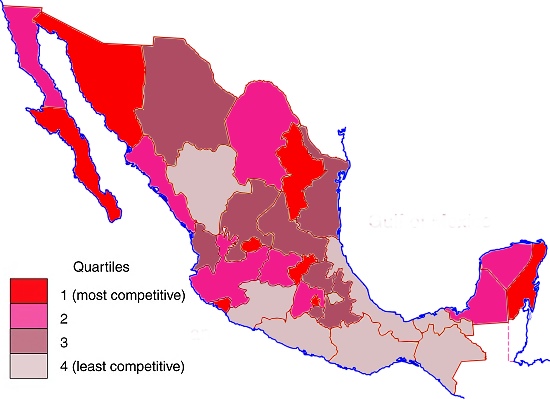
The latest report relies on 2012 data. Mexico’s basic pattern of competitiveness at the state level is shown in the map.

Mexico, 2014. Map: Tony Burton; all rights reserved

Competitiveness in Mexico, 2014. Map: Tony Burton; all rights reserved

The five most competitive states in Mexico are:

  • Federal District (Mexico D.F.)
  • Baja California Sur
  • Aguascalientes
  • Nuevo León
  • Querétaro

While a full analysis of why some states are more competitive than others is beyond the scope of this post, the single most striking aspect of this map is the persistent low degree of competitiveness of several of Mexico’s poorest states, such as Guerrero, Oaxaca and Chiapas.

In general, states in Northern Mexico are noticeably more competitive than those in Southern Mexico. Two areas on opposite coasts where tourism is extremely important to the local and national economy – Baja California Sur and Quintana Roo – are both very competitive.

Mexico’s economy and workforce are analyzed in chapters 14 to 20 of Geo-Mexico: the geography and dynamics of modern Mexico. Ask your library to buy a copy of this handy reference guide to all aspects of Mexico’s geography today! Better yet, order your own copy, which will still arrive in time for Christmas…

Related posts:

Oct 202014
 

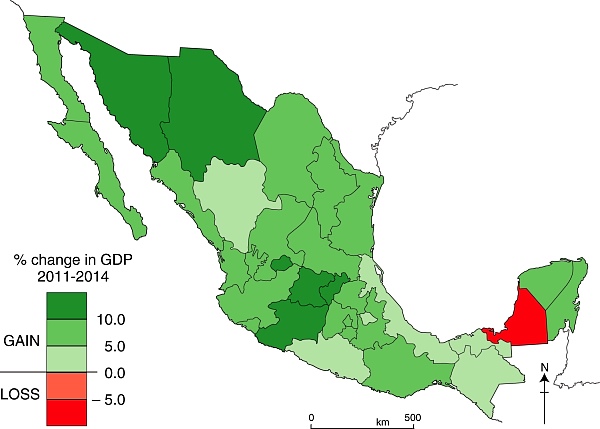
Which of Mexico’s states have the fastest growing economies? The map below, based on INEGI data, shows each state’s percentage change in GDP for the three year period from 31 March 2011 to 31 March 2014.

Change in GDP by state, 2011-2014. Data: INEGI. Credit: Geo-Mexico

Change in GDP by state, 2011-2014. Data: INEGI. Credit: Geo-Mexico

Only one state – Campeche – registered “negative growth” over the period. In Campeche, production from the oil fields that have long been a mainstay of the local economy has been gradually declining.

Besides Campeche, six states grew far slower than the average for Mexico: Durango, Veracruz, Tabasco, Chiapas and Guerrero. Not entirely coincidentally, several of these states are among the poorest in the nation, so their failure to grow as quickly as the average leaves them further behind, increasing the economic inequalities that plague Mexico’s development.

At the other end of the spectrum, the economic growth of six states – Sonora, Chihuahua, Aguascalientes, Guanajuato, Michoacán and Querétaro – easily outpaced the average for the country. Sonora, Chihuahua, Guanjuato, Querétaro, and to a lesser extent Aguascalientes, all benefited from foreign direct investments and new industries, such as those involved in  the vehicle manufacturing and aeronautical sectors.

The case of Michoacán is something of an anomaly, since that state’s economy is still heavily dependent on primary products such as avocados and iron ore. The positive growth in that state may prove to be mainly due to its negative growth in the preceding three years (2008-2011), which meant that it started the three year period shown on the map at an unusually low level. Perhaps more importantly, given the state’s recent political upheavals and gang-related violence, it is highly unlikely that Michoacán will continue to grow anywhere as quickly over the next three years.

Related posts:

Mexico’s annual GDP/person now stands at $16,463

 Updates to Geo-Mexico  Comments Off on Mexico’s annual GDP/person now stands at $16,463
Sep 292014
 

Recent World Bank figures reveal that Mexico’s GDP/person in 2013 reached $16,463 a year, an increase in GDP/person of 1.8% since 2012. (All figures in US dollars). Mexico’s 2013 GDP/capita is well above the Latin America and Caribbean average of $14,978.

The GDP figures are based on purchasing power parity (PPP) which overcomes gross distortions resulting from differences in exchange rates. For example, a haircut of the exact same quality might cost $15 in the USA, $5 in Mexico and $1 in China. Using the PPP approach, this same haircut would count as a $15 contribution to the GDP of each of the three countries.

Mexico’s GDP/person has grown at an average rate of 4.5%/year since 1991, according to the World Bank. Back in 1991, the GDP/person averaged $6,320.

Mexico’s GDP/person has risen quite sharply since 2008, when the comparable figure was $14,810, though its world rank (#80) is essentially unchanged. The figures suggest that economic growth has outstripped population growth over the past five years, making Mexicans better off (on average), and able to afford more goods and services, now than they were then.

Since 1991, Mexico’s GDP/person has declined in only three years:

  • 1994-1995 – decline of 10% due to world economic crisis
  • 2000-2001 – decline of 0.2%
  • 2008-2009 – decline of 2.2% due to world economic crisis

These figures suggest that Mexico’s economy has become more resilient when there is any slump in global markets.

Mexico’s most valuable brands, 2014

 Mexico's geography in the Press  Comments Off on Mexico’s most valuable brands, 2014
Jul 312014
 

Consultancy firm Interbrand México recently published its annual survey (2014) of the world’s 500 most valuable brands. The Mexican firms in the list are:

  • Telcel – cell phone service, valued at $5.8 billion (dollars),
  • Corona – principal product beer, valued at $4.3 billion
  • Telmex – fixed line telephone and internet service, valued at 3.6 billion
  • Oxxo – convenience stores, valued at 2.6 billion
  • Bimbo – bread and pastry products, valued at 2.4 billion

Compared to four years ago – Mexico’s most valuable brands (2010) -Banorte (finance and banking) and Claro (cell phone service) have dropped back, out of the top five, and have been replaced by Telmex and Oxxo

Note that these firms are not necessarily the largest firms in Mexico in terms of sales. Table 16.2 of chapter 19 of Geo-Mexico: the geography and dynamics of modern Mexico lists the ten largest Mexican private enterprises in 2008. Important aspects of several of these major firms are discussed in the chapters about manufacturing, construction and services, transportation, communications, etc.

Related posts

Country groupings: BRICs, EAGLEs and now MINTs

 Mexico's geography in the Press  Comments Off on Country groupings: BRICs, EAGLEs and now MINTs
Jun 122014
 

Economists have long suggested various sub-groupings of emerging markets. One of the most commonly used in geography is BRIC, an acronym formed from the initial letters of Brazil, Russia, India and China. The term BRIC was first coined by  Jim O’Neill in a 2001 paper entitled “The World Needs Better Economic BRICs”. The concept of BRICs has become outdated as the four countries’ economies have diverged over the past decade.

Next on the scene was the term EAGLEs to cover the world’s Emerging and Growth-Leading Economies. The advantage of this acronym is that it is not tied to specific countries. Any term comprised of country names is likely to date fairly quickly, and become much less useful. The members of the EAGLEs club are currently:

  • Brazil
  • China
  • Eqypt
  • India
  • Indonesia
  • Mexico
  • Russia
  • South Korea
  • Taiwan
  • Turkey

Combined, these ten EAGLEs are  expected to account for 50% of all global growth that occurs over the next 10 years.

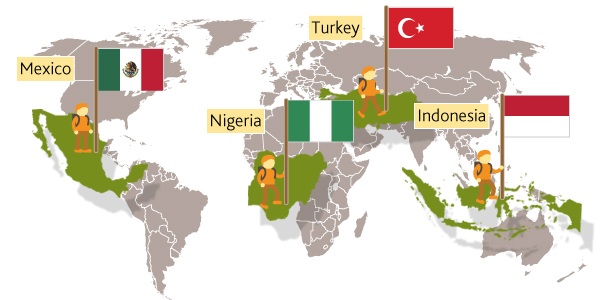
The four MINT countries

The four MINT countries

Jim O’Neill has recently popularized another contribution to the terminology of countries believed to be emerging market giants: MINTs. The term was originally coined by Fidelity Investments. The four members of this exclusive grouping are:

  • Indonesia
  • Mexico
  • Nigeria
  • Turkey

In proposing the new grouping, O’Neill makes a compelling case for Mexico’s future economic success. First, its large population ensures a viable domestic market. It also has a growing middle class and a steadily improving dependency ratio (the number of working age people compared to those not working). In addition, Mexico has a privileged position in world trade, linking North America to Asian markets. O’Neill believes that Mexico could experience double-digit rates of economic growth in the coming years, with GDP/person rising from its current figure of about 11,000 dollars to 48,000 dollars by 2050.

Related posts:

Remittances fell 3.75% in 2013 but look set to rise in 2014

 Mexico's geography in the Press  Comments Off on Remittances fell 3.75% in 2013 but look set to rise in 2014
Feb 062014
 

Figures from Mexico’s central bank (Banco de México) show that the value of remittances sent home by Mexicans working in the USA fell 3.75% in 2013, compared to the previous year.

Annual remittance totals in billions of dollars:

  • 2013 – 21.596
  • 2012 – 22.438
  • 2011 – 22.802
  • 2010 – 21.303

Trends in remittance payments are closely linked to trends in the US economy, so the slight fall in the past two years is no great surprise, as the US economy struggles to regain growth following the 2008 financial crisis.

There are some positive signs. Despite the decline over the year as a whole, the month of December saw remittances entering Mexico of 1.8 billion dollars, higher than any December since 2007.

In the last quarter of 2013, remittance payments were 3.46% higher than for the same period in 2012 (mainly due to a higher number of remittance payments), suggesting that remittance payments may now be on the rise again. The average amount remitted during the last quarter of 2013 was 285.34 dollars, 3.8% less than the average for the equivalent period in 2012.

Note: These remittance figures quantify only remittances sent via “formal” channels such as banks, and do not include informal payments carried directly back to Mexico by family or friends.

Related posts:

Mexico’s Pemex is one of the most competitive oil firms in the world

 Updates to Geo-Mexico  Comments Off on Mexico’s Pemex is one of the most competitive oil firms in the world
Dec 022013
 

Despite the criticisms regularly leveled at it, Mexico’s oil giant Pemex is actually one of the most competitive oil firms in the world.

First, its costs of exploration and production are much lower than those of most other major oil companies. Pemex’s production costs in 2012 averaged 6.84 dollars/barrel (d/b) of oil equivalent, well below the costs incurred by international rivals Exxon (9.91 d/b), Chevron (15.16), Total (8.17), Shell (12.47) and British Petroleum (12.50).

pemexPemex’s exploration and development costs are also among the world’s lowest. They fell from 16.13 d/b in 2011 to 13.77 d/b in 2012, mainly due to the discovery of several new reserves. Among major players, only Shell had lower costs (11.75 d/b), with Pemex well ahead of British Petroleum (17.37 d/b), Exxon (19.31), Total (22.68) and Chevron (28.81).

Thirdly, as new fields are fully explored, Mexico’s proven oil reserves are expected to continue to rise for a number of years, from the current level of 13.87 billion barrels to 14.92 billion barrels by 2018. (During this period, Pemex will extract an estimated 6.64 billion barrels, but they will be more than replaced by anticipated new discoveries)

How important is Pemex to the Mexican economy?

One third of Mexico’s national budget comes from the petro industry, which accounted for 7.6% of GDP in 2012.

In 2012, Pemex invested 23.9 billion dollars in Mexico, appreciably more than the 19.2 billion dollars invested that year by América Móvil, Femsa, Walmart, Frisco, Cemex, Liverpool, Alfa and Mexichem, combined.

In terms of revenues, Pemex had revenues in 2012 of 142.4 billion dollars, greater than the 139.1 billion dollars in revenues of América Móvil, WalMart, Femsa, Alfa and Cemex combined.

According to a Bloomberg analysis, between 1973 and 2012, Pemex generated a cash flow (before tax and depreciation) that was 63% higher than the total cash flow of all the firms listed on the Mexican Stock Market. In 2012, the Ebitda (Earnings before Interest, Tax, Depreciation and Amortization) of Pemex was 88.2 billion dolalrs, compared to the combined 54.2 billion dolalrs of Ebitda for América Móvil, Banorte, Femsa, Walmart de México, Grupo Modelo, Cemex, Kof, Televisa, Peñoles and Alfa.

How important is Pemex in the worldwide picture?

According to Petroleum Intelligence Weekly, U.S. Energy Information Administration and U.S. Crude Oil Imports by Country, Pemex is one of the world’s five most important crude oil producers, after Aramco (Sauid Arabia), NIOC (Iran), CNPC (China) and KPC (Kuwait).

Pemex is the third largest oil exporter to the USA, after Canada and Saudi Arabia, but ahead of Venezuela and Nigeria.

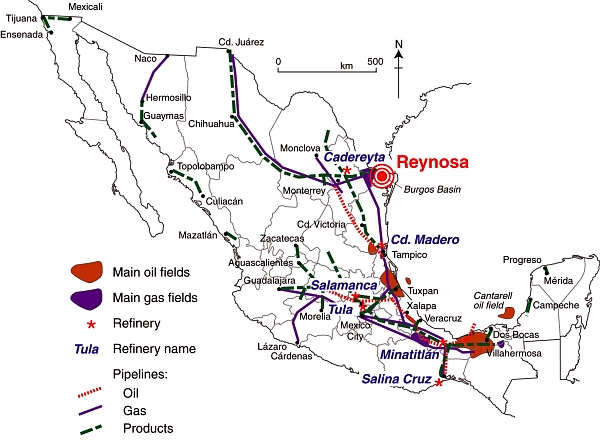
Pemex installations in Mexico. (Adapted from Fig 15.5 of Geo-Mexico). All rights reserved.

Pemex installations in Mexico. (Adapted from Fig 15.5 of Geo-Mexico). All rights reserved.

Mexico has the world’s 13th largest crude oil reserves and Pemex has the world’s 15th highest oil company revenues.

Mexico’s proposed energy reforms, which will allow private sector firms more access to some parts of the oil and gas sector, will only serve to boost the competitiveness of Mexico’s oil industry. The major problems facing Pemex are not directly related to revenues or to competitiveness, but are the persistence of corruption and a lack of transparency.

Related posts:


How does Mexico’s unemployment rate compare to that of other countries?

 Other  Comments Off on How does Mexico’s unemployment rate compare to that of other countries?
Nov 212013
 

In a recent post, we looked at The pattern of unemployment in Mexico in 2013 and saw how states in northern Mexico have significantly higher unemployment rates than most of southern Mexico. In this post we consider international comparisons. How does the rate of unemployment in Mexico compare to the rates in other countries?

The OECD (Organisation for Economic Co-operation and Development) publishes harmonised unemployment rates for its 31 member countries. The OECD calculates Mexico’s harmonised unemployment rate for the third quarter of 2013 at 4.9%. This is quite encouraging, since the average for OECD countries is 7.9%. (Note that these figures do not include “underemployment”.) Mexico’s unemployment rate is more favorable than that of its NAFTA partners, Canada (currently 7.1%) and the USA (7.6%).

The OECD members with the highest unemployment rates are Greece (27.4%), Spain (26.6%),, Portugal (16.4%), the Slovak Republic (14.0%) and Ireland (13.8%).

Among OECD members, only South Korea (3.1%)  Japan (4.0%) and Austria (4.1%) have a lower harmonised unemployment rate than Mexico.


The pattern of unemployment in Mexico in 2013

 Updates to Geo-Mexico  Comments Off on The pattern of unemployment in Mexico in 2013
Nov 182013
 

The accuracy of Mexico’s unemployment statistics is frequently questioned in the media but INEGI, Mexico’s National Geography, Statistics and Information Institute, uses internationally accepted methods to compute various different unemployment indices. As in most countries, INEGI surveys are based on samples in urban areas, involving 80,000 interviews in more than 30 towns and cities.

The International Labour Organization defines “unemployed workers” as those members of the workforce currently not working but willing and able to work, who have actively sought work in the past four weeks. Note that the mere act of looking at newspaper or online ads is not considered sufficient evidence of “actively seeking work”.

Mexico’s economically active population in the third quarter of 2013 was 52.3 million people, a very slight (0.01%) increase on the comparable figure for 2012.  The figure represents 59% of the total population aged 14 and over.

INEGI statistics show that the under-employed population was 8.5% of all those with jobs. The unemployed population was 2.7 million, 5.2% of the workforce.

Mexico’s workforce is not gender-independent. 77 out of every 100 men are economically active, compared to only 43 of every 100 women. The workforce can be subdivided between primary occupations (6.8 million, 13.8% of the total workforce); secondary occupations (11.9 million, 24%) and the tertiary or services sector (30.6 million, 61.6% of  workforce), with the remaining 0.6% undeclared.

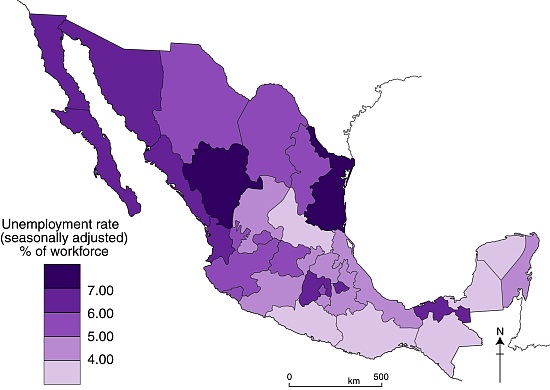
Map of unemployment rates

Unemployment in Mexico, third quarter of 2013. Cartography: Tony Burton; all rights reserved

Out-migration from several southern and western states has significantly reduced unemployment. Several southern states are among those with the lowest unemployment rates in the entire country.

The highest rates of unemployment are mainly in northern Mexico, parts of which have seen on-going violence in the war against drugs. Workers flocked to these areas during the boom times of Mexico’s maquiladora program when firms were encouraged to set up “in-bond” factories in these states, enjoying the freedom to import components and export finished products. However, the slow recovery of the US economy has reduced demand for consumer products and many maquiladora factories have reduced their workforce, leading to intense competition for available jobs and a higher rate of unemployment.

What other factors influence unemployment and help explain the patterns shown by the map?

This post describes the spatial pattern of unemployment in the third quarter of 2013. By way of comparison with 2010, see

Mexico’s economy and workforce are analyzed in chapters 14 to 20 of Geo-Mexico: the geography and dynamics of modern Mexico. Ask your library to buy a copy of this handy reference guide to all aspects of Mexico’s geography today! Better yet, order your own copy…

Several major Mexican companies among the “Global Challengers”

 Updates to Geo-Mexico  Comments Off on Several major Mexican companies among the “Global Challengers”
Apr 192013
 

The Boston Consulting Group (BCG) periodically identifies 100 companies from rapidly developing economies as “global challengers.” (Bcgperspectives, “Introducing the 2013 BCG Global Challengers“).

BCG has identified 100 companies for this list in 2006, 2008, 2009, 2011 and 2013. They focus on companies in developing Asia (excluding Japan, South Korea, Taiwan, Hong Kong and Singapore), Eastern Europe, the Commonwealth of Independent States, the Middle East, Latin America, and Africa. Companies considered for the list must have annual revenues of at least $1 billion, overseas revenues at least 10% of total revenues or $500 million, and be focused on building a truly global footprint.

The biggest emerging economies have dominated. In 2006 the list included 44 Chinese companies, 21 Indian companies and 12 from Brazil. Russia was next with seven followed by Mexico with six. The dominance of the big three declined from 77 in 2006 to 63 in 2013. One reason for this is that some of the countries on the list “graduated” from the challengers list to become full global competitors.

In 2013, China led with 30 companies, followed by India with 20 and Brazil with 13. Mexico was 4th with seven companies, followed by Russia with six, South Africa with five, Thailand with four and Turkey with three. Countries with two companies on the list are Chile, Malaysia, and Saudi Arabia. Those with one company on the list are Argentina, Colombia, Egypt, Qatar and United Arab Emirates.

The seven Mexican companies in the group are Alfa, American Movil, FEMSA, Gruma, Grupo Bimbo, Mabe, and Mexichem. One Mexican company, Cemex, has “graduated” from the “challengers” list. It is the world’s largest building materials supplier and 3rd largest cement maker. Cemex now operates in 50 countries on six continents and is the leading cement seller in the USA. Revenues in 2012 were $15 billion.

ALFA is the world’s leading manufacturer of high-tech aluminum engine heads and blocks through its subsidiary Nemak. Its other major subsidiaries are Alpek (petrochemicals), Sigma Alimntos (foods) and Alestra (electronics and telecommunications). Revenues in 2012 were $15 billion.

América Móvil. operates Telmex and Telcel, the world’s fourth largest cell phone operator with 160,000 employees and over 250 million subscribers mostly in Latin America and the USA. Its revenues in 2012 were $59 billion. It is a candidate to graduate from this “challengers” group in the near future.

Gruma is the world’s largest producer of corn flour and tortillas. It has subsidiaries in the USA, China, UK, and Latin America. Revenues in 2012 were $5 billion.

FEMSA, based in Monterrey, is the world’s largest bottler of Coca-Cola. FEMSA also operates OXXO, the largest convenience store chain in Latin America. Revenues in 2012 were $18 billion.

Grupo Bimbo is the world’s largest bread maker and the biggest bread seller in the USA. Among its 100 brands are Arnold’s, Entenmann’s, Thomas’s English Muffins, and Sara Lee fresh baked products. Bimbo is the world’s 4th largest food company behind only Nestle, Kraft, and Unilever. Revenues in 2012 were $13 billion.

Mabe. is a leader in the production of large household appliances such as stoves, refrigerators, washers, dryers, etc. These are sold in 70 countries under the General Electric and Mabe brand names. It controls 70% of the market in Latin America. Revenues in 2012 were $4 billion.

Mexichem is a chemical company that operates throughout the Americas as well as in Europe and Asia. It exports to more than 50 countries, has over 10,000 employees, and earns over $4 billion annually.

Related posts

Mexico seen as the “Flavor of the Month” among Latin American Economies

 Mexico's geography in the Press  Comments Off on Mexico seen as the “Flavor of the Month” among Latin American Economies
Apr 062013
 

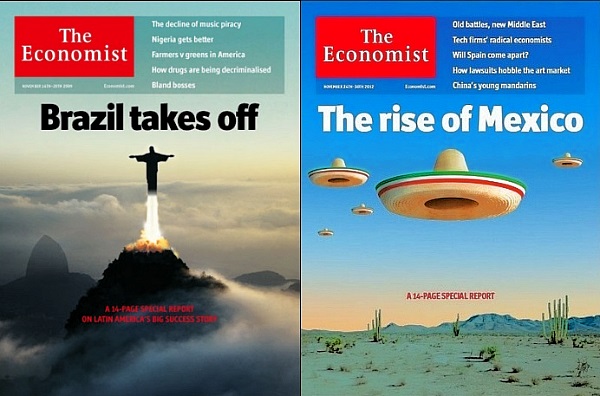
In a presentation entitled “Mexico’s Outlook” in Ajijic, Jalisco, Mexico, on 20 March 2013, noted Mexican political economist Leo Zuckermann explained how many economists see Mexico as the “flavor of the month” among Latin American economies.  Brazil previously was the star of Latin America as evidenced by the 14-20 November 2009 cover of  The Economist. However, Brazil’s performance slowed considerably in 2012; its GDP grew by only 1.0% and the dollar value of its stock market actually declined by 0.5% in 2012. (The Economist, 19 January 2013, p 93)

Economist covers

Mexico is the new star according to The Economist 14-page Special Report on Mexico in its 24-30 November 2012 edition. Mexico’s GDP grew by 4.0% in 2012, faster than the US, Canada and all European economies, though it did trail China (7.7%), India (5.4%), Indonesia (6.3%) and Thailand (5.8%). In dollar terms its stock market shot up an impressive 33.6% in 2012, tied with Germany and faster than all other sizable countries, except Turkey (75.8%), Thailand (45.9%) and Egypt (43.9%). (The Economist, 19 January 2013, pp 92, 93).

Mexico is expected to grow by 3.5% in 2013. However, it should be noted that after appearing on The Economist cover in November 2009, Brazil’s GDP declined steadily from over 8% to only 1%. We hope that Mexico can avoid this Economist cover jinx.

Mexico’s recent growth and positive outlook is largely dependent on continued expansion of exports, particularly the sale of automobiles and electronics to the USA. In 2013, Mexico is expected to surpass Japan as the leading exporter of light vehicles into the USA.

Though Mexican industrial export numbers are impressive, many of the components of these exports are initially imported. For example, the foreign content of Mexico’s electronic exports is 61%, compared to about 40% for China, 45% for Korea and only 11% for the USA.

Much of Mexico’s export capacity results from foreign direct investment in Mexico. However, such investment declined from nearly $30 billion a year in 2007 and 2008 to only $12.7 billion in 2012 (The Economist, 19 January 2013, pp 92, 93). This could limit export growth in future years. Furthermore Mexican direct investment abroad in 2012 was $25.5 billion almost twice the amount foreigners invested in Mexico. Prior to 2012 foreigners invested far more in Mexico than vice versa. This trend suggests that many Mexican investors see better opportunities abroad than in Mexico. Such investments are one reason for the rapid foreign expansion of some major Mexican multinational corporations such as Cemex, América Móvil, FEMSA and Bimbo. Another factor suggested by these numbers is that both foreign and Mexican investors do not see many attractive opportunities for domestic industries selling to the Mexican market. If Mexico is indeed now the “flavor of the month,” it remains to be seen if Mexico can retain its current popularity.

Related posts:

The world’s richest man is one of 15 Mexican billionaires on 2013 Forbes list

 Updates to Geo-Mexico  Comments Off on The world’s richest man is one of 15 Mexican billionaires on 2013 Forbes list
Mar 072013
 

The 2013 Forbes list of the world’s billionaires shows that the world’s 1,426 billionaires (an all-time high) share a record net worth of $5.4 trillion. The four countries with most billionaires are the USA (442), China (122), Russia (110) and Germany (58).

Fifteen Mexican individuals or families make the 2013 list, also a record number. The fifteen super-rich Mexicans are:

World rank / Name / Estimated wealth according to Forbes / Main business interests

#1 Carlos Slim Helú and family, $73.0 billion, making him the richest man in the world. Fixed line telephone provider Telmex, cell phone provider América Móvil, Grupo Carso, Inbursa. [Slim Helú remains the world’s richest man for the fourth consecutive year]

#32 Alberto Bailleres González and family, $18.2 billion. Mining giant Peñoles, department store El Palacio de Hierro and Grupo Profuturo.

#40 Germán Larrea Mota Velasco and family, $16.7 billion. Grupo México –mining for copper and other minerals, railways.

#111 Ricardo Salinas Pliego and family, $9.9 billion. Television company Televisón Azteca, domestic appliance store Elektra, bank Banco Azteca, and cell phone company Iusacell.

#179 Eva Gonda Rivera and family, $6.6 billion, soft drinks (FEMSA)

#248 Maria Asunción Aramburuzabala and family, $5 billion, beer (Grupo Modelo)

#329 Jerónimo Arango and family, 4 billion dollars. Founder of Aurrerá supermarket chain and Grupo Cifra which controlled VIPS and El Portón restaurant chains, Suburbia department stores and tourist developments in Baja California Peninsula and Acapulco

#589 Emilio Azcárraga, $2.5 billion. Television and media conglomerate Televisa, and Nextel cell phones

#613 Rufino Vigil González, $2.4 billion; steel (Industrias CH)

#641 José and Francisco Calderón Rojas (brothers), $2.3 billion, beverages (Coca-Cola Femsa)

#792 Carlos Hank Rhon and family, $1.9 billion, banking

#831 Roberto Hernández, $1.8 billion. Banker, one of main shareholders of Citigroup, and tourist developments in the Yucatán Peninsula

#974 Alfredo Harp Helú and family, $1.5 billion. Shareholder in Citibank, telecommunications firm Avantel

#1031 Max Michel Suberville, $1.4 billion, retail (Coca-Cola Femsa)

#1107 Juan Gallardo Thurlow, $1.3 billion, beverages (organización Cultiba)

Conspicuous by his absence from the list (for the first time in several years) is Joaquín Guzmán Loera (aka “El Chapo”) who Forbes has consistently claimed has a net worth of about $1 billion, but whose assets the magazine now declares “impossible to verify”. Guzmán Loera is Mexico’s most wanted man, head of the Sinaloa drugs cartel, the main supplier of cocaine to the US market.

The combined total wealth of these fifteen individuals is a staggering $148.5 billion (compared to an equivalent total of $125.1 billion in 2012). The 2013 figure is equivalent to more than 6% of Mexico’s GDP.

The average earnings of Mexican workers registered in IMSS (Mexico’s Social Security Institute) in 2012 was about 260 pesos ($20 dollars) a day. The combined wealth of Mexico’s fifteen richest individuals/families is therefore equivalent to the total annual salaries of more than 20 million Mexicans earning this average salary! Note that this equivalence has risen steadily over recent years. For example, in 2010 the combined wealth of Mexican billionaires was equivalent to “only” 14.3 million Mexicans earning the then average salary.

Clearly, there are a handful of extremely wealthy individuals living in Mexico, alongside millions of Mexicans who are living at or below the poverty line. These income disparities have existed for a very long time, and are examined in detail in chapter 14 of Geo-Mexico: the geography and dynamics of modern Mexico. That chapter also analyzes the spatial patterns of wealth in Mexico, and discusses whether the gap between rich and poor has widened or narrowed in recent years.

Chapter 29 discusses Gender inequities in Mexico and  Oportunidades, a poverty reduction program (links are to excerpts from that chapter).

Related articles:

Value of remittances entering Mexico declines in 2012

 Updates to Geo-Mexico  Comments Off on Value of remittances entering Mexico declines in 2012
Feb 042013
 

Mexico’s central bank has released figures showing that remittances entering Mexico in 2012 totalled $22.446 billion, 1.57% less than the $22.803 billion  recorded in 2011. [All figures in US dollars.]

The central bank registered 71.62 million remittance movements in 2012, 2.52% more than the year before. The average remittance fell by about 4% from $326 in 2011 to $313 in 2012.

The state receiving most remittances was Michoacán which accounted for $2.209 billion, almost 10% of the total.

Remittances are the second largest source of foreign exchange after oil and gas revenues and are a vital source of funding for millions of people.

Related posts:

The spatial distribution of Mexico’s GDP

 Other  Comments Off on The spatial distribution of Mexico’s GDP
Dec 062012
 

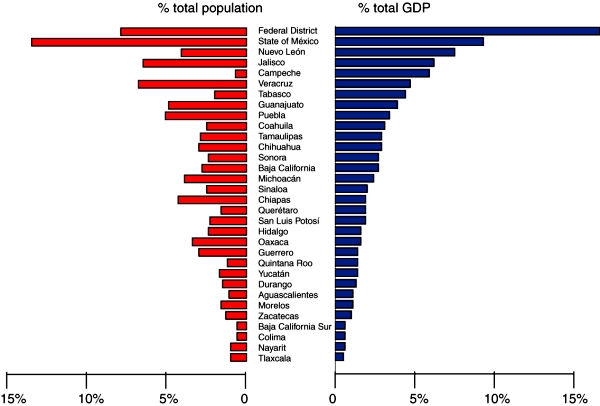
Mexico’s National Statistics Agency recently released a breakdown of GDP by state for 2011. The data allow for an analysis of the spatial distribution of Mexico’s GDP. The graph below shows each state’s contribution to GDP (blue bars) and their share of Mexico’s total population (red bars):

Population & GDP by state, 2011

Population & GDP by state, 2011. Data: INEGI. Credit: Tony Burton / Geo-Mexico; all rights reserved

In general, Mexico’s larger states (in terms of population) contribute more towards national GDP than its smaller states. Equally, even after population is taken into account, it is clear that some states contribute far more than others to Mexico’s GDP. The states of Campeche and  Tabasco both stand out as contributing far more than their fair share towards national GDP; this is on account of their oil and gas reserves. The Federal District, Nuevo León, Quintana Roo and Querétaro also outperform in terms of economic output. On the other hand, Michoacán, Chiapas, Oaxaca and Guerrero all stand out for contributing less to Mexico’s GDP than the size of their population would suggest.

The economic disparities revealed by the data are closely matched by other indicators of economic disparity such as differences in poverty rates and the distribution of the wealthiest households. For more about these topics, start with the related posts listed below.

Related posts:

Mexico’s beer industry loses its national identity

 Updates to Geo-Mexico  Comments Off on Mexico’s beer industry loses its national identity
Aug 112012
 

The beer industry in Mexico is dominated by two major players: Grupo Modelo and Cuauhtémoc-Moctezuma, the brewing division of Femsa  (Fomento Económico Mexicano).

In 2011, Mexico’s breweries produced 79 million hectoliters of beer, of which Grupo Modelo was responsible for 59%, and Cuauhtémoc-Moctezuma about 25%. Between 1991 and 2011, production had almost doubled, increasing by 92.6%. The record year was 2008, when 82 million hectoliters were produced.

The map shows the locations of the major breweries belonging to Grupo Modelo and Cuauhtémoc-Moctezuma (Femsa), as of mid-2012.

The location of Femsa and Modelo breweries in Mexico

The location and inauguration dates of Femsa and Modelo breweries in Mexico

Grupo Modelo produces 13 brands, including Corona, Modelo Especial, Negra Modelo, Pacífico, Victoria, Estrellita and León. Its international sales rose 4.7% in 2011 to about $2.8 billion. Its best selling brand abroad is Corona Extra, the leading Mexican beer in the USA, while its Modelo Especial brand is that country’s third most popular brand. Corona is the leading import brand in some 40 countries, including Australia and Canada. Grupo Modelo (2011 net sales $6.5 billion) has a presence in about 180 countries.

Cuauhtémoc-Moctezuma produces 21 brands, including Tecate, Carta Blanca, Superior, Sol, Indio, Bohemia, Dos Equis and Noche Buena. It sells to 50 countries. The division represents 23.5% of the total revenues of parent company Femsa (Fomento Económico Mexicano).

Several things have changed since our two previous major posts about beer:

First, beer consumption has been rising. The average consumption in 1994 was 49.6 liters/person/yr. This figure had risen to 61 liters by 2000 and to about 70 liters by 2008. Part of this increase is due to the fact that the average age of the Mexican population has been steadily rising for several decades. See, for example, Is Mexico experiencing a demographic dividend? A 2005 report from the national beer industry claimed that the average annual consumption of beer in Mexico was 50 liters per adult

The most significant changes in the beer industry are in ownership. In 2010, Dutch brewer Heineken bought 100% of the shares of Cuauhtémoc-Moctezuma, Mexico’s oldest brewer, created in 1890.

Now, it has been announced that Grupo Modelo, founded in 1925, is being bought by Belgian-US brewing company Anheuser-Busch InBev. Anheuser-Busch InBev previously held a non-controlling 50% in Modelo, and is buying the remaining 50% for $20.1 billion. This deal should be finalized in the first quarter of 2013. When completed, it means that virtually all of Mexico’s beer, bar a few small specialist breweries and microbrews, will be in the hands of European firms. Microbreweries include Pepe’s y Joe’s in Mazatlán; Cervecería San Ángel and Cervecería Santa Fe Beer Factory, both in Mexico City; and the Beer Lounge, in Guadalajara.

Both major beer-makers in foreign ownership? Another small but important part of Mexico’s national identity will have been lost…


Mexico’s position among the world’s largest economies: 1900 to 2008

 Other  Comments Off on Mexico’s position among the world’s largest economies: 1900 to 2008
Jul 072012
 

Comparing the historical sizes of national economies is extremely challenging. Fortunately, Gapminder has attempted to do this by compiling GDP data for all countries in the world for the period since 1800. (For details, see here and here.) Gapminder’s approach relies on first obtaining for each country historical population size and Gross Domestic Product per capita (GDPpc) and then multiplying these to obtain the GDP. Gapminder relies on quantitative and qualitative data from hundreds of official and unofficial documents and a number of carefully documented assumptions.

Mexico’s total GDP has grown almost 60-fold since 1900 in inflation-adjusted constant 2005 dollars based on Purchasing Power Parity, which measures total goods and services produced by an economy independent of exchange rates. Growth started rather slowly, but accelerated very rapidly at mid-century. From 1940 to 1980, Mexico’s economy almost doubled each decade, moving up from $49 billion in 1940 to $637 billion in 1980, averaging about 6.6% per year. Of course, Mexico’s population was also growing rapidly during those four decades. Growth slowed to 2.0% per year in the 1980s but jumped up to 3.4% in the 1990s. From 2000 to 2008, growth slowed to 2.1% per year, partially as a result of the severe recession in the USA. Mexico’s economy is expected to grow significantly faster in this decade.

Growth of major world economies, 1900 to 2008 (Gapminder data)

(GDP in billions of constant 2005 US dollars based on Purchasing Power Parity)

Country19001930195019802008Growth/yr, 1900-2008
Brazil10381069371,8584.9%
Canada23731485771,2113.8%
China3214972169178,8623.1%
France1672672971,0951,8752.3%
Germany2554064161,7342,7012.2%
Indianana2085732,951na
Indonesia2655562288373.3%
Italy721492109151,6142.9%
Japan771652222,1603,9853.7%
MEXICO2336946371,3343.8%
Russianana375na2,089na
South Korea712161651,1774.9%
UK2403514901,0252,0042.0%
USA5061,1562,4146,33912,9603.1%

In 1900, Mexico’s total GDP of $23.3 billion was just ahead of Canada and over twice that of Brazil. However it was behind Indonesia and less than 5% of the USA’s world leading GDP. The Mexican economy was less than one tenth that of Germany and the UK, a seventh that of France and less than a third that of Japan and Italy. The table shows GDP levels for some of the world’s largest economies from 1900 to 2008.

The Mexican GDP expanded by 1.5% per year from 1900 to 1930 despite stagnation during the Mexican Revolution of 1910 to 1920. While this growth rate was better than UK, and tied with China, it was slower than the other countries in the table which expanded rapidly at the start of the 20thcentury. Brazil spurted ahead at 4.4% per year, edging past Mexico as Latin America’s largest economy. Canada expanded by 3.9% per year and doubled Mexico’s GDP. The USA grew by 2.8% per year becoming the first trillion dollar economy by 1923. France and Germany grew at about 1.6% per year, while Japan, Indonesia and Italy expanded by about 2.5% to 2.6%.

From 1930 to 1950, Mexico grew rapidly to $94 billion at a very impressive 4.9% per year, faster than all the other countries except Brazil at 5.3% per year. The USA (up 3.8% per year) and Canada (up 3.6%) also expanded rapidly, while the UK, Italy and Japan grew much slower, in the 1.5% to 1.7% range. The other countries struggled at rates around 0.5% or less. China’s GDP declined by a mind-boggling 4.1% per year during the 20 years from $497 billion down to $216 billion, more than a third less than what it had been in 1820! China’s economy seriously contracted over a 130 year period. The Great Depression hurt most economies; however World War II allies Japan (up 5.8% per year) and Germany (up 3.9%) grew relatively rapidly during the 1930s.

The 1940s and World War II had very dramatic impacts on the major economies. During the decade, Mexico’s GDP led the field with very impressive growth at 6.7% per year, closely followed by Brazil at 6.2%, USA at 5.2% and Canada at 5.0%. Wartime production was a major stimulus to these economies. On the negative side, several countries experienced dramatic war-related loses. China was at war throughout the decade and its economy declined by an incredible 7.0% per year during the 1940s, Germany was down by 3.5%, Japan by 2.6%, South Korea by 2.7% and Indonesia by 2.5%. Compounding these annual changes demonstrates their real significance. Mexico’s GDP almost doubled from $49 billion in 1940 to $94 billion in 1950, while China’s GDP dropped more than half from $447 billion in 1940 to $216 billion in 1950. By 1950, Mexico’s GDP was nearly half that of China and Japan, 1.7 times that of Indonesia and over six times that of South Korea. These four Asian countries would grow very rapidly during the “Asian Miracle” of the second half of the 20th century.

Mexico continued its dramatic growth expanding by 6.6% per year from 1950 to 1980. This was the “Mexican Miracle” which actually started in the 1940s. By 1980, Mexico’s GDP reached $637 billion, surpassing Canada and India; it was above one tenth of the USA’s GDP for the first time in over 100 years. All other economies also grew very rapidly during this thirty year boom period. Japan led the way with 7.9% per year, followed by Brazil at 7.5% per year. China finally broke from its 130 year slump growing at 4.9% per year; in 1956 it finally regained the GDP level it had in 1820. In 1980 Mexico’s GDP was about 70% that of China compared to only 7% in 1930 and 2% in 1820.

From 1980 to 2008, Mexico’s growth slowed a bit but still managed a very respectable increase of 2.7% per year which doubled its GDP from $637 billion to $1.334 trillion. This growth rate was better than that of Japan and all other large western economies (tied with Canada). But it significantly lagged behind four large Asian economies: China (up 8.4% per year), India (up 6.0%), South Korea (up 7.3%) and Indonesia (up 4.8%). China’s GDP increased almost ten-fold from 1980 to 2008. In 1980 India’s GDP was less than that of Mexico, but by 2008 it was over twice as large. Mexico’s GDP in 2008 of $1.3 trillion puts it in 11thplace, behind Italy and just ahead of Spain, Canada and South Korea.

Reviewing the entire 108-year period from 1900 to 2008 reveals the dramatically changes that can occur. Some Asian countries, especially China, really struggled for decades early in the century and then expanded extremely rapidly in recent decades. Compared to the other countries, Mexico did extremely well increasing at an average of 3.8% per year from $23 billion in 1900 to $1.3 trillion in 2008, a 57-fold increase. Brazil and Korea did considerably better, averaging 4.9% per year for 180-fold increases. Even the slowest growth country, the UK, grew by a respectable 2.0% per year for over an eight-fold increase since 1900. All major economies did well making the 20thcentury clearly the best century by far in terms of economic growth. The total GDP of 12 countries (Brazil, Canada, China, France, Germany, Indonesia, Italy, Japan, Mexico, South Korea, UK and USA)in the table with available data grew by 2.0% per year from 1900 to 1950 compared to a very impressive 3.8% per year from 1950 to 2008. The second half of the century was much better than the first; this indicates that economic growth is accelerating and accelerating fast. Will this continue in the decades ahead?


Mexico’s GDP and position among the world’s largest economies, 1800 to 1900

 Other  Comments Off on Mexico’s GDP and position among the world’s largest economies, 1800 to 1900
Jun 302012
 

Comparing the historical sizes of national economies is extremely challenging. This post relies on data from Gapminder which has attempted to do this for all the countries in the world for the period since 1800. Gapminder’s approach relies on first obtaining for each country historical population size and Gross Domestic Product per capita (GDPpc; for more details, see Standard of living in Mexico since 1800: some international comparisons) and then multiplying these to obtain the GDP. To obtain historical measures of population and GDPpc, Gapminder relies on quantitative and qualitative data from hundreds of official and unofficial documents and a number of carefully documented assumptions. In some cases they admit that some of their numbers for years before 1900 are essentially well-educated “guesstimates”. [Full details are given in the pdf file “Documentation for GDP per capita by purchasing power parities“.]

Though the Gapminder data have limitations, they are about the best source for comparing the GDP growth of Mexico since 1800 with that of other large economies. The Gapminder GDPpc data are adjusted for inflation by using constant 2005 US dollars. They are also based on Purchasing Power Parity (PPP) which measures total goods and services produced by an economy independent of exchange rates.

During the 19th century Mexico’s total GDP grew at a relatively unimpressive 1.3% per year, which was only about 0.5% above population growth. In 1800, Mexico’s estimated GDP was just over $6 billion, ranking it second in the Americas. Though this was almost nine times the GDP of Canada, and 3.6 times that of Brazil, it was less than that of Nigeria and half that of the USA. China had by far the largest GDP in 1800 at about $290 billion, more than three times the GDP of second place India, over seven times that of Japan and the large European countries (France, Germany and the UK) and over 20 times that of the USA. The table below shows the estimated GDP levels from 1800 to 1900 for some of the world’s current largest economies.

Estimated total GDP of large economies, 1800 to 1900

(GDP in billions of constant 2005 US dollars based on Purchasing Power Parity)

Country1800182018701900Growth/yr, 1800-1900
Brazil1.72.47.010.31.8%
Canada0.71.19.323.13.6%
China286.9328.8279.1320.90.1%
France38.447.1113.5167.31.5%
Germany36.048.5113.2254.72.0%
India91.098.2118.8nana
Indonesia8.39.316.026.31.2%
Italy23.629.344.671.61.1%
Japan31.133.639.676.60.9%
MEXICO6.17.39.123.31.3%
Russia25.626.2nanana
UK34.945.4151.3240.12.0%
USA12.720.1261.3506.03.8%

From 1800 to 1820, just before gaining independence, the Mexican economy grew to $7.3 billion at a sluggish rate of about 0.9% per year. In contrast, Canada and the USA expanded at around 2.3% per year while Brazil’s GDP went up about 1.9% per year. Germany, France, UK and Italy grew at roughly 1.0% to 1.5% per year. The major Asian countries–China, India, Japan and Indonesia–only managed 0.4% to 0.7% per year. The Russian economy essentially stagnated during the 20 year period. China maintained the top position with over three times the GDP of India and over six times those of the large European economies.

By 1870, Mexico’s GDP had inched up over $9 billion growing rather slowly at just over 0.4% per year since 1820; this was slower than the population growth rate. While Mexico’s growth rate was better than the three biggest Asian economies, it severely lagged behind its northern neighbors which grew very rapidly based on industrialization and immigration. Canada’s economy expanded by an impressive 4.4% per year and edged past Mexico. The USA did almost as well at 4.2% per year to move into second place behind China, which declined by a surprising 0.3% per year over the fifty year period. (In China both GDPpc and population declined from 1820 to 1870.)

Brazil grew by a solid 2.1% per year and closed the gap with Mexico. The three largest European economies were also industrializing and grew by roughly 1.7% to 2.0% per year, but they were still overtaken by the USA. While Indonesia’s GDP expanded by about 1.1% per year, growth rates for Japan and India were less than 0.4% per year.

From 1870 to 1900, under the Porifiro Diaz regime, Mexico’s economy grew rapidly at about 3.2% per year up to $23.3 billion. This put Mexico just ahead of Canada which grew slightly more slowly at roughly 3.1% per year. Mexico’s estimated GDP in 1900 was just behind that of Indonesia but over twice that of Brazil which slowed to 1.3% per year. The USA sped ahead at 3.9%. In the early 1880s it became the world’s largest economy by overtaking China which grew slowly at less than 0.5% per year. In 1900 China’s estimated GDP was actually less than it had been 80 years earlier in 1820. By 1900 the USA’s estimated GDP was over $500 billion, about 22 times that of Mexico. Germany grew at an impressive 2.7% per year becoming Europe’s largest economy by moving past the UK which grew at 2.2%, about the same rate as Japan. Growth in France and Italy was significantly slower.

During the full 19th century, Mexico almost quadrupled its GDP but its overall economic performance was fair at best. Its growth rate of just over 1.3% per year was better than the Asian countries which performed poorly during the century. The USA registered a very impressive 3.8% growth per year resulting in a fortyfold GDP increase. Canada was a close second with 3.6% per year and a 34-fold increase. Germany and the UK had seven-fold increases with growth rates near 2.0%, followed by Brazil at 1.8% growth per year. France followed with growth averaging just under1.5% per year. Though these Gapminder GDP levels have some limitations, they do give a pretty good indication of relative historical economic sizes and growth rates.

Mexico’s economic performance was much better in the 20thcentury as was that of all major world countries. A future post will focus on economic growth since 1900.


Standard of living in Mexico since 1800: some international comparisons

 Other  Comments Off on Standard of living in Mexico since 1800: some international comparisons
Jun 232012
 

Comparing historical standards of living for different countries over long periods of time is extremely challenging. This post relies on data from Gapminder which has attempted to do this for all countries in the world since 1800. Their approach relies on quantitative and qualitative data from hundreds of references and a number of carefully documented assumptions. They obtained input from a very wide range of official and unofficial documents and combined these to come up with their best estimates. In some cases they admit that some of their numbers for years before 1950 are essentially well-educated “guesstimates”. [For more details, see “Documentation for GDP per capita by purchasing power parities” (pdf file).]

Though the Gapminder data have some limitations, they are about the best source for comparing standards of living in Mexico since 1800 with a number of other middle income countries. The measure of standard of living used in this post is the Gapminder indicator of Gross Domestic Product per capita (GDPpc) at constant 2005 US dollars based on Purchasing Power Parity (PPP) which measures total goods and services produced by an economy independent of exchange rates.

The data indicate that Mexico’s GDPpc has grown over eleven-fold since 1800 from over $1,000 to almost $12,000. This increase sounds very impressive but actually represents an average annual increase of under 1.2% per year. The eleven-fold increase demonstrates the power of compounding. The growth has not been constant. During the 19thcentury Mexico’s GDPpc actually decreased slightly up until 1870, but then expanded relatively rapidly under the Porfirio Diaz regime, almost doubling between 1870 and 1900. For the century as a whole it increased an average of about 0.5% per year. The rate of increase more than doubled during the first half of the 20th century to 1.2%. It doubled again to 2.5% during the second half of the 20th century, which included the so-called “Mexican Miracle”, which started in the 1940s. After 2000, as a result of the very severe recession in the USA, Mexico’s growth slowed to 0.6% per year for the period 2000-2011. Growth is expected to increase significantly during the present decade.

Income growth in Mexico since 1800 (Gapminder data) 

(Incomes values are at constant 2005 US dollars based on Purchasing Power Parity)

Country18001900195020002011Growth/yr, 1800-2011
Argentina8724,0116,32310,77114,5951.3%
Brazil5095981,9047,81910,1921.4%
Chile7022,3063,61210,10613,6111.4%
China9868024272,7847,9311.0%
Cuba1,124na4,9585,8249,4691.0%
India5635855881,6072,9720.8%
Indonesia5146046662,6273,9991.0%
Iran7501,3472,8168,26011,6661.3%
South Korea59667070815,69225,2561.8%
MEXICO1,0541,7223,07410,35911,7541.2%
Peru6979963,2895,7058,4201.2%
Russia824nana7,79214,3181.4%
South Africa759na4,7667,3349,2841.2%

The table compares the 1800 to 2011 GDPpc of Mexico with 12 other middle and low income countries. In 1800, Mexico was ahead of all other countries in the table except Cuba. By 1900, Argentina had moved past and its GDPpc was more than double that of Mexico. Argentina’s GDPpc growth rate for the 19thcentury was over three times that of Mexico. Chile also moved ahead of Mexico. On the other hand, Brazil grew very slowly at only about 0.2% per year during the century; it actually declined between 1870 and 2000. By 1900, its GDPpc was about equal to that of India and a third that of Mexico.

In 1800, China’s GDPpc trailed Mexico by only about 6.5%; but declined by about 0.2% per year during the 19thcentury when China’s economy seriously stagnated as a result of opium wars and numerous internal rebellions which took from 20 to 40 million lives. By 1900, China’s GDPpc was less than half that of Mexico. India, South Korea and Indonesia also grew very slowly during the century. Their GDPpcs went from about half that of Mexico to about a third. There was no Asian economic miracle during the 19th century.

By 1950, Mexico trailed Argentina, Chile, Peru, Cuba and South Africa. From 1900 to 1950, the GDPpc of Mexico grew by a respectable 1.2% per year; however Peru and Brazil grew twice as fast. At the other end, the Asian countries did rather poorly. For example, China’s GDPpc declined by an amazing 1.2% per year from 1900 to 1950, when the country suffered from competing warlords, a protracted civil war, and Japanese invasion. By 1950, China’s GDPpc was less than half of what it had been in 1800 and also was behind India and less than a seventh that of Mexico. From 1900 to 1950, India’s GDPpc grew by only 0.01% per year while Indonesia and South Korea did only marginally better. The mid 20thcentury wars were very damaging to the Asian economies.

By 2000, Mexico had almost caught up with Argentina and had surpassed Chile, Peru, Cuba and South Africa. While Mexico’s growth from 1950 to 2000 of about 2.5% per year was very impressive, Brazil grew even faster at 2.9% per year. South Korea’s GDPpc surged ahead by an amazing 6.4% per year during the second half of the 20th century; it increased over twenty-fold from about $700 to over $15,000. China also grew at a very impressive 3.8% per year posting over a six fold increase. These two countries recovered briskly after their numerous wars and kept moving ahead at a rapid clip.

During the years between 2000 and 2011, Mexico had the worst performance of the countries in the table, growing at only 1.6% per year. China grew over eight times faster than Mexico; India and Russia grew almost five times faster. The growth rates of the other Latin American countries in the table – Argentina, Brazil, Chile, Cuba and Peru – were over twice that of Mexico. However, the Mexican economy is closely tied to the USA where GDPpc grew less than half as fast as Mexico. As mentioned previously, Mexico is expected to grow briskly during the rest of this decade.

It is interesting to look over the full 211 year period from 1800 to 2011. Interestingly throughout the whole period the GDPpc of Iran slightly trailed that of Mexico. The gap between these two countries closed a bit during the 211 year period. As a result of its rapid surge in recent decades, South Korea grew the fastest at 1.8% per year; it moved from one of the poorest in 1800 to the richest in the table. Other solid growth rates were posted by Argentina, Brazil, Chile, Iran and Russia. The slowest growth occurred in India, at only 0.8% per year, followed by Indonesia and China at slightly less than 1.0% per year. However, these Asian countries are now growing considerably faster than the other countries in the table. Looking at income growth over the last two hundred years puts the current situation in perspective. It is interesting to speculate on what the next two hundred years will bring, something we will return to in future posts.

Related posts:
Jun 042012
 

A previous post—How “complex” is the Mexican economy?—discussed The Atlas of Economic Complexity and noted that Mexico’s Economic Complexity Index (ECI) of 1.145 ranked it 20th among 128 countries. ECI indicates a wide range of complex knowledge capabilities related to productive enterprises. Mexico has a very high ECI given its income level; all other countries in the top 20 have significantly higher incomes than Mexico.

According to the Atlas, during the rest of the decade Mexico’s GDP should grow relatively rapidly to catch up with its ECI. Analyses in the Atlas indicate that during the last few decades countries with higher than expected ECIs compared to their income levels experience more rapid economic growth. While this relationship is empirically true, it should be noted that it does not explicitly include other factors thought to be important to economic growth (see Section 4 of the Atlas). Some of these other factors are governance and institutional quality, corruption, political stability, measures of human capital and competitiveness indicators. The Atlas implies that these other factors contribute to and thus are indirectly part of the Economic Complexity Index.

The analysis in the Atlas predicts that Mexico’s annual growth in real per capita GDP will be 3.5% from 2009 to 2020, ranking it 10th in the world in growth rate (see table). (The growth rates for some other countries are given in footnote 1 below.)  Mexico’s annual growth in real per capita GDP is impressive given that its growth was only 0.8% per year for 1999 to 2009, the same as that for the USA. Growth in these two countries was slowed significantly during this period as a result of the very severe recession, the worst since the great depression. This rather slow growth is surprising given that Mexico’s ECI increased from 1998 to 2008 was ranked 30th worldwide. Though the Mexican economy suffered significantly during this period, it continued to develop new productive capabilities and become more complex. This added complexity is expected to generate accelerated economic growth in the current decade.

RankCountry% growth in GDP/person, 1999-2009Expected % growth in GDP/person, 2009-2020, Income/person, 2009Expected income/person, 2020
1China9.64.33,7445,962
2India5.64.31,1921,886
3Thailand3.14.03,8936,023
4Belarus7.94.05,0757,806
5Moldova4.84.01,5162,321
6Zimbabwe449.03.8 - 6.2676?
7Ukraine5.23.72,4683,694
8Bosnia-Herzegovina4.13.64,5256,669
9Panama3.93.67,15510,529
10MEXICO0.83.58,14311,894

The low growth rate of 0.8% per year for 1999 to 2009 represents “real” per capita growth corrected for inflation and population growth. In nominal terms, Mexico’s total GDP growth from 1998 to 2008 was 1.8% per year. It is expected to grow 4.8% per year for 2009 to 2020, which ranks its 22nd in the world, behind numerous poor African countries with rapidly growing populations. Of large or populous world countries, the only ones ranked ahead of Mexico are India (ranked 8th), the Philippines (12th), Egypt (14th), Pakistan (18th) and China (20th).

In summary, the Atlas of Economic Complexity predicts that the Mexican economy will grow very rapidly during the rest of this decade and beyond. Let’s hope that this prediction becomes a reality.

Footnote 1:

For comparison: Indonesia ranked 21st at 3.3%, Pakistan 27th at 3.1%, Guatemala 35th at 3.0%, South Africa 41st at 2.9%, Turkey 43rd at 2.8%, Brazil 48th at 2.7%, Argentina 54th at 2.6%, Russia 59th at 2.6%, USA 91st at 2.0%, Canada 104th at 1.7% and Nigeria 118th at 1.1%.

Source:

Ricardo Hausmann, Cesar Hidalgo, et. al. “The Atlas of Economic Complexity“, The Observatory of Economic Complexity (Harvard HKS/CDI – MIT Media Lab). Retrieved 19 May 2012.

May 282012
 

In his classic book, The Wealth of Nations, Adam Smith proposed that division of labor and economic specialization were the keys to increases in productivity and the wealth of nations. While Smith was primarily talking about the degree of specialization within nations, specialization among nations and comparative advantage were also important. Obviously, in the 21st century there is specialization within and among all nations, but some are more specialized or more complex than others. But how can economic complexity be measured?

Fortunately this question is addressed head-on by Ricardo Hausmann, Cesar Hidalgo and their co-researchers in The Atlas of Economic Complexity (Harvard HKS/CDI – MIT Media Lab, 2011). They argue that highly complex economies produce sophisticated products that require a very wide and diverse set of knowledge capabilities. Very few countries have the capabilities to produce such sophisticated products which might include the very specialized equipment and very precise measuring instruments needed to produce highly complex chemicals or pharmaceuticals. Other examples might include the range of knowledge capabilities needed to build a nuclear power plant or space station. Obviously very few nations with very complex economies have these capabilities.

At the other end, a very large number of countries with less complex economies have the range of capabilities needed to produce simple products like basic foods, mineral ores, lumber, garments, shoes, glass, kitchen utensils, candles and furniture.

In producing an atlas that covered a large number of countries, the authors were limited by the availability of data. They decided to use information on exports because the data were available and the range of exports reveal the complexity of an economy. Unfortunately, accurate data are only available on the trade of physical products; they are not available for services which are the dominant sector for modern economies. On the other hand, the sophistication of product exports does a good job of capturing the complexity of economies.

In developing their Economic Complexity Index or ECI, the authors developed a product complexity index based on the number of countries capable of making and exporting specific products as well as the diversity of products exported by specific countries. The Atlas presents ECIs for the 128 countries that had reliable data, populations over 1.2 million and trade over $1 billion.

RankCountryEconomic Complexity IndexIncome/person (2009 US$)
1Japan2.31639,738
2Germany1.98540,670
3Switzerland1.93563,629
4Sweden1.85943,654
5Austria1.80745,562
6Finland1.71544,581
7Singapore1.63936,537
8Czech Republic1.62818,139
9U.K.1.55835,165
10Slovenia1.52323,726
11France1.47341,051
12South Korea1.46917,078
13USA1.44745,989
14Hungary1.43012,868
15Slovak Republic1.37916,176
16Italy1.30835,084
17Denmark1.26755,992
18Ireland1.23151,049
19Israel1.16426,256
20MEXICO1.1458,143

The 20 countries with the highest Economic Complexity Indices are presented in the table, along with their 2009 per capita income. Japan is clearly the most complex economy followed by Germany, Switzerland, Sweden and Austria. The USA is ranked 13th and Canada is 41st. Fourteen of the top 20 countries are European; most are high income, highly industrialized countries. Countries with large natural resource exports tend to rank low in economic complexity. Norway is 33rd, Russia 46th, New Zealand 48th, Brazil 52nd, Saudi Arabia 68th, Australia 79th.

Mexico is ranked 20th which is very impressive since all others in the top 20 have significantly higher incomes. Mexico does very well compared to other large emerging economies: China is 29th; Turkey is 43rd, Russia is 46th, India is 51st, Brazil is 52nd, South Africa is 55th, Argentina is 57th and Indonesia is 61st. Mexico’s economic complexity has grown significantly in the past 50 years. It grew from 0.39 in 1964 to 1.14 in 2008; this increase ranked it 14th of 99 countries. (Countries improving faster than Mexico include: Thailand 2nd, Indonesia 5th, Brazil 7th, and Turkey 10th.) Over 60% of Mexico’s growth occurred between 1998 and 2008 when its ECI jumped from 0.80 to 1.14.

The Atlas argues that countries such as Mexico, with high levels of complexity given their income level, are expected to grow more rapidly in future years. We will explore this topic further in a future post.

Related posts:


The widening income gap in Mexico; the rich earn 26 times more than the poor

 Updates to Geo-Mexico  Comments Off on The widening income gap in Mexico; the rich earn 26 times more than the poor
Dec 202011
 

A recent OECD (Organisation for Economic Cooperation and Development) study – “Divided We Stand: Why Inequality Keeps Rising” – shows that in the last 25 years, the “real” (adjusted for inflation) income of the richest 10% of Mexican households has risen by 1.7%, compared to only 0.8% for the poorest 10% of  households.

The gap between rich and poor for OECD members is at its highest for 30 years. Mexico has the dubious distinction of being the OECD member with the second largest gap in household incomes, exceeded only by Chile. The average income of the richest 10% of households in Mexico is now a staggering 26 times higher than the average income for the poorest 10% of households.

To quote the OECD report: “The income gap has risen even in traditionally egalitarian countries, such as Germany, Denmark and Sweden, from 5 to 1 in the 1980s to 6 to 1 today. The gap is 10 to 1 in Italy, Japan, Korea and the United Kingdom, and higher still, at 14 to 1 in Israel, Turkey and the United States.” The mean value for all OECD members is slightly less than 9.

In 2008, the richest homes in Mexico had an average income of 228,900 pesos (about 20,800 dollars at the then exchange rate), compared to just 8,700 pesos (790 dollars) for the poorest 10% of homes.

Looking at some of the factors likely to have caused the widening gap, the OECD report points out that, “Societal changes – more single people and single-parent households, more partners marrying within the same earnings classes – explained more than 70% of the increase in household earnings inequality. In other OECD countries, this factor was much less important. At the same time, women’s higher employment rates helped reducing household earnings inequality considerably.”

Full 400-page report:

Related posts:


Mexican migrants and remittances: an introduction

 Books and resources, Index page  Comments Off on Mexican migrants and remittances: an introduction
Nov 072011
 

Remittances (the funds sent by migrant workers back to their families) are a major international financial flow into Mexico. Remittances bring more than 20 billion dollars a year into the economy, an amount equivalent to 2.5% of Mexico’s GDP.

On a per person basis, Mexico receives more worker remittances than any other major country in the world. An estimated 20% of Mexican residents regularly receive some financial support from relatives working abroad. Such remittances are the mainstay of the economies of many Mexican families, especially in rural areas of Durango, Zacatecas, Guanajuato, Jalisco and Michoacán.

The causes and consequences of mass out-migration and large remittance payments are varied, and sometimes disputed. For background, causes and trends, try:

For some impacts of Mexican migrants on the USA (of varying importance), see:

The four subtitles used in the Atlantic Magazine article are useful reminders of some of the other major aspects of international migration from Mexico. Again, links are given to previous Geo-Mexico posts which look at good examples.

“Branching Out” emphasizes the links that exist between communities, often referred to as “migration channels”.

“The Hollow States” identifies the five major “states of origin”—Guanajuato, Jalisco, Michoacán, San Luis Potosí and Zacatecas—which receive almost 50% of all remittance payments.

“Staying Put” points out that improved economic conditions in Mexico in recent decades, have restricted out-migration from certain areas, especially the border region. Recent developments in Mexico’s war on drugs have, however, led to an increase in the number of border residents moving to bigger, safer cities further south, or seeking to emigrate to the USA.

“Community Development” stresses the important link between “hometown associations” (groupings, found in many US cities, of Mexican migrants sharing a common area of origin) and their related villages and towns in Mexico. Many community development projects in areas of high out-migration have been financed by remittances. In many cases, the three levels of Mexican government—municipal, state and federal—provide matching funds for such projects, meaning that remittances only pay for 25% of the total costs.

In future posts, we will examine some of these aspects of remittances in more detail, and take a much closer look at the precise mechanisms used to make the international financial transfers involved.