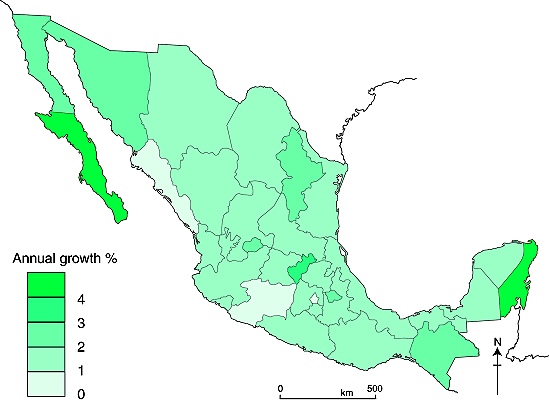
The publication of the preliminary results from this year’s population census has allowed us to update our map of Mexico’s recent population change (Figure 8.3 of Geo-Mexico: the geography and dynamics of modern Mexico). We are delighted to bring you what may be the first map to be published anywhere in the world of Mexico’s population change over the past decade:
The pattern on this map for 2000-2010 shows that population change over this period has been broadly similar to that for the period 1970-2005 (Figure 8.3 of Geo-Mexico: the geography and dynamics of modern Mexico). Mexico’s total population has grown by an average of 1.52%/yr over the past decade.
Things to note:
The fastest growth rates are in Baja California Sur and Quintana Roo, both states where tourism continues to develop rapidly and attract more migrants.
The slowest rates are in the Federal District (Mexico D.F.), Michoacán and Sinaloa, all of which have rates of less than 1%/yr. Michoacán’s low rate of increase is an anomaly, given the state’s high birth rate, and must be due to out-migration.
In central Mexico, the state of Querétaro stands out as being the most dynamic state in population terms, registering a growth of more than 3%/yr over the last decade.
Discussion Question: How does this map compare to the map of GDP/person?
Several chapters of Geo-Mexico: the geography and dynamics of modern Mexico discuss population issues, including population growth, distribution and density. Buy your copy today to have a handy reference guide to all major aspects of Mexico’s geography!

Sorry, the comment form is closed at this time.