A recent post on Polis, “a collaborative blog about cities across the world”, focuses on the street patterns in Mexico City.
The post uses Google Earth images of different parts of the city to illustrate how street patterns vary between neighborhoods with different levels of wealth. This approach has long been used in urban geography, but the examples provided are a useful reminder of the value of “old-school” map interpretation skills, some of which are rapidly being lost in the age of online maps.
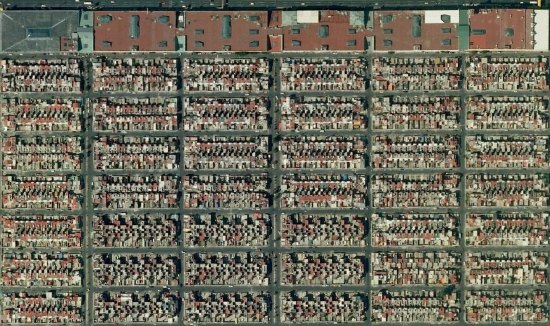
Mexico City Metropolitan Area: Fuentes de Aragón
A simple exercise for students would be to ask them to choose two similar-sized cities, one in the USA and one in Mexico, and then use Google Maps and Google Earth images to compare their urban morphology (street patterns). It is worth comparing areas of different land uses (such as industrial, commercial, residential). The analysis should include some annotated images highlighting the key similarities and differences.
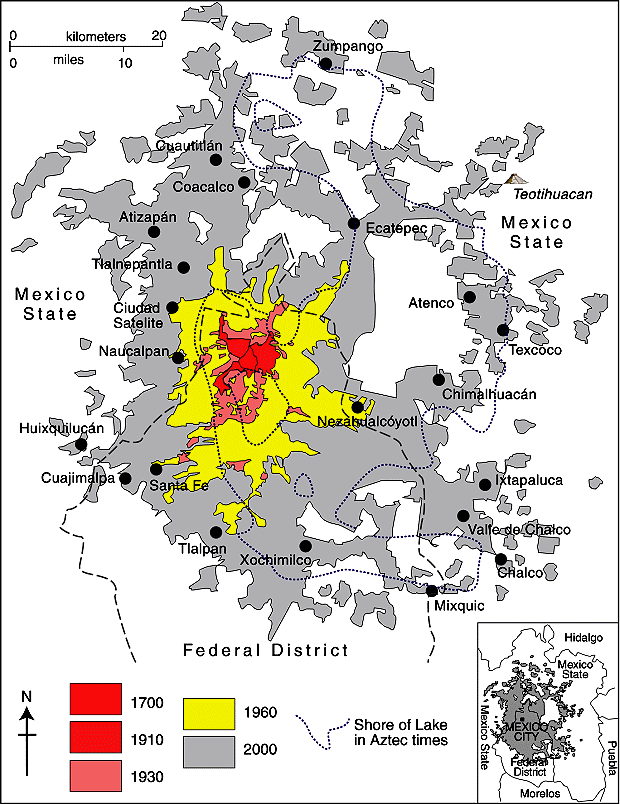
Spatial growth of Mexico City Metropolitan Area (Geo-Mexico Fig 22.2; all rights reserved)
The striking rectilinear lines usually found in poorer neighborhoods are in stark contrast to the curvilinear street patterns common in wealthier suburbs. In a city with a long history, like Mexico City, it is easy to locate and identify residential areas of very different age. (In general, the older residential areas are closer to the city center than newer residential areas.)
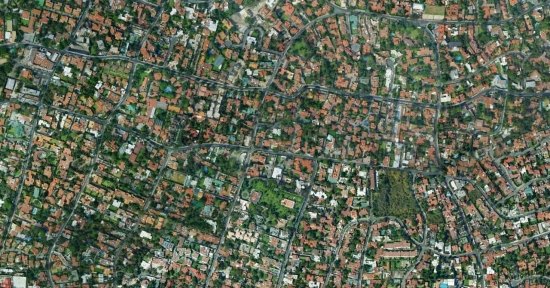
Mexico City: Pedregal San Angel
In the case of both Mexico City and Guadalajara (Mexico’s second largest city), a transect across the city from the wealthy west to the much poorer east will reveal remarkable differences in street patterns, corresponding closely to the patterns of wealth.
Related posts:
- Mexico’s changing urban landscape: the rapid rise of low-income subdivisions
- Santa Fe, a case study of a real estate development on Mexico City’s periphery
- A case study of low-income housing on the urban periphery
- Vecindades, Mexico City’s inner-city slums
- Nezahualcoyotl, an irregular settlement which grew into a monster
- Informal settlements or “colonias populares” in Mexico’s cities
- Mexico City tackles the challenges of population, commuting and air quality
- Mexico City in colonial times: 1530–1820
- How fast is the ground sinking in Mexico City and what can be done about it?
Sorry, the comment form is closed at this time.