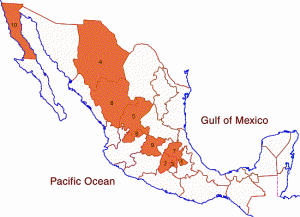
The table shows the ten coolest states in Mexico, defined by their average annual temperature.
| Rank | State | Average annual temperature (degrees C) |
|---|---|---|
| 1 | Tlaxcala | 14.1 |
| 2= | Estado de México | 15.2 |
| 2= | Federal District | 15.2 |
| 4 | Chihuahua | 16.6 |
| 5= | Zacatecas | 17.2 |
| 5= | Aguascalientes | 17.2 |
| 7 | Hidalgo | 17.4 |
| 8 | Durango | 17.7 |
| 9 | Guanajuato | 17.9 |
| 10 | Baja California | 18.5 |
In both Canada and the USA, average temperatures tend to depend largely on latitude, ie. they decrease towards the north of the country. This is clearly not the case in Mexico.
(a) What factors apart from latitude influence the average temperatures in Mexico’s states? Try to find evidence that either supports (or refutes) your ideas.
(b) Is there any connection between average temperature and precipitation amounts? Compare this map of states which are relatively cool with the states which have
(c) Can you guess where the warmest states in Mexico will be? To find out if you are right, you can find an atlas or on-line map showing average temperatures in Mexico, or keep reading the Geo-Mexico blog each day until we include our own map showing the warmest states!
Mexico’s diverse climates are the subject of chapter 4 of Geo-Mexico: the geography and dynamics of modern Mexico. Climate-related hazards are analyzed in chapters 6 and 7. Buy your copy today!

Sorry, the comment form is closed at this time.