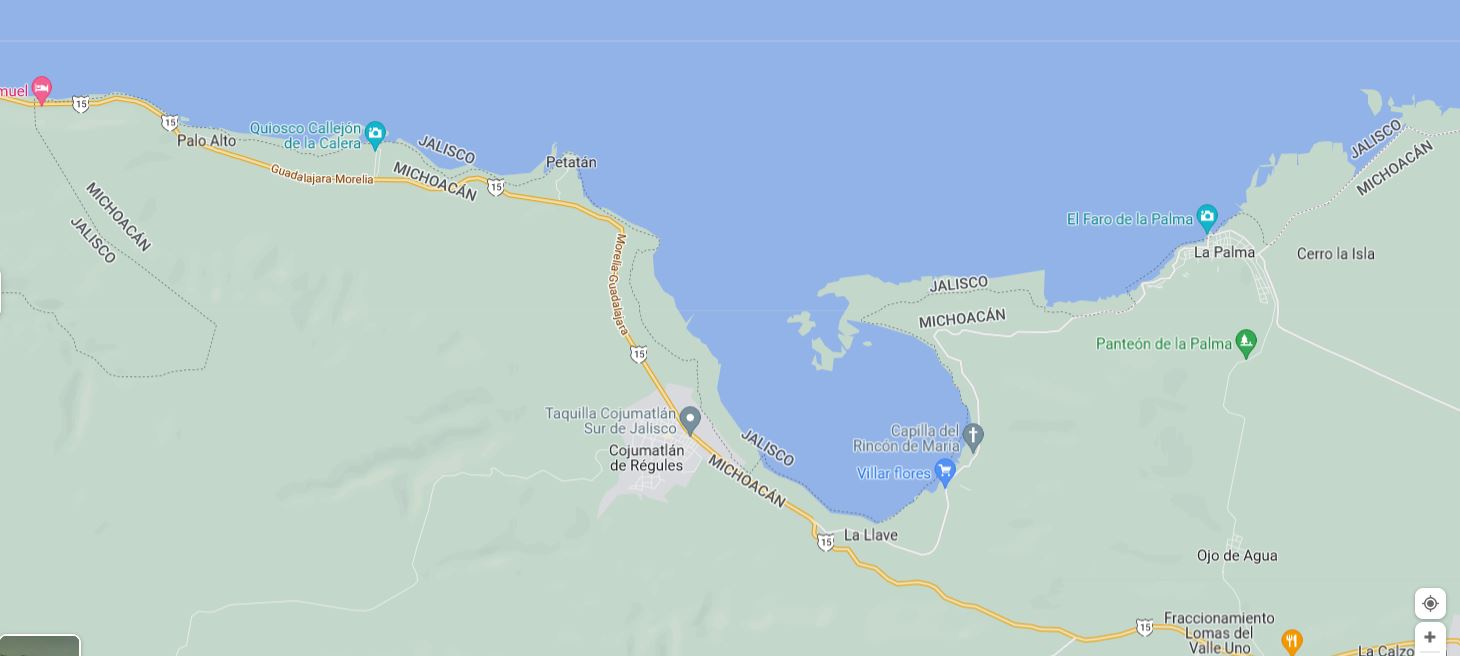
Is the south shore of Lake Chapala in Jalisco or in Michoacán?

 Maps, Mexico's geography in the Press  Comments Off on Is the south shore of Lake Chapala in Jalisco or in Michoacán?
Aug 242022
 

According to Google Maps, the entire southern shore of Lake Chapala belongs to Jalisco, not Michoacán . . .
– Según Google, toda la orilla sur del lago Chapala pertenece a Jalisco, no a Michoacán . . .

The south shore of Lake Chapala according to Google Maps (2022)

Google might want to alert Mexico’s mapping and statistics agency, INEGI, to that ‘fact.’

Google knows best? Not always!!

Population change in Jalisco, 2000-2010

 Maps  Comments Off on Population change in Jalisco, 2000-2010
Jan 242017
 

During the ten years between 2000 and 2010, Jalisco’s population increased by over a million from 6,322,002 to 7,350,355. Suburbs around Guadalajara dominated demographic change increasing by 887,301 (43.2%) to 2,940,118 (see Population change in the Guadalajara Metropolitan Area). The greatest growth was in the southern suburb of Tlajomulco which grew 237% from 123,619 to 416,552. Interestingly, the population of the central city of Guadalajara decreased by 152,185 to 1,494,134.

In this post, we look at the pattern of population change for the other municipalities in the state of Jalisco. The map shows the average annual percentage change in population for the period 2000-2010. It is worth noting that the population of a place with an annual growth rate of 3% will double in about 24 years.

Map of population change in Jalisco

Population change in Jalisco, 2000-2010. Copyright Tony Burton. Click image to enlarge.

What other areas of Jalisco are growing fastest?

Puerto Vallarta, the other major urban area in the state, grew by 38% to 255,725. The northern suburbs of Puerto Vallarta in the state of Nayarit grew even faster. The other major ex-pat area around Lake Chapala grew more slowly. Chapala grew by 12.4% to 48,812, Jocotepec by 18.0% to 42,142, while Poncitlan increased by 18.6% to 48,407.

Jalisco grew by 16.3% during the decade or an average increase of about 1.5% per year. But rates of population growth varied greatly from one area to another.

As indicated in the map, many of the isolated rural municipalities in the state actually declined in population (yellow-green and yellow areas). While births in these rural communities generally exceeded deaths, they experienced significant out migration.

In addition, many other rural communities in western Jalisco grew slowly at less than 1% per year (light pink on the map). Most of the communities in eastern Jalisco grew 1 – 2% about the same rate as the state as a whole.

Surprisingly, three of the most isolated municipalities in far northern Jalisco grew rapidly at over 3% per year. These municipalities are home to many indigenous Huichol Indians. Only relatively low numbers of Huichol Indians have migrated away from their ancestral homelands, so out-migration from these municipalities is much lower than from other remote parts of the state. In recent years, mining activity which was the mainstay of the economy of this area in colonial times, has made something of a comeback, thereby increasing local economic activity and opportunities.

Methodological note: The map depicts the municipal boundaries as they existed in the year 2000. Since that time, the municipality of Arandas has been split into two, reducing its territorial extent, and creating the new municipality of San Ignacio Cerro Gordo.

Nov 012016
 

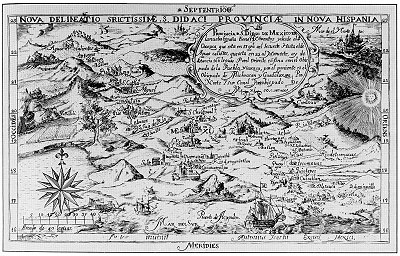
One of the earliest known maps engraved in colonial New Spain (Mexico) was that drawn by Antonio Ysarti in 1682. It shows the Franciscan Province of  San Diego of Mexico, with its 14 friaries, from Oaxaca in the southeast to Aguascalientes in the northwest. It covers the archdiocese of Mexico City, as well as the dioceses of  Puebla and Oaxaca to the east, and Michoacán and Guadalajara to the west.

Ysarti's 1682 map of New Spain

Ysarti’s 1682 map of New Spain; click map for an enlarged version of Mexico City to Acapulco

The beautifully-drawn map was originally published to illustrate Baltasar de Medina’s 1682 Chronica de la Santa Provincia de San Diego de Mexico, printed by Juan de Ribero. In the words of the sellers of this map’s original copper plate to the Library of Congress, “This artifact is tangible evidence of an emerging scientific and artistic community in a growing colonial empire.”

Sadly, very little is known about Antonio Ysarti, the map’s talented cartographer; not even his nationality is known for certain.

The map measures 29 x 19 cm approx (11.25 x 7.25 inches) and names more than 50 places. Each friary is depicted as an architecturally distinct building, not by the use of a common symbol.

Q. How well do you know central Mexico? Click on the map above (to reveal the section between Mexico City and Acapulco) and then see how many places you can identify and match to present-day place names.

Online version of this map, offering the ability to zoom in to specific parts

The changing political frontiers of Mexico are the subject of chapter 12 of Geo-Mexico: the geography and dynamics of modern Mexico, a handy reference guide to all aspects of Mexico’s geography. If you have enjoyed this post, please consider gifting a copy of Geo-Mexico to someone in the coming holiday season.

Sep 142016
 

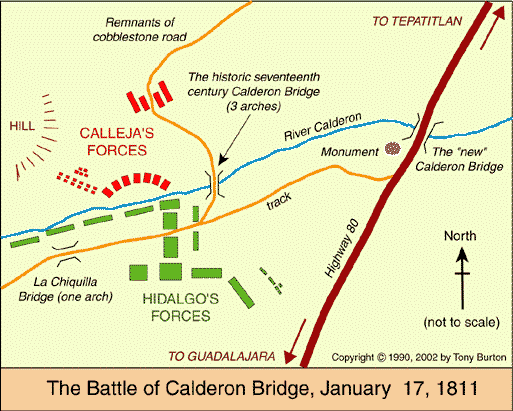
The battle in question is the Battle of Calderón Bridge (Batalla del Puente de Calderón), fought just outside Guadalajara in January 1811 as part of Mexico’s fight for Independence. The decisive battle was waged on the morning of Thursday, January 17.

On one side was Ignacio Allende with some 80,000 ill-equipped and untrained supporters of Father Miguel Hidalgo, the priest who launched Mexico on the road to Independence. On the other side was the numerically much smaller, but professional, Royalist army led by General Félix María Calleja, fighting for the King of Spain .

After six hours of fighting, a stray grenade from the Royalist side landed smack in the middle of the insurgents’ ammunition supplies, resulting in a fearful explosion and fire which brought the battle to a speedy end. Hidalgo and his men fled northwards; the crown troops followed, hot on their heels. The loss of this battle effectively dashed hopes of any quick independence from Spain. Mexico’s  Independence was delayed another ten years, until 1821.

The area where this important battle took place is between Guadalajara and Tepatitla, in the state of Jalisco. A few kilometers beyond Zapotlanejo, the site is clearly marked by a large monument to Father Hidalgo, prompting one to reflect on how often the losers of a battle are commemorated, rather than the winners. The statue overlooks the battlefield: the shallow valley of the Calderón river. In Hidalgo’s time, only a single bridge spanned the river. It was made a national monument in 1932.

Today, three different bridges exist in the general vicinity of the battle and a fourth, not far away, is used by the toll highway to Lagos de Moreno. It’s easy to tell which of the four bridges is the correct one, since it has a plaque commemorating the event!

Curiously, the historically-accepted plan of the battle, reproduced in dozens of scholarly works and hung on display in many museums around the country (still including, to the best of my knowledge, the Regional Museum in Guadalajara) is in fact, upside down! The true orientation of the map was proven (way beyond any reasonable doubt) by Mexican geographer Alma Rosa Bárcenas. In a brilliant and clearly written article, which appeared in the first isue of “Geografía”, published by INEGI in Mexico City in 1986, she clears up the confusion surrounding the exact site of the battle.

She proves, using both field-work and aerial photographs to supplement contemporary battle descriptions which give clues to terrain, slopes and visibility, that the map was drawn “south-upwards”. The map’s “north arrow” actually points due south!

Here is the battle plan the right way round. At last, the battle descriptions make sense! Now, anyone visiting the battle site has a chance to work out for themselves the true dispositions of the troops on both sides, and relive, if only in their imagination, the course of this key battle in Mexico’s War of Independence…

This is an edited version of an article originally published on MexConnect. Click here for the original article

Geo-Mexico: the geography and dynamics of modern Mexico takes an in-depth look at the implications of Mexico’s 1810-1821 War of Independence for the development of transportation and communications systems, as well as migration patterns, settlements and many other aspects of Mexico’s geography and development.

As an added bonus, it has no maps that are upside-down!

How long is Mexico’s coastline?

 Maps  Comments Off on How long is Mexico’s coastline?
Sep 122016
 

This might seem like a very simple question to answer, but actually it is a question which has no definitive answer!

According to the CIA World Factbook, Mexico has 9,330 kilometers of coastline.

According to Mexico’s National Statistics Institute (INEGI), it has 11,122 kilometers of coastline, and that figure apparently excludes the coastlines of Mexico’s various islands.

Amazingly, it is perfectly possible that both figures are ‘correct’.

This is because the length of  a coastline depends in large part on the scale of the map used to make the measurements.  All maps are generalization of reality, and some are more generalized than others. Small-scale maps of Mexico fail to show every bay and headland; measurements made on them will invariably be under the true value. The larger the scale of the map, the closer the measurement will be to ‘reality’, because the map will show more indentations or tiny crenulations.

Theoretically (mathematically), is is  impossible to ever arrive at a definitive length for a coastline since the harder you look (the larger the scale of the map), the more you see, and this carries on indefinitely. This is why it is not at all surprising that different sources offer different distances for the length of Mexico’s coastline (or for particular rivers).

And the moral of this story? In geography, never assume that an apparently simple question has a simple answer!

Related post

Aug 012016
 

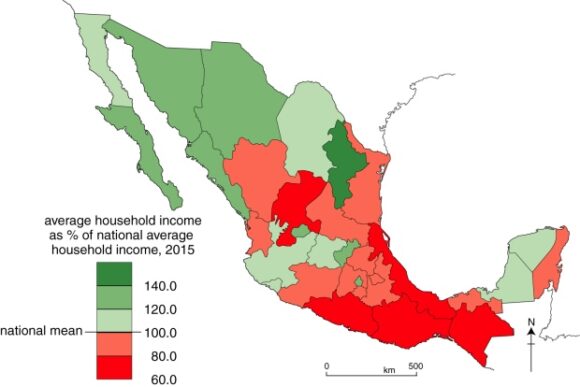
The National Statistics Agency’s (INEGI’s) 2015 Survey of Socioeconomic Conditions includes data for average household incomes in Mexico, on a state-by-state basis. The national average household income (for a three month period) is $45,887 (pesos) . The map below shows how each state’s average household income compares to the national average.

Household income, by state, 2015. Data: INEGI. Cartography: Tony Burton / Geo-Mexico; all rights reserved

Household income, by state, 2015. Data: INEGI. Cartography: Tony Burton / Geo-Mexico

The state with the highest household income is Nuevo León, with $66,836, more than 140% of the national average. The state with the lowest household income is Guerrero ($27,584), where the average household income is only 60.1% of the national average. Guerrero’s average household income is only 41% of the average for Nuevo León.

As we have regularly highlighted in the past, regional differences in Mexico are considerable, and a definite “north-south divide”can be identified for almost every socio-economic variable. Development efforts need to be focused on improving the key indicators for southern Mexico and reducing these regional disparities.

Related posts:

Apr 282016
 

Like most geographers, I collect maps and information wherever I travel; you never know what surprises await. Tourism publications are especially interesting since they are specifically designed (one assumes) to show the best side of the places described.

My collection of tourist brochures associated with Jalisco and the Lake Chapala area dates back more than thirty years. Many early versions had stylized maps, drawn by graphic designers, not cartographers, with sound (if uninspiring) text in Spanish. English translations were often unintelligible. In the 1980s, several bilingual members of the now-defunct Association of Travel Reporters, based in Guadalajara, offered to help the Jalisco State Tourism Department improve its translations, but the offer was politely declined.

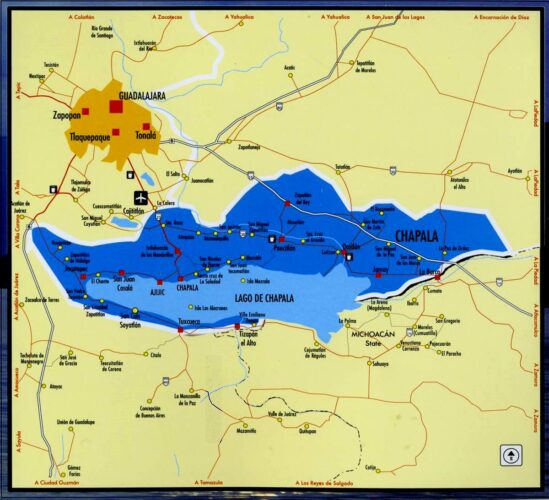
chapala-brochure-2016

As this latest brochure relating to Lake Chapala shows, translation standards have not improved significantly since then, and remain a long way off “native speaker” level. This is particularly unfortunate, given that this area of Mexico has the largest concentration of English-speakers in the country.

Here, for example, is the English translation of the attractions of San Juan Cosalá:

One has to closely experience San Juan Cosalá in order to feel and enjoy it to the most, so come and discover a place you will never want to leave, for every happy moment can be lived here, as just by visiting you feel enveloped in an affluent of joy and vitality.

In getting to know it, just stroll across its Pier, or admire the harmonious architecture in San Juan Evangelista Church, or enjoy the exquisite aromas of seafood, bouncing from restaurants enlivened with fine music while walking over the Piedra Barrenada (Drilled Stone); or the rest;  freshness and fun offered in thermal waterparks and world level spas.

Undated tourism brochure, collected April 2016

Undated tourism brochure, collected April 2016

The cartography (above) also leaves a lot to be desired. A key (not shown in this post) is provided but the Jalisco Tourism department clearly needs to hire a geographer if they want to publish useful and meaningful maps. Details worth noting include:

  • No symbol in the key for the “gas station” signs shown on the map. The map shows only four gas stations in this area (and none in Chapala or Ajijic); there are dozens of others not shown on the map, including several in Chapala and Ajijic.
  • The map has no scale.
  • The Isla de los Alacranes, a short boat-ride from Chapala, is shown a long way south of its true position, and a lot further from Chapala than it really is.
  • The dark blue area is, according to the key, the Chapala Lakeshore. I have absolutely no idea what it really represents! Lake Chapala’s catchment area is a completely different shape to the dark blue area. The “Chapala Lakeshore” should, obviously, also include the south-east section of the lake around Las Palmas and Cojumatlán. Much of the area colored dark blue is out of view of the lake, and drains towards the Santiago River, not the lake.
  • Placing the word “CHAPALA” in the north-east section of the dark blue area is totally misleading. The area where the word is written is NOT in the lake basin, not in view of the lake, and is not even in the municipality of Chapala. Again, I have no idea why the artist responsible for this map chose to ignore geography.

It is 2016, and Jalisco State tourism officials still need to improve the quality of their brochures and maps. Come on guys! Time to up your game!

Does Quintana Roo share a border with Guatemala? Not any longer.

 Maps, Updates to Geo-Mexico  Comments Off on Does Quintana Roo share a border with Guatemala? Not any longer.
Jan 072016
 

The state of Quintana Roo is Mexico’s youngest state (together with Baja California Sur), though this is set to change when Mexico City is formally declared a state, probably later this year. Quintana Roo, established in 1974, is well known to tourists because its largest city is the tourist mega-resort of Cancún, on Mexico’s Caribbean coast.

The northern part of Quintana Roo has a shoreline along the Gulf of Mexico. To the west of Quintana Roo lie the states of Yucatán and Campeche. But what about the southern limit of the state? Does it, or does it not, share a border with Guatemala?

In the early 1990s, the answer to this question was certainly “yes”, but things have changed since then, and the correct answer today is “not any longer”.

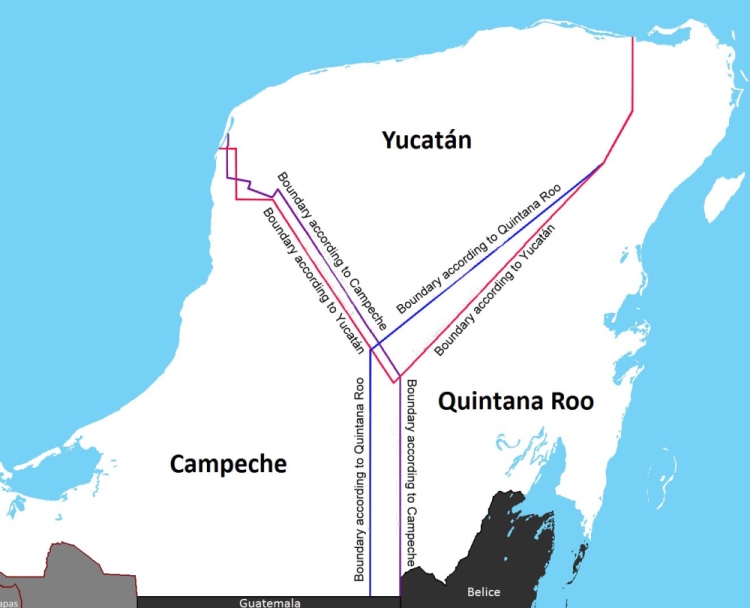
Boundary disputes in Yucatan Peninsula

  • Source: INEGI Map of the Disputed Areas

The state officially claims an area of 44,705 square kilometers (17,261 sq mi), but since 1996-97 there has  been a boundary dispute with the states of Yucatán and Campeche over an area of approximately 10,200 square kilometers (3,900 sq mi).

The contentious boundary issue arose when Campeche delimited a new municipality, Calakmul, in the south-east part of the state, and in doing so “annexed” a piece of Quintana Roo. This shifted the boundary between the two states towards the east, with a knock-on effect that the state of Yucatán also lost a small amount of territory to Campeche. However, Yucatán State simultaneously gained ground from Quintana Roo (see map). Confused? Well, that is really only the beginning, since the states of Yucatán and Campeche also dispute their shared boundary further north.

Confused administrative boundaries are never an easy thing to fix, and land boundary disputes are rife in Mexico at every level, so getting municipal, state and federal authorities to agree on a resolution takes time. The major Campeche-Quintana Roo dispute arose in the late 1990s, but was only finally settled, somewhat arbitrarily by federal court, in 2013. The court sided with Campeche, and Quintana Roo lost its border with Guatemala.

Oh dear… our Geo-Mexico map of Quintana Roo is now out of date!

Related posts:

Maps of Mexico on geo-mexico.com

 Index page, Maps  Comments Off on Maps of Mexico on geo-mexico.com
Dec 012015
 

This page lists some of the many maps on Geo-Mexico.com.

Want to use a map? All these maps [except those marked  (*)] are original Geo-Mexico.com maps. The use of any of Geo-Mexico’s maps for educational purposes is fine, provided credit is given to  Geo-Mexico.com. For commercial use (including business presentations, newsletters, magazines, books, TV), please contact us with details of your project via the link or the Contact Us form.

General / Educational:

Physical geography

Hazards:

Population

Economy

Regional and city maps

Crime:

History:

Other:

Mapping exercises:

 Tagged with:

The geography of Mexico’s beer industry

 Maps, Other  Comments Off on The geography of Mexico’s beer industry
Jan 292015
 

In a previous post – The emergence of two major beer-makers in Mexico – we looked at how Mexico’s beer industry came to be dominated by two large players: Femsa and Modelo, both now owned by foreign corporations.

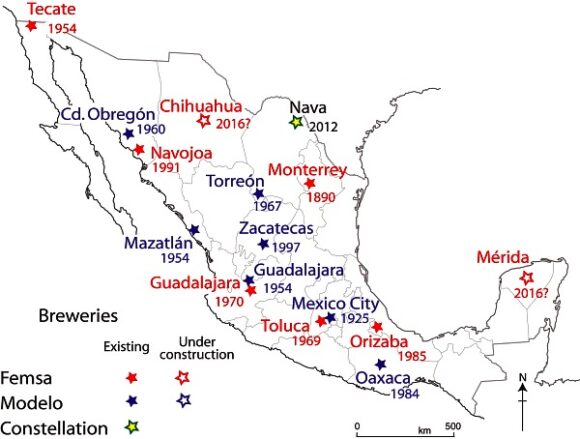
The map below shows the location and date of inauguration of all major breweries in Mexico.

The location and inauguration dates of Femsa and Modelo breweries in Mexico

The location and inauguration dates of Femsa and Modelo breweries in Mexico

How large is Mexico’s market for beer?

A 2010 report from the national beer industry claims that the average annual consumption of beer in Mexico is 60 liters per adult, a figure that has not changed significantly in the last 20 years. The equivalent figure in Germany is 120 liters a person, so there is still considerable potential for growth. Mexico’s breweries provide about 80,000 jobs directly and a further 800,000 indirectly.

Total beer sales each year are worth as much as 20 billion dollars. The value of sales has risen sharply, at about 5% a year, due mainly to higher exports. Mexico has become the world’s second largest beer exporter, after the Netherlands, and is the world’s sixth largest producer and consumer of beer, brewing over 8.6 billion liters a year.

The USA is the main export market. Five of the 25 most popular brands in the USA are Grupo Modelo beers: Corona, Modelo Especial, Corona Light, Pacífico and Negra Modelo. This has helped Grupo Modelo, Mexico’s leading brewer, become the world’s sixth largest brewer. Modelo’s Corona beer has been the #1 imported beer in the USA since 1997. It is one of the world’s top five beers in terms of sales, even though it is not especially popular in Mexico!

One of Modelo’s fastest growing export markets is China, where it has rapidly become the second most popular imported beer. In Mexico’s domestic beer market, Modelo and Femsa face increased competition from imported beers such as Budweiser, Miller and Heineken.

There are several other smaller breweries in addition to those owned by Femsa and Modelo. One significant trend, echoing other regions in North America, has been a marked upswing in the number of small, specialist, boutique breweries, such as Cervecería San Angel and the Santa Fe Beer Company in Mexico City and Minerva Brewery in Guadalajara. Other popular brands of craft beer include Perro Negro from Guadalajara, Insurgente from Tijuana, Libertadores from Michoacán and the varied products of the Baja Brewing Company from Los Cabos.

These smaller “craft” breweries produced 10.5 million liters of beer in 2014, according to the Mexican Beer Makers Association (Asociación de Cerveceros de la República Mexicana, Acermex), and account for only 0.16% of the total market, but their share of the market is growing at more than 40% a year. The association hopes that smaller breweries can enjoy as much as 1% of the market by 2016.

The rise of craft beers has seen a corresponding proliferation of specialist pubs that stock pale ales, pilsners, porters, stouts and wheat beers in the trendier districts of all the major cities, including Mexico City, Guadalajara, Monterrey and Querétaro.

In Guadalajara, in 2008, two local craft breweries – Cerveceria Minerva and  Cerveceria Revolución – co-founded the Guadalajara Beer Festival to showcase Mexican their products and introduce previously unavailable European import brands. The festival is now a three day event that attracts as many as 30,000 visitors a year; it claims to be Latin America’s largest beer festival.

Mexico’s economic geography is analyzed in chapters 14–20 of Geo-Mexico: the geography and dynamics of modern Mexico. Buy your copy of this invaluable reference guide today!

Which states in Mexico are the most competitive?

 Maps, Mexico's geography in the Press  Comments Off on Which states in Mexico are the most competitive?
Dec 032014
 

The Mexican Institute for Competitiveness (Instituto Mexicano para la Competitividad AC, IMCO) has published its annual analysis of the competitiveness of Mexico’s states. The report provides some interesting insights into which areas of Mexico are “most competitive” in business terms, defined as their capacity to attract and retain investments and a talented workforce.

This suggests a business environment that maximizes the socio-economic potential of both the business entities and individuals residing in a a specific area. It also suggests that any improved well-being (economic and social) will be maintained (sustained).

The index is based on 89 indicators in 10 sub-indices. The 10 major factors include the reliability and objectivity of the legal system, the sustainable management of the natural environment, the stability of macroeconomic policies, the degree to which society is non-divisive, educated and healthy, and the stability and functioning of the political system.

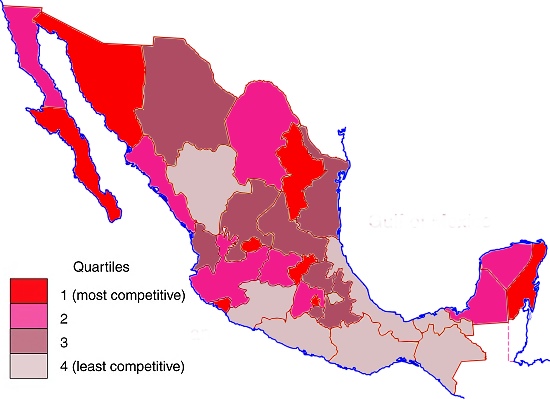
The latest report relies on 2012 data. Mexico’s basic pattern of competitiveness at the state level is shown in the map.

Mexico, 2014. Map: Tony Burton; all rights reserved

Competitiveness in Mexico, 2014. Map: Tony Burton; all rights reserved

The five most competitive states in Mexico are:

  • Federal District (Mexico D.F.)
  • Baja California Sur
  • Aguascalientes
  • Nuevo León
  • Querétaro

While a full analysis of why some states are more competitive than others is beyond the scope of this post, the single most striking aspect of this map is the persistent low degree of competitiveness of several of Mexico’s poorest states, such as Guerrero, Oaxaca and Chiapas.

In general, states in Northern Mexico are noticeably more competitive than those in Southern Mexico. Two areas on opposite coasts where tourism is extremely important to the local and national economy – Baja California Sur and Quintana Roo – are both very competitive.

Mexico’s economy and workforce are analyzed in chapters 14 to 20 of Geo-Mexico: the geography and dynamics of modern Mexico. Ask your library to buy a copy of this handy reference guide to all aspects of Mexico’s geography today! Better yet, order your own copy, which will still arrive in time for Christmas…

Related posts:

New York Public LIbrary online historical maps of Mexico

 Books and resources, Maps, Mexico's geography in the Press  Comments Off on New York Public LIbrary online historical maps of Mexico
Jul 022014
 

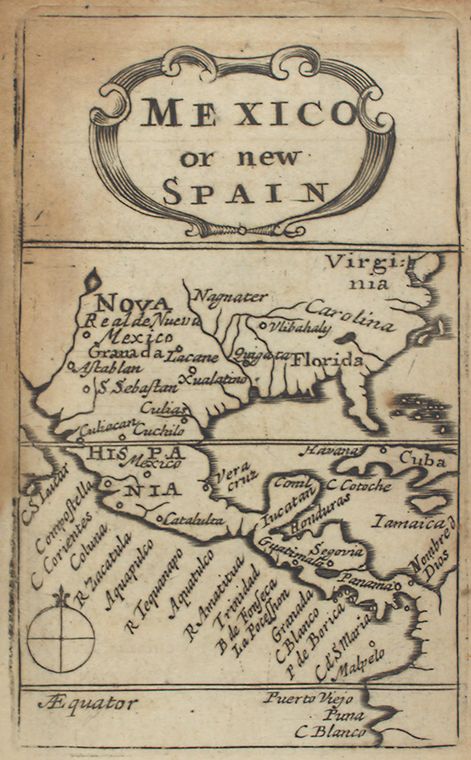
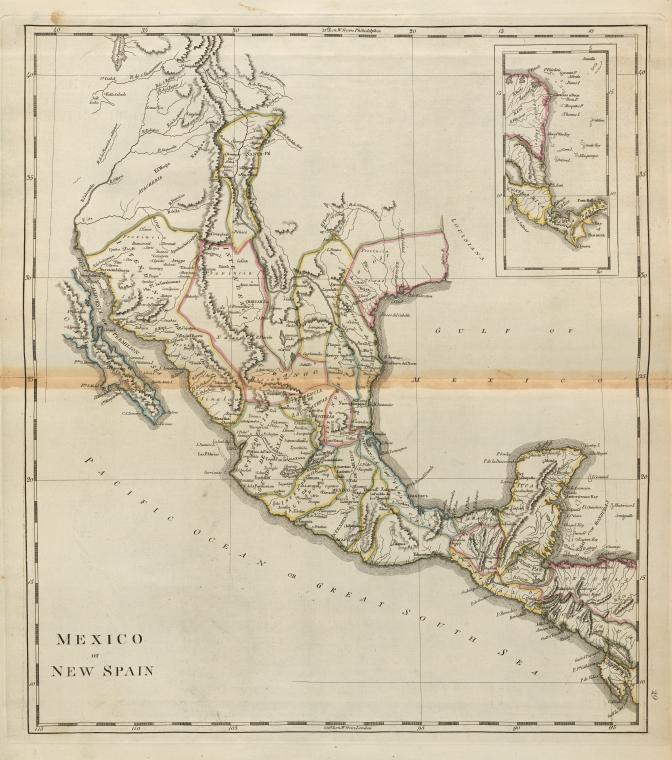
A few months back, the New York Public Library (NYPL) announced that it was placing high resolution scans of more than 20,000 cartographic works online. The NYPL also asserted that it believed that “these maps have no known US copyright restrictions” and that it “is distributing these images under a Creative Commons CC0 1.0 Universal Public Domain Dedication.”

The maps can be viewed and downloaded via the New York Public Library’s Digital Collections page, and the NYPL Map Warper.

Naturally, this piqued Geo-Mexico’s interest, and we spent several enjoyable hours browsing the various maps included in this online treasure-trove that have some relation to Mexico. A search for “Mexico” yielded 36 maps, though this number included many that depict New Mexico.

seller

This 1679 map “Mexico, or, New Spain” (above) comes from “Atlas minimus, or, A book of geography : shewing all the empires, monarchies, kingdomes, regions, dominions, principalities and countries, in the whole world”, by John Seller.

Far more detailed, and a more recognizable shape emerged by 1713, with the publication of Mexico, or, New Spain : divided into the audiance of Guadalayara, Mexico, and Guatimala, Florida, from “System of geography with new maps”.

Carey's 1814 map.

Carey’s 1814 map.

This 1814 map “Mexico of New Spain” (above) is part of “Carey’s general atlas, improved and enlarged : being a collection of maps of the world and quarters, their principal empires, kingdoms, &c.”

From the mid-nineteenth century, the maps become very much like modern-day atlas maps. For example, this 1876 map, “Mexico; Mexico to Vera-Cruz; The Isthmus of Tehuantepecfrom the “New illustrated atlas of Dutchess County, New York. / Compiled & drawn from personal examinations, surveys etc. under the personal supervision of O.W. Gray & Son and F.A. Davis, and published under the superintendence of H. L. Kochersperger”.

Related posts:

The volcanic calderas of Mexico’s Volcanic Axis

 Maps, Other  Comments Off on The volcanic calderas of Mexico’s Volcanic Axis
Jul 082013
 

There is still lots of work needed to fully unravel the geological secrets of Mexico’s Volcanic Axis which crosses the country between latitudes 19̊ and 21̊ North. Unlike most volcanic belts elsewhere in the world, this one does not appear at first sight to correspond to any plate boundary. Another of the mysteries of this volcanic region, where igneous upheavals have shaped the landscape for several million years, is the relative dearth of calderas, the “super craters” formed either by collapse or by giant explosions.

While the toponym La Caldera is used fairly commonly in Mexico’s volcanic regions for a volcano or volcanic crater, geologists restrict the term to the much larger landform that results from the collapse or super-explosion of a volcano. Even so, there is still some debate among specialists as to the precise definition of the term caldera.

Geologists have proposed a threefold division of the Volcanic Axis, based on differences in the volcanic landforms, in terms of their type, structure, age, morphology and chemistry.
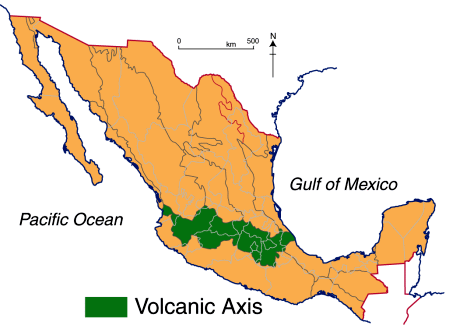
volcanic-axis

The western sector (see map below) extends from the western coast of Mexico to Lake Chapala (including the lake basin). The central sector covers the area between Lake Chapala and the twin volcanoes of Popocatepetl and Ixtaccihuatl, close to Mexico City. The eastern sector includes these twin volcanoes and extends as far as Mexico’s Gulf Coast.
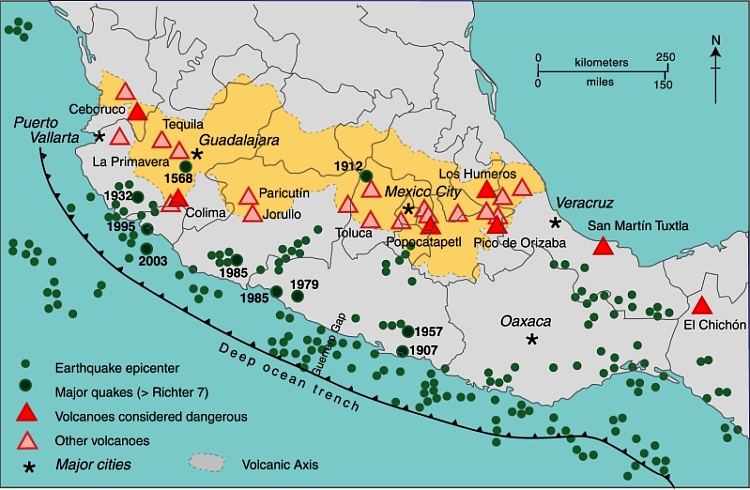
Mexico's Volcanic Axis (Fig 2.2 of Geo-Mexico, the geography and dynamics of modern Mexico. All rights reserved.

Mexico’s Volcanic Axis (Fig 2.2 of Geo-Mexico, the geography and dynamics of modern Mexico). All rights reserved.

The only caldera recognized in the western section is that of La Primavera, the forested area west of Guadalajara, whose formation we considered in

In the central and eastern sections of the Volcanic Axis, several other calderas have been recognized. They include (from west to east):

  • Los Azufres
  • Amealco
  • Mazahua
  • Huichapan
  • Los Humeros
  • Las Cumbres

Los Azufres

The precise origin of the Los Azufres caldera, in Michoacán, is still debated. The caldera is the site of an important geothermal power station with an installed capacity of 188 MW. (Mexico is the world’s fourth largest producer of geothermal energy, after USA, the Philippines and Indonesia.) The geothermal heat in this area is also used to heat the cabins in a local campground, and to dry wood and process fruit.

Amealco

The Amealco caldera is in the central part of the Mexican Volcanic Axis, midway between the towns of San Juan del Río and Maravatio. It dates from Pliocene times and has been heavily eroded since. It is about 11 km wide and 400 m deep and was the origin of great sheets of pyroclastic flow deposits (ignimbrites) with a total volume of around 500 cubic km.

Mazahua

Mazahua is a collapse caldera, 8 km in width, near the village of San Felipe del Progreso in the western part of the State of Mexico.

Huichapan

The Donguinyó-Huichapan caldera complex is 10 km in diameter and in the central sector of the Volcanic Axis. It appears to be two overlapping calderas, dating from around 5 million and 4.2 million years ago respectively. The rocks from the older caldera are intermediate to basic in composition, while those from the more recent caldera are acidic (high silica) rhyolites.

Los Humeros

The Los Humeros caldera is in the state of Puebla, close to its border with Veracruz. It is 55 km west-north-west of the city of Xalapa (Veracruz), relatively close to Teziutlán (Puebla). The main caldera (summit elevation 3150 m) is about 400 m deep and roughly oval in shape, with a diameter which varies from 15 to 21 km. It was formed about 460,000 years ago by the collapse of the underground magma chamber. Prior to collapse, lava emitted from this vent had covered 3500 square km with ignimbrite. Later, two smaller calderas formed nearby, with ages of about 100,000 years (Los Potreros caldera) and 30,000 years (El Xalapazco) respectively. Volcanic activity in this area has been utilized to produce generate geothermal power (installed capacity: 40 megawatts).

Las Cumbres

The easternmost caldera in Mexico is Las Cumbres, 15 km north of Pico de Orizaba, Mexico’s highest volcano, and close to the state boundary between Puebla and Veracruz. The Las Cumbres caldera was originally believed to be an explosion super-crater, but geologists now think that it was created due to the partial collapse of the eastern flank of the original volcano, between 40,000 and 350,000 years ago. The collapse of the side of Las Cumbres produced a huge debris avalanche (total volume estimated at 80 cubic km, which extended up to 120 km in the direction of the Gulf of Mexico.

Lake Alchichica

According to Dra. Esperanza Yarza de la Torre in Volcanes de México (UNAM; 1984), Lake Alchichica in the Oriental Basin near Puebla occupies another caldera. The basin has several shallow lakes, known locally as axalpazcos (“sandy basin with water” in the indigenous Nahuatl language). These occupy shallow craters (or in one case a caldera) and are largely sustained by ground water. The largest of the lakes, in a caldera, is Lake Alchichica, which has a diameter of 1888 meters, an area of 1.81 square km, and lies at an elevation of 2320 meters above sea level. The rim of the caldera rises 100 m above the lake level. The lake is used for irrigation. This lake is claimed to be Mexico’s deepest natural lake with a maximum depth of 64 meters, and a mean depth of 38.6 meters.

Main sources:

  • Gerardo J. Aguirre-Díaz & Fred W. McDowell. 1999. Volcanic evolution of the Amealco caldera, central Mexico. United States Geological Society. Special Paper 334.
  • Esperanza Yarza de la Torre. 1984. Volcanes de México. UNAM.

Want to read more?

  • Use the site’s tag system (left hand side of the page) to find lots more posts about Mexico’s volcanoes, geology and landforms.
Map of Yucatán Peninsula including Campeche, Mérida, Cancún, Riviera Maya and Cozumel

 Maps  Comments Off on Map of Yucatán Peninsula including Campeche, Mérida, Cancún, Riviera Maya and Cozumel
Mar 092013
 

Mexico’s Yucatán Peninsula, a low, flat limestone platform, is the most recently formed part of Mexico. The low topography, which is quite similar to western Cuba and southern Florida, is virtually all below 150 m (500 ft). The submerged western and northern portion of this platform is known as the Campeche Bank. The peninsula was connected to Cuba until the bridging section sank below sea level forming the Yucatán Channel. The west and north coasts are marked by lagoons, mangrove swamps and sand bars. The emergence and infilling of coastal lagoons in the southeastern and southwestern extremities of the peninsula have resulted in areas of marshland interspersed with remnants of the original lagoons.

Offshore to the east lie coral reefs. Most of the peninsula has shallow, highly permeable soils and virtually no surface water. However, underground water is relatively abundant. The peninsula is honeycombed with extensive underground cave systems, which are connected periodically to the surface via hundreds of natural sinkholes (cenotes). The ancient Maya believed that these cenotes led to the underworld.

Map of Yucatán Peninsula. Copyright 2010 Tony Burton. All rights reserved.

Mexico’s Yucatán Peninsula includes three states: Campeche, Yucatán and Quintana Roo. This region is the ancestral home of the Maya. There are about 800,000 Maya-speakers in Mexico, almost all of them living in this region. There are literally thousands of archaeological sites scattered across the peninsula, including many that are open to the public. Among the more famous are Uxmal, Chichen Itza, Calakmul (all three are UNESCO World Heritage sites), Tulum and  Coba. The city of Campeche (capital of the state of the same name) is also a World Heritage site on account of it being a walled city, one of the very few remaining in Mexico.

The state of Yucatán was important for sisal production. Between 1870 and 1920 the area experienced an economic boom based on the production of twine from sisal (oro verde or green gold). In order to transport the  sisal from the fields to processing centers and from there to the port of Sisal for export, plantation owners built an extensive (4500-km-long) network of narrow gauge railroads:

Quintana Roo is best known today for its tourism industry. The centrally planned resort of Cancún is Mexico’s leading tourist destination:

In Quintana Roo, 54% of the residents were born outside the state. These residents were mostly attracted to Quintana Roo by the rapidly growing tourist industry in Cancún and further south in the area known as the Maya Riviera. Almost 13% of Quintana Roo residents moved into the state within the last five years.

The Yucatán Peninsula has several important biosphere reserves:

  • Ría Celestún (Yucatán and Campeche): coastal region including important wetlands and drowned river valley (ría) with diverse fauna and flora, including flamingos.
  • Región de Calakmul (Yucatán): diverse tropical rainforests; the largest forest reserve in Mexico, with important Maya sites; ecotourism project.
  • Ría Lagartos (Yucatán): coastal estuary with diverse birdlife including more than 18000 pink flamingos as well as some 30,000 migratory birds.
  • Arrecife Alacranes (Yucatán): the largest coral reef in the Gulf of Mexico, and the only one in Yucatán state.
  • Sian Ka’an (Quintana Roo): coastal limestone plain, and extensive barrier reef system on Caribbean coast, with numerous archaeological sites; more than 4,000 plant species.
  • Banco Chinchorro (Quintana Roo): mosaic of open water, sea grass beds, mangroves, sandy beaches and coral reefs; more than 95 species of coral.

Related posts:


The geography of music and dance in Mexico

 Excerpts from Geo-Mexico, Maps  Comments Off on The geography of music and dance in Mexico
Nov 272012
 

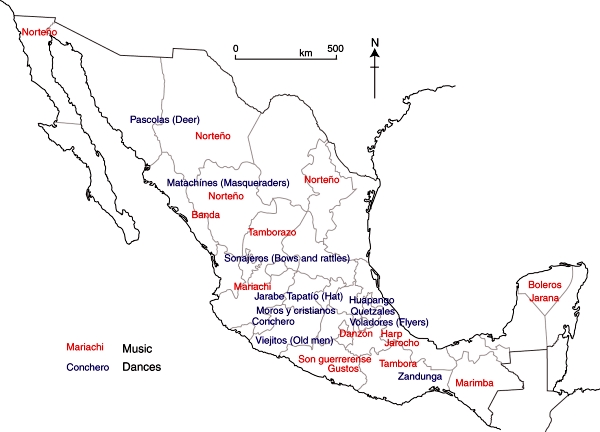
Numerous different regional music styles are found in Mexico (see map), some strongly influenced by indigenous instruments but most relying on the string and brass instruments brought by early Spanish settlers. Curiously, mariachi music, which is often considered Mexico’s national musical style, is believed to owe its origin to French immigrants and refer to wedding (mariage) music. Other popular music types include rancheras (country style songs), corridos (songs telling stories, often about heroes), norteño (northern), rock and pop.

Music and dance in Mexico.

Music and dance in Mexico. Fig 13.3 of Geo-Mexico, the geography and dynamics of modern Mexico. All rights reserved.

Musical instruments vary regionally as well. For instance, the marimba, a kind of wooden xylophone, is most often heard in Chiapas whereas the harp is more characteristic of Veracruz.

Regional dance styles have provided the stimulus for Mexico’s numerous baile folklórico (folkloric ballet) groups, many of which tour internationally. Some examples of regional dances are shown on the map.

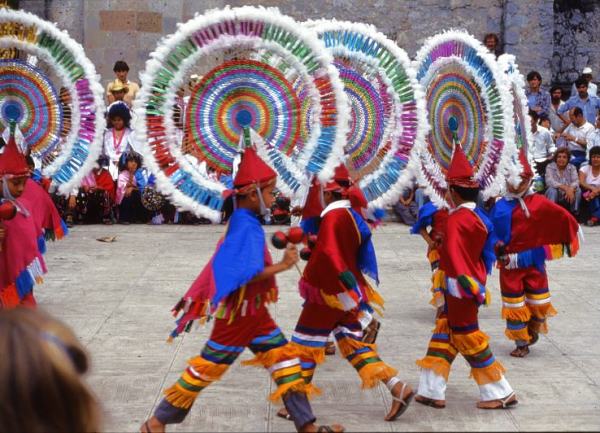
Dance of the Quetzals, Cuetzalan, Puebla.

Dance of the Quetzals, Cuetzalan, Puebla. Photo: Tony Burton; all rights reserved.

Some of these dances are very localized. For example, the Quetzal Dance, with its elaborate headdresses (see photo)  is performed almost exclusively in the village of Cuetzalan in the state of Puebla.

In addition to these cultural manifestations there are significant spatial variations among many other facets of culture, including sport, dress, architectural styles and handicrafts. Regional differences are also found in some forms of literature.

Related posts:

Why is biomass density in Mexico relevant to climate change?

 Maps, Other  Comments Off on Why is biomass density in Mexico relevant to climate change?
Apr 282012
 

How can we measure the health of forests and other forms of natural vegetation? It has become commonplace to read about biodiversity and many conservation programs rightly stress its importance in the global scheme of things. In a previous post, we examined the biodiversity of Mexico and saw how it is one of the most biodiverse countries in the world.

Biodiversity may be a useful indicator of likely ecological resilience in the face of changing circumstances such as global climate change, but it does not tell the whole picture. In simple biodiversity measures, each species is counted and treated as being equally important. Species close to extinction are singled out for conservation efforts in an attempt to preserve a viable wild population of that species. If all else fails, specimens are transferred to botanical gardens or seeds are collected and stored in the hope that the species can be reintroduced and reestablished in a suitable location at some point in the future.

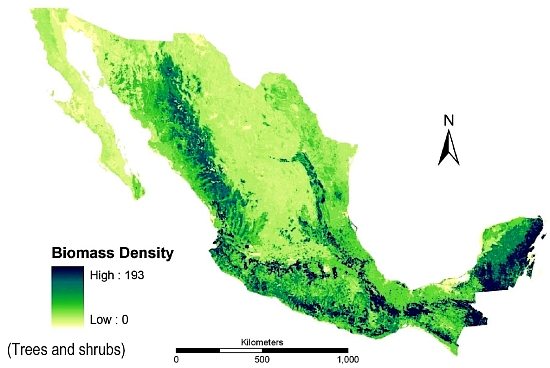
Biomass production in Mexico (Trees and bushes)

Biomass density in Mexico (trees and shrubs); from deJong et al, 2006.

But are all plant species equal? Should a giant redwood count the same as a dandelion? Certainly in terms of their ability to store carbon, larger plants are more valuable than smaller plants, though the total number of each species also matters. Storing carbon is important. When trees are cut down and burned (to clear the way for agriculture or settlement, for example) this stored carbon is released into the air and contributes to the processes causing global warming.

The term biomass is used to describe the total mass of living organic matter in a plant or in an area. The total biomass of a plant includes its bark, leaves and twigs. In a tropical forest, biomass includes every tree, shrub, sapling, vine, epiphyte and flower. About 50% of the biomass in most forests is carbon. The amount of biomass varies seasonally and is not necessarily stable over time, since plants increase their biomass as they grow. In a forest, the balance that matters in terms of sustainable forestry is the balance between the forest’s production of “new” biomass (through photosynthesis) and the consumption of some of its biomass by chopping, burning and natural decay. Clearly, human activity can directly impact this balance, but so too can natural events such as forest fires.

Bio-geographers have a great interest in assessing biomass since it provides a starting point for numerous models that attempt to estimate the effects of releasing some, or all, of this stored carbon on future global climates. Increasingly, their estimates from the use of remote sensing and satellite images are proving to be quite reliable when tested by comparing them to the biomass of the same area calculated from on-the-ground fieldwork.

The measure of biomass shown on the map is biomass density. Biomass density is the total amount of above ground living organic matter expressed as oven-dry metric tons per hectare. This map immediately reveals why conserving Mexico’s southern rainforests is so important. They are not only the most biodiverse areas of Mexico, their high biomass density values show that they also have far more than their fair share of Mexico’s total biomass. Conserving and managing these forests therefore needs to be a priority strategy in Mexico’s efforts to limit and mitigate climate change.

Sources:

The map comes from “Advances of Mexico in preparing for REDD” by Bernardus H.J. de Jong, Leonel Iglesias Gutiérrez and José Armando Alanís de la Rosa. Presentation given at the UNFCCC Workshop on Methodological Issues relating to Reducing Emissions from Deforestation and Forest Degradation in Developing Countries. Tokyo, Japan, 25 to 27 June 2008.

To read more about estimating biomass, see Estimating Biomass and Biomass Change of Tropical Forests: a Primer. (FAO Forestry Paper – 134) by Sandra Brown. FAO Forestry Paper 134. 1997.

Related posts:

Map of Oaxaca state, with an introduction to its geography

 Maps  Comments Off on Map of Oaxaca state, with an introduction to its geography
Mar 122012
 

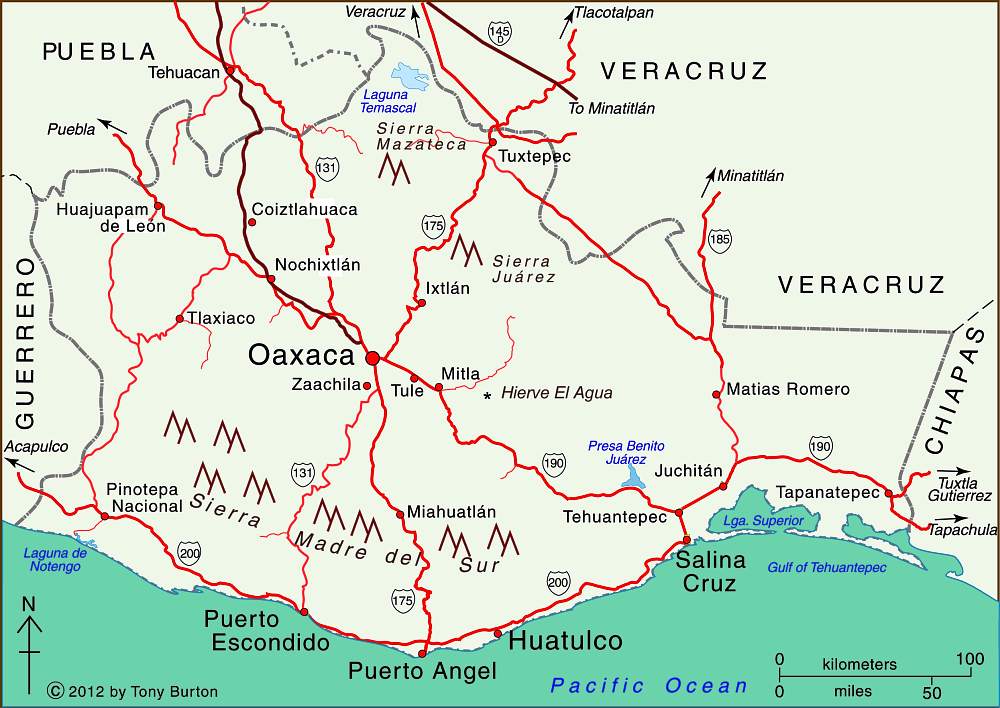
The state of Oaxaca is Mexico’s fifth largest state, with an area of  93,793 square kilometers (4.8% of the national total) and Mexico’s tenth most populous state, with 3.8 million inhabitants in 2010.

The state has considerable variety in terms of relief, climate and natural vegetation, and has about 570 km of shoreline bordering the Pacific Ocean. Oaxaca City, the centrally located state capital, is an important city for tourism as are three towns on the coast—Puerto Angel, Puerto Escondido and Huatulco.

The eastern part of Oaxaca state is part of the low-lying Isthmus of Tehuantepec, once considered as an alternative location to Panama for a trans-continental canal. In recent years, the Tehuantepec area has received massive investments in wind power, with several major wind farms already operational and more on the drawing board.

Map of Oaxaca state, Mexico. Copyright Tony Burton;

Map of Oaxaca state, Mexico. Copyright Tony Burton; all rights reserved. Click map to enlarge

Oaxaca state state has greater linguistic and cultural diversity than any other state in Mexico. According to the National Commission for the Development of Indigenous Peoples, more than 1.5 million people in Oaxaca live in a home where at least one of the residents either speaks an indigenous language or considers themselves indigenous (even if they do not speak an indigenous language).

About one million inhabitants of Oaxaca, 35% of the state’s total population, speak one or more indigenous language. The largest indigenous linguistic groups in the state include about 350,000 Zapotec, 230,000 Mixtec, 165,000 Mazatec, 100,000 Chinantec, 100,000 Mixe, and 40,000 Chatino.

Related posts:

Jan 092012
 

Mexico’s 2010 census found that 961,121 individuals living in Mexico had been born outside the country. In 2000 there were only about half as many (492,617). The 2010 figure is less than 1% of Mexico’s total population of 112 million. (Compare Canada where 21% are foreign-born and USA where 13% are foreign born). Of the total number of foreign-born residents in Mexico, 76.6% were born in the USA. Sadly, INEGI has not released any information relating to the country of birth of current residents who were born in countries other than the USA.

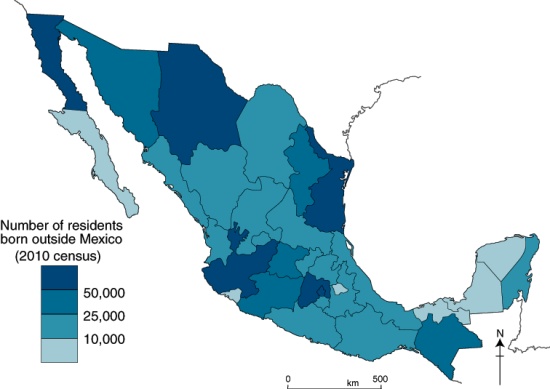
The map below shows the total number of foreign-born residents for each state.

Map of foreign-born residents of Mexico in 2010

Foreign-born residents of Mexico in 2010. Credit: Tony Burton/Geo-Mexico.

As can be seen on the map, the states with most foreigners are Baja California (about 123,000), Jalisco (84,000), Chihuahua (80,000), the Federal District (72,000) and Tamaulipas. The two states with fewest are Tlaxcala and Tabasco. (These are absolute numbers, and are heavily influenced by the relative size of each state).

Which states experienced the largest increases in foreigners between 2000 and 2010? The number of foreigners grew fastest in those states with relatively few foreigners in 2000, namely Hidalgo (up 402% over the decade), Tlaxcala (333%), Tabasco (281%), and Veracruz and Oaxaca (both with 272%).

Related posts:

Where in Mexico do people still lack access to potable water?

 Maps, Teaching ideas  Comments Off on Where in Mexico do people still lack access to potable water?
Nov 162010
 

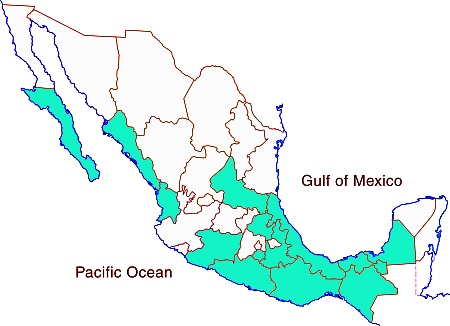
The map shows the 14 states in Mexico where less than 90% of the population has potable water in their homes.

map of potable water in Mexico

The 14 states with poorest potable water access in Mexico

How does the distribution of state with relatively poor access to potable water compare with maps of:

Development indices of various kinds are discussed in chapters 29 and 30 of Geo-Mexico: the geography and dynamics of modern Mexico. Ask your local library to purchase a copy today!

Which states in Mexico have the highest infant mortality rates?

 Maps, Other, Teaching ideas  Comments Off on Which states in Mexico have the highest infant mortality rates?
Nov 122010
 

Infant mortality is the number of deaths of infants (aged less than 1 year old) for every 1,000 live births. It is widely regarded as a very useful development indicator, and is one of the statistics used when calculating compound (multifactor) development indices. The Federal District has the lowest infant mortality rate in the county – 13.8, ahead of Nuevo León (14.0), Coahuila (14.8) and Baja California (14.9).

RankStateInfant mortality rate
22Michoacán20.0
23Campeche20.1
24Zacatecas20.3
25San Luis Potosí20.5
26Tabasco20.9
27Puebla20.9
28Hidalgo21.3
29Veracruz21.6
30Guerrero24.4
31Oaxaca24.6
32Chiapas25.3

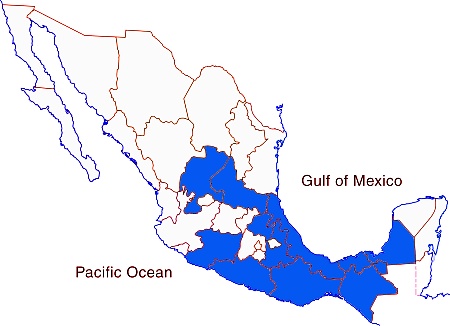
The table lists the 11 states in Mexico which have the highest rates of infant mortality. No other state has an infant mortality rate of 20.0 or higher. The map clearly reveals that these states are mostly in the south of Mexico, a long way from the USA border.

Map of infant mortality

The eleven states with the highest infant mortality rates

Compare this map with the map of GDP/person. Are there any states which appear to be anomalies to the general rule that GDP/person and infant mortality rates are inversely related?

Development indices of various kinds are discussed in chapters 29 and 30 of Geo-Mexico: the geography and dynamics of modern Mexico. Ask your local library to purchase a copy today!

Oct 042010
 

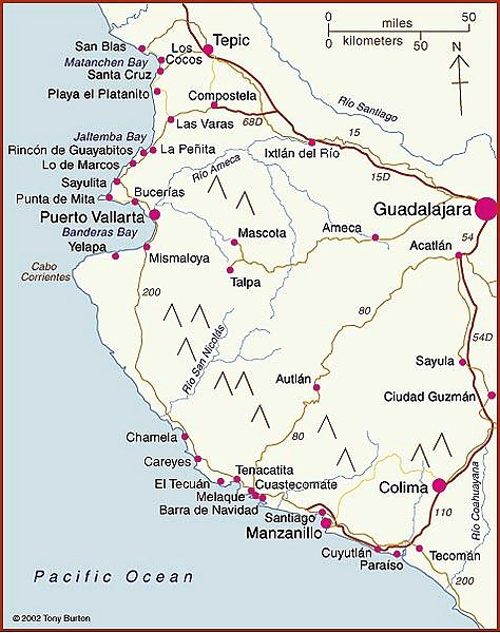
The map shows the coasts of the states of Colima, Jalisco and Nayarit. These states all have some great beaches, and tourism is an important activity in many of the towns shown on the map. Some of the beaches are so exposed that the Pacific Ocean waves arriving to smash into the sand offer outstanding surfing opportunities. Other beaches are more sheltered, with calmer waters perfect for swimming.

Map of Pacific Coast beaches. Copyright 2010 Tony Burton. All rights reserved.

Besides being important for tourism, Manzanillo is one of Mexico’s largest ports. One of the major reasons why the port of Manzanillo has attracted so much investment in recent decades is that it is easy to access via the major divided highway to/from Guadalajara and the interior of Mexico (and indeed, the US border).

Further north, San Blas was once an important port, but declined as silting blocked the shallow access routes. We described the historical geography of San Blas in a previous post:

Barra de Navidad also had great historical importance, as one of the shipbuilding ports where the Spanish built the ships which traversed the Pacific Ocean to the islands of the Philippines.

The coast around the headland of Punta de Mita used to be the site of rustic fishing villages, from where fisherman also took occasional groups of tourists out to sea whale-watching. This headland, and these villages became one of the best recent examples in Mexico of a forced migration:

In recent years tourism developments have caused more forced relocations than dam construction. One example is the Punta de Mita peninsula, 50 km (30 mi) north of Puerto Vallarta, developed in the 1990s. The existing residents, mostly fishermen, were forced from their homes on the coast so that their ejido lands could be converted into a luxury tourist resort and Jack Nicklaus-designed golf course.

The fishermen were moved from their breezy and somewhat ramshackle palapa huts, interspersed with palm trees, into ugly, concrete block houses a short distance inland, in the purpose-built small town of Emiliano Zapata, which adjoins a redeveloped coastal commercial/ restaurant strip called Anclote. Attempts by the developers to build the fishermen a small boat-building workshop and breakwater to protect the beach caused sand to be eroded from one of the only two remaining beaches with public access. During the resort’s construction an influx of workers from other parts of Mexico pushed prices up and led to social problems. (Geo-Mexico: the geography and dynamics of modern Mexico page 191)

More dramatic changes are now underway along part of this coastline. The area north of Sayulita (which has become a favored wintering location for Americans and Canadians) as far as the beach resort of Rincón de Guayabitos (favored by Mexican families) is slowly being transformed into Mexico’s latest purpose-built tourist resort, in the same way that other Mexican mega-resorts such as Cancún, Huatulco and Ixtapa were created.

Only time will tell what eventually happens to the areas that currently remain as genuine wilderness coast. One thing is sure – the more we develop this coastline, the more ecological damage will be done in the name of progress. Ecologically productive mangroves have been stripped out almost all along the coast, giving way to luxury hotels and marinas. Mangroves are now protected by federal law, but enforcement of this law may not be very effective.

Equally, fewer safe places now remain for the various endangered species of marine turtles who first visited these beaches a very long time before even the early Spanish mariners. One good sign is that active turtle protection programs exist at several of the beaches in this area. Ecological education is a good thing; ecological action is even better.

For more information about the geography of Mexico, buy your copy of Geo-Mexico: the geography and dynamics of modern Mexico today!

 Tagged with:

Map of the state of Quintana Roo, with Cancún, Cozumel and Tulum

 Maps  Comments Off on Map of the state of Quintana Roo, with Cancún, Cozumel and Tulum
Sep 272010
 

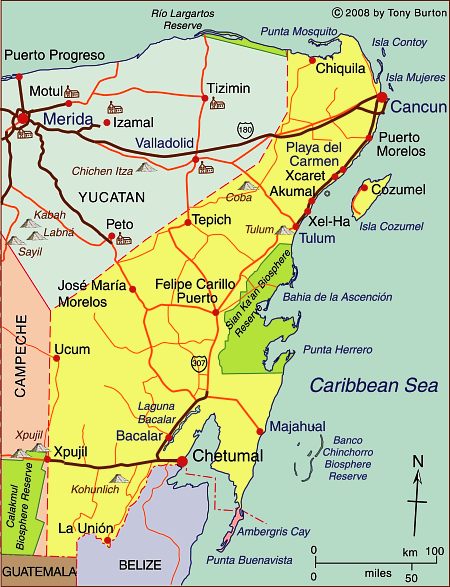
The state of Quintana Roo (see map below) has an area of 42,360 square kilometers and a population of 1,361,821 (2010 estimate). The state is one of Mexico’s flattest states, with its highest point being only 230 meters above sea level. Its distinctive landscapes include coastal barrier islands (such as the one Cancún’s hotel  zone is built on), magnificent coral reefs and tropical karst (limestone scenery). It also has tropical forests and mangrove swamps. The state’s capital city  is Chetumal (estimated 2010 population: 146,000), an important port and the gateway for overland connections to Guatemala. A short distance north of Chetumal is the beautiful, tranquil Laguna Bacalar.

Map of Quintana Roo. Copyright 2010 Tony Burton. All rights reserved.

Until the mid-20th century, the state was best known for its chicle (used for chewing gum) collectors and its Mayan ruins. Many of these have been restored in the past 50 years or so, and are now important tourist attractions. The best known sites are Tulum perched on a cliff overlooking the azure Caribbean sea (and unfortunately all too accessible for cruise ship passengers) and Cobá, a magnificent city only partially cleared of jungle. Ecotourism is an important sector of tourism in Quintana Roo. Critics notwithstanding, one of the most memorable eco-related sites in the entire country is Xcaret marine park. The biosphere reserve of Sian Ka’an in the middle part of the state also draws large numbers of  ecotourists.

The purpose-built resort of Cancún, begun in 1970, has grown into Mexico’s most important tourist resort. Easily reached by plane from most parts of the USA, Canada and Europe, it is one of the world’s major destinations for package holidays. The area south of Cancún is often referred to as the Mayan Riviera; it is one of Mexico’s most rapidly developing tourist areas.

Previous post related to Quintana Roo

Maps of neighboring states

Geo-Mexico: the geography and dynamics of modern Mexico looks at many aspects of Quintana Roo, including its socio-economic make-up and its development indicators. If you are interested in the geography of Mexico, please recommend this book to your local library or consider buying your own copy, as well as following this site with details of all new posts via  e-mail, Facebook or Twitter.

The route taken by Mexico’s first international scientific expedition, 1874-5

 Maps, Other  Comments Off on The route taken by Mexico’s first international scientific expedition, 1874-5
Sep 232010
 

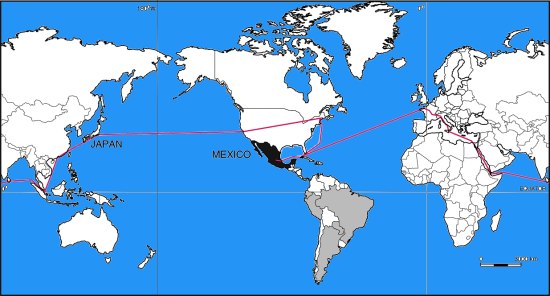
Mexico’s first international scientific expedition in 1874 left Mexico City with only a few months to travel half way around the world to Japan to set up their instruments in time for the transit of Venus on 9 December.

Mexico’s international scientific expedition to observe the 1874 transit of Venus

Looking at a map, the quickest route would appear to be via Acapulco and then by boat across the Pacific. However, in 1874, the “road” to Acapulco was often in appalling condition, especially after the rainy season, and boats crossing the Pacific from Acapulco were few and far between.

The Commission of Mexican Astronomers opted to travel via San Francisco, from where more vessels left regularly for the Far East. Getting from Mexico City to San Francisco in 1874 was nowhere as simple as it is today. For the first part of the trip, the intrepid group was able to take advantage of the Mexico City-Veracruz railway line, inaugurated only the previous year.

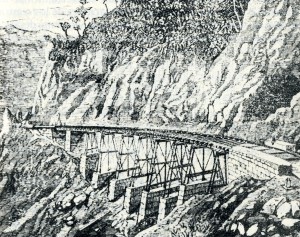
Rail bridge on Mexico City-Veracruz line

Infiernillo Bridge on the Mexicano Railroad (from Viaje de la Comisión Astronómica Mexicana al Japón)

This was an arduous and long trip in those days. Fortunately, the railway from Mexico City to Veracruz had just been completed. The expedition’s memoirs include a charming sketch of the Infiernillo railway bridge (see image).

Boats from Veracruz did not operate on a strict timetable either, and the group decided to wait in Orizaba for news of a suitable vessel rather than risk exposing themselves to the tropical diseases prevalent in the port itself. They had left Mexico City on 18 September and eventually set sail from Veracruz six days later—to Havana, Cuba. This was because vessels were much more frequent to the USA from Cuba than from Mexico.

Landing in Philadelphia on 30 September, the group was placed in temporary quarantine until diplomatic efforts succeeded in getting them released. A few days later, they caught a train to New York, and then the following day, to Chicago and on to San Francisco. Within a week, they had berths on board the Vasco de Gama to Japan.

Route taken by Mexico's first international scientific expedition, 1874-5

Route taken by Mexico’s first international scientific expedition, 1874-5. All rights reserved

Their route back home was via Hong Kong, Ceylon (now Sri Lanka), the Suez Canal, Italy and France (see map). By the time they arrived back in Mexico, they had completed a world tour, though it had taken somewhat longer than that of Jules Verne’s fictional tale Around the World in Eighty Days.

Source: Odisea 1874 o el primer viaje internacional de cientificos mexicanos by Marco Arturo Moreno Corral (Fonda de Cultural Economica,  1986)

The 10 least populous states in Mexico

 Maps, Teaching ideas  Comments Off on The 10 least populous states in Mexico
Aug 192010
 

The table shows the 10 states in Mexico which have the fewest inhabitants.

RankStatePopulation (2005)Population (2010 census)
1Baja California Sur512,170637,065
2Colima567,996650,129
3Campeche754,730822,001
4Nayarit949,6841,084,957
5Tlaxcala1,068,2071,169,825
6Aguascalientes1,065,4161,184,924
7Quintana Roo1,135,3091,324,257
8Zacatecas1,367,6921,490,550
9Durango1,509,1171,632,860
10Querétaro1,598,1391,827,985
Map of least populous states

The smallest states in Mexico (by population). Click to enlarge. All; rights reserved

(a) Can you suggest any characteristics which many of these small states might share? (not counting, obviously, their small population!)

(b) What implications might a relatively small population have for a state, and for its economy and administration?

(c) What geographic and historical factors might help to explain why some states have only a relatively small population?

(d) Which two states exchanged their rank positions between 2005 and 2010? Can you suggest why this might have occurred?

Several chapters of Geo-Mexico: the geography and dynamics of modern Mexico. discuss population issues, including population distribution and population density. Buy your copy today to have a handy reference guide to all major aspects of Mexico’s geography!

Fascinating new book about the Colorado River

 Books and resources, Excerpts from Geo-Mexico, Maps  Comments Off on Fascinating new book about the Colorado River
Aug 162010
 

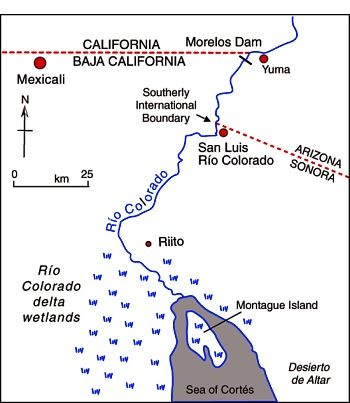
The Río Colorado formed a vast delta in the otherwise arid Sonoran desert in northern Mexico where it enters the Sea of Cortés (Gulf of California, see map.) The delta wetlands created ideal conditions for a rich variety of wildlife. The river enters Mexico at the Southerly International Boundary where a gauging station records the river’s discharge. This river is one of the most altered river systems in the world.

Map of the Colorado delta

Map of the River Colorado delta. All rights reserved.

The amount of water reaching Mexico has declined dramatically as a result of the Hoover and Glen Canyon dams and other diversions of Colorado River water in the USA. The few years of higher flows in the 1980s coincide with flood releases from US dams when they had been filled by heavy rains.

The river’s drastically reduced annual discharge violates a 1944 treaty under which the USA guaranteed that at least 1750 million cubic meters would enter Mexico each year via the Morelos diversionary dam in the Mexicali Valley. The Río Colorado wetlands have been reduced to about 5% of their original extent, and the potential water supply for the rapidly-growing urban centers of Mexicali, Tijuana, Tecate and Rosarito has been compromised.

The map and description above come from Geo-Mexico: the geography and dynamics of modern Mexico.

If you are interested in learning more about this river, a great place to start is the recently published book about the Colorado River called Running Dry: A Journey From Source to Sea Down the Colorado River (Jonathan Waterman; National Geographic Books, 2010). Waterman hiked and paddled the length of the river from the Rocky Mountain National Park to its delta in the state of Baja California, Mexico.

For excerpts from the book, see Running Dry on the Colorado and Mighty Colorado River dribbles through Mexico.

Peter McBride, a photographer, accompanied Waterman on his two year trek. His evocative photographs will appear in the book The Colorado River: Flowing Through Conflict (Westcliffe Publishers), due out in September. See Down the Colorado (slideshow) for some examples of his Colorado River photos.

Rivers, reservoirs and water-related issues are discussed in chapters 6 and 7 of Geo-Mexico: the geography and dynamics of modern Mexico. Ask your library to buy a copy of this handy reference guide to all aspects of Mexico’s geography today! Better yet, order your own copy…

Geo-Mexico is reader-supported. Purchases made via links on our site may, at no cost to you, earn us an affiliate commission. Learn more.

The 11 states in Mexico with the oldest population

 Maps, Teaching ideas  Comments Off on The 11 states in Mexico with the oldest population
Aug 142010
 

The table shows the eleven states in Mexico which have the oldest population (defined by average age of the population).

RankStateAverage age (years)
1Federal District30.0
2Veracruz28.4
3=Nayarit28.0
3=Nueva León28.0
5Yucatán27.6
6=Zacatecas27.4
6=Colima27.4
6=Hidalgo27.4
6=Morelos27.4
6=Sonora27.4
6=Tamaulipas27.4
Map of states with the oldest population

States with the oldest population. Click to enlarge. All rights reserved.

(a) What factors might explain why the inhabitants of some states in Mexico have a high average age than others? What might these 11 states have in common?

Hint: Do not just think about why some states might have many elderly people, but also why some states might have relatively few young children

You might also like to compare this map with a map of the states which have the youngest average age.

Several chapters of Geo-Mexico: the geography and dynamics of modern Mexico. discuss population issues, including the age of the population. Buy your copy today to have a handy reference guide to all major aspects of Mexico’s geography!

Aug 062010
 

The rapid spatial expansion of Mexico City is not slowing down in the 21st century but accelerating. The main stimulus of this sprawl is income growth, which leads to widespread ownership of private automobiles and the desire of Mexican families to own homes. The number of automobiles in Metropolitan Mexico City (ZMCM) is approaching 10 million, almost double the number in 2000. Most households have access to a private car, many have several cars. Automobiles are responsible for nearly half of all trips. While the 2008–2009 economic downturn dramatically reduced new car purchases, the market has picked up significantly in 2010.

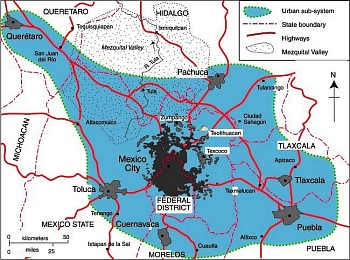
Map of Mexico City urban system

Map of Mexico City urban system. Click to enlarge. All rights reserved.

New suburban residential developments for all income levels now stretch up to 40 km from the Zócalo (the main plaza in Mexico City’s center).  Some developers sell undeveloped lots; others build family homes. Most of these new developments are in gated communities and are focused on car-owning buyers.

A case can be made that Mexico City is beginning to merge with surrounding urban areas (see map) into a “super city” or megalopolis, with a total population of about 30 million.

The eastern border of the Toluca Metropolitan Area (population 1.6 million) is the Federal District. The Cuernavaca urban area (population 788,000) is only about 20 minutes south by toll road. The western edge of Metropolitan Puebla-Tlaxcala (population 2.1 million) is only about 30 minutes from the eastern edge of Greater Mexico City. Pachuca (population 278,000) is only about 30 minutes north.

A megalopolis is one possible future scenario for Mexico City.

If you have enjoyed this brief excerpt from chapter 23 of Geo-Mexico: the geography and dynamics of modern Mexico please consider purchasing your own copy of the book. Chapters 21 and 22 analyze Mexico’s 500-year transition to an urban society and the internal geography of Mexico’s cities. Chapter 23 looks at urban issues, problems and trends. To preview more parts of the book, click here and use amazon.com’s “Look Inside” feature.

The 11 states in Mexico with the youngest population

 Maps, Teaching ideas  Comments Off on The 11 states in Mexico with the youngest population
Aug 052010
 

The table and map show the eleven states in Mexico which have the youngest population (defined by average age of the population).

RankStateAverage age (years)
1Quintana Roo22.3
2Chiapas24.2
3Baja California24.9
4Querétaro25.7
5=State of México25.9
5=Aguascalientes25.9
7=Guerrero26.0
7=Baja California Sur26.0
9=Tabasco26.3
9=Puebla26.3
9=Chihuahua26.3
The states with the youngest average age

The states with the youngest average age. Click to enlarge. All rights reserved.

This map does not appear to reveal any obvious spatial pattern. What do these 11 states have in common, apart from (presumably) a high percentage of young people?

(a) Can you suggest what circumstances (or combination of circumstances) might result in a state having a relatively young population?

(b) Find a table or map showing the birth rates in each state. Is there any similarity between that information and this map of states with the youngest population?

(c) Find a table or map showing which states have experienced the fastest rates of in-migration because their economies have grown rapidly in the past 30 or 40 years. Is there any similarity between that information and this map of states with the youngest population?

Several chapters of Geo-Mexico: the geography and dynamics of modern Mexico. discuss population issues, including the age of the population. Buy your copy today to have a handy reference guide to all major aspects of Mexico’s geography!

The 10 warmest states in Mexico

 Maps, Teaching ideas  Comments Off on The 10 warmest states in Mexico
Jul 292010
 

The table shows the ten warmest states in Mexico, defined by their average annual temperature.

RankStateAverage annual temperature (degrees C)
1Tabasco26.4
2Yucatán25.9
3=Campeche25.8
3=Quintana Roo25.8
5Colima25.3
6Guerrero24.9
7=Chiapas24.1
7=Nayarit24.1
9Sinaloa24.0
10Veracruz23.7
Map of the warmest states in Mexico

The warmest states in Mexico. Click to enlarge. All rights reserved.

In both Canada and the USA, average temperatures tend to depend largely on latitude, ie. they increase towards the south of the country. This is clearly only partially the case in Mexico.

(a) What factors apart from latitude influence the average temperatures in Mexico’s states? Try to find evidence that either supports (or refutes) your ideas.

(b) Is there any connection between average temperature and precipitation amounts? Compare this map of states which are relatively warm with the states which have

(c) If you do not already know, can you guess where the coolest states in Mexico will be? Check here to find out if you are right!

Mexico’s diverse climates are the subject of chapter 4 of Geo-Mexico: the geography and dynamics of modern Mexico. Climate-related hazards are analyzed in chapters 6 and 7. Buy your copy today!

The 10 coolest states in Mexico

 Maps, Teaching ideas  Comments Off on The 10 coolest states in Mexico
Jul 262010
 

The table shows the ten coolest states in Mexico, defined by their average annual temperature.

RankStateAverage annual temperature (degrees C)
1Tlaxcala14.1
2=Estado de México15.2
2=Federal District15.2
4Chihuahua16.6
5=Zacatecas17.2
5=Aguascalientes17.2
7Hidalgo17.4
8Durango17.7
9Guanajuato17.9
10Baja California18.5
Map of the coolest states in Mexico

The coolest states in Mexico. Click to enlarge. All rights reserved.

In both Canada and the USA, average temperatures tend to depend largely on latitude, ie. they decrease towards the north of the country. This is clearly not the case in Mexico.

(a) What factors apart from latitude influence the average temperatures in Mexico’s states? Try to find evidence that either supports (or refutes) your ideas.

(b) Is there any connection between average temperature and precipitation amounts? Compare this map of states which are relatively cool with the states which have

(c) Can you guess where the warmest states in Mexico will be? To find out if you are right, you can find an atlas or on-line map showing average temperatures in Mexico, or keep reading the Geo-Mexico blog each day until we include our own map showing the warmest states!

Mexico’s diverse climates are the subject of chapter 4 of Geo-Mexico: the geography and dynamics of modern Mexico. Climate-related hazards are analyzed in chapters 6 and 7. Buy your copy today!