The impacts of the US border wall with Mexico

 Books and resources, Teaching ideas  Comments Off on The impacts of the US border wall with Mexico
Jan 162021
 
Judy King cover

This Guardian article – ‘My neighbourhood is being destroyed to pacify his supporters’: the race to complete Trump’s wall – highlights the problems created (not solved) by US efforts to build a wall along its southern border.

Geo-Mexico is reader-supported. Purchases made via links on our site may, at no cost to you, earn us an affiliate commission. Learn more.

Judy King coverFor what it’s worth, here is my own take on the wall, written a few years ago as a short chapter for Judy King’s book, Echoes from the Wall: Real Stories of Mexican Migrants (Mexico Insights, 2019). The majority of King’s book is based on her one-on-one interviews with a varied and fascinating selection of Mexican migrants who at one time or another lived and/or worked in the US. King’s personal, in-depth approach was time consuming but was amply rewarded and she acquired some extraordinary individual accounts. The book also includes short “backgrounders” on the history of Mexican-US migration and the practicalities involved.

My chapter focused on the geography related to the wall building.

The Border Story: the effects of a barrier wall (written in 2018)

The U.S.-Mexico border is unique in terms of its geography. It is the longest land border in the world between a developed economy and an emerging economy. The continental U.S.-Mexico border (excluding offshore limits) is about 1990 miles (3200 km) long. At roughly the mid-point, the cities of El Paso and Ciudad Juárez face each other across the boundary line. East of these cities, the border follows the course of the Río Grande (Río Bravo as it is known to Mexicans) to the Gulf of Mexico; west of these cities, it crosses the Sonoran desert to reach the Pacific Ocean between San Diego and Tijuana.

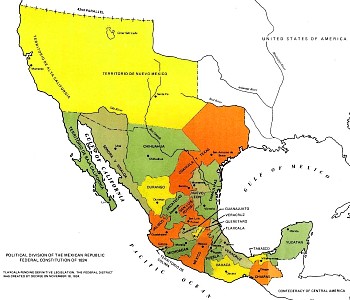
Map of Mexico, 1824

Map of Mexico, 1824

This boundary was established in the middle of the 19th century. After the Mexican‑American War (1846‑1848) the 1848 Treaty of Guadalupe Hidalgo ceded over half of Mexico’s territory to the USA. A few years later, under the 1853 Gadsden Purchase (Treaty of La Mesilla), northern portions of Sonora and Chihuahua were also transferred to the USA. This more or less established the current border between the two countries.

Minor disputes have occurred since due to the constantly migrating meanders of the Río Grande/Bravo. Flooding during the early 1860s moved the river channel south, shifting an area of about 2.6 square kilometers (1 square mile) from Ciudad Juárez in Mexico to El Paso in the U.S. Both countries claimed the area, giving rise to the El Chamizal dispute. This dispute went to international arbitration in 1911 and was only finally resolved in 1963 with the ratification of the Chamizal Treaty by President John F. Kennedy and his Mexican counterpart, Adolfo López Mateos.

A permanent memorial to Chamizal was established in El Paso in 1966 to commemorate the two nations’ laudable international cooperation, diplomacy and respect for cultural values in arriving at a mutually acceptable resolution to the conflict. A later dispute about changes in river meanders – the Ojinaga Cut – was amicably resolved in 1970.

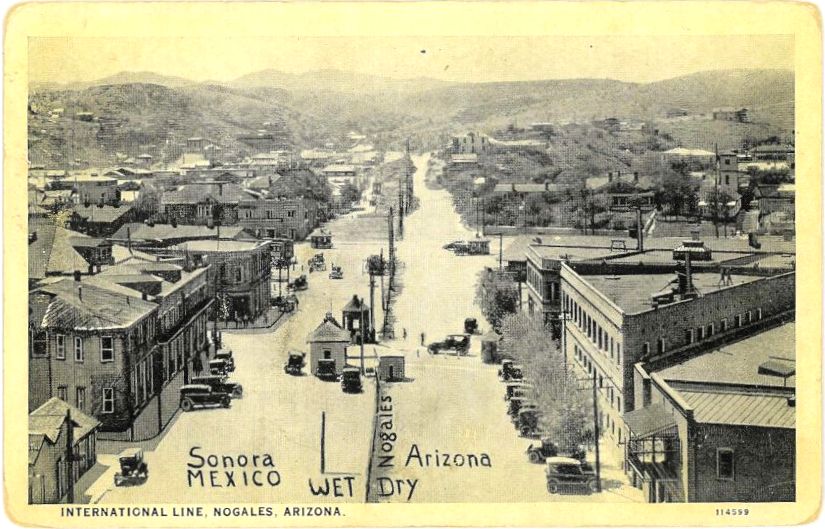
There are about fifty places where people can legally cross the U.S.-Mexico States border but only one where the cities on either side of the border have the same name: Nogales. Historically, straddling the international border was not a drawback to residents of the “Two Nogales” (Ambos Nogales).

Postcard of Ambos Nogales, ca 1915

Postcard of Ambos Nogales, ca 1915

A century ago, one street in Nogales – International Avenue – actually ran east‑west along the border, with one side of the street in the U.S. and the other in Mexico. Even before a boundary fence was erected down the middle, residents were apparently still required to cross at one of two entry points: either the Morley Avenue crossing or the Grand Avenue crossing. The 60-foot-wide avenue had been created in 1897 after all buildings close to the border were razed to the ground as a way of limiting customs fraud. A permanent border fence was built in 1918 following the Battle of Ambos Nogales (La batalla del 27 de agosto).

During the prohibition years (1919-34) in the U.S., Mexican cities close to the border benefited from an influx of free-spending visitors. These years were boom times for the bars, casinos, brothels and race tracks of cities such as Ciudad Juárez and Tijuana. These cities also did well during World War II, when many of the large number of U.S. military personnel stationed near the border were able to circumvent wartime rationing at home by hopping south.

Beginning in the mid-1990s, physical barriers (fences, walls) were erected along some sections of the border to try and stem the flow of migrants from Mexico. Other sectors are closely monitored via electronic sensors, drones, cameras and mobile and satellite surveillance systems. In total, about 30% of the border already has some form of barrier, physical or virtual.

Existing barriers have already made life very difficult in many places. For example, it used to be a ten minute walk for residents of Ejido Jacume in Baja California to cross the border into Jacumba Hot Springs, California, to go to school, work, shop or attend the health clinic. With the barrier, it is now a two hour drive via Tecate.

Most of the physical barriers already built are along the western half of the border (where California, Arizona and New Mexico meet Baja California, Sonora and Chihuahua), They aim to prevent undocumented crossings into the major cities, especially San Diego and El Paso. They have forced would-be migrants to take on crossing the border somewhere in the largely unpopulated Sonoran Desert west of Nogales. The arduousness of this trip has cost the lives of many, many migrants, with the number of deaths of border-crossers since 2004, in this section alone, averaging more than 200 a year.

One of the many ironies associated with demands to build more and higher barriers between the two countries, given their extremely close social and economic ties, is that there is a simultaneous demand (in other quarters) to ease the movement of people and goods across the border in order to boost tourism and facilitate trade. For instance, in December 2015, a 120-million-dollar pedestrian bridge, known as The Cross Border Xpress (CBX), opened to allow passengers living in California to walk across the border into Tijuana International Airport. This helped ease border congestion at the existing land crossings into Tijuana.

Similarly, U.S. and Mexican border officials have piloted joint customs inspection procedures to cut border-crossing times for freight by up to 80%. Trade between the two countries is worth 1.4 billion dollars a day. The first tests of the new joint system were at Laredo international airport in Texas (for vehicle, electronic and aerospace components being flown to eight cities in Mexico), the Mesa de Otay in Baja California (for Mexican farm products entering the U.S.) and San Jerónimo in Chihuahua (for computers and other electronic exports from Mexico). The project has been warmly welcomed by business representatives on both sides of the border.

Finding the right location to build any barrier/wall may prove harder than many would anticipate. While most existing sections of barriers along the western half of the border are located very close to the true boundary line, this is not possible east of El Paso where the boundary runs (theoretically) down the deepest channel of the Río Grande/Río Bravo. Here, a wall or barrier along the boundary is impracticable.

Several protected National Wildlife Refuge (NWR) areas sit on or astride the boundary. They include the Lower Rio Grande Valley NWR and the Santa Ana NWR in Texas, the the Tijuana Slough NWR in California, and the Cabeza Prieta NWR in Arizona (the 3rd largest national wildlife refuge in the lower 48 states) which is contiguous to the UNESCO-designated World Heritage site of El Pinacate y Gran Desierto de Altar Biosphere Reserve in Sonora. In west Texas, Big Bend National Park extends to the border where it meets the Cañon de Santa Elena National Park in Chihuahua.

Ecologists have grave concerns about animal migration corridors and the future of numerous trans-border species. Up to now, only rudimentary and superficial Environmental Stewardship Plans (ESPs) have been prepared for the border areas where barriers have been constructed. These ESPs almost invariably claim that any adverse impacts on plant and animal populations will be only short-term, even in the absence of any scientific studies assessing existing populations.

Barriers such as walls prevent some species from crossing the border and can separate existing cross-border populations into two distinct groups, reducing their viability and increasing the risks of in-breeding, reducing their resilience to changes in climate or food sources. One major study identified 93 currently endangered species likely to be affected by a wall, including jaguars, ocelots, Mexican gray wolves and Quino checkerspot butterflies. Black bears in Texas that currently migrate across the border annually will have their natural territory sliced in half, as will the pronghorn antelope herds further west. Several species, including the jaguar, arroyo toad, the cactus ferruginous pygmy owl (which flies close to the ground) and Peninsular bighorn sheep, have critical habitats either side of the border.

People, too, have cross-border territories. Spare a thought for Native American groups such as the Tohono O’odham people whose ancestral lands now lie on either side of the Arizona-Sonora border. Their divided territory originated in 1853 with the Gadsden Purchase. Most of the estimated 25,000 Tohono O’odham alive today reside in Arizona but about 1500 live in northern Sonora. For decades, the two groups of Tohono O’odham, never granted dual citizenship, kept in regular contact for work, religious ceremonies and festivals, crossing the border as needed without any problem. Stricter border controls have made this impossible today.

Repeated efforts to solve the “one people‑two country” problem by granting U.S. citizenship to all registered members of the Tohono O’odham, regardless of their residence, have so far not succeeded. Ironically, because of its relatively remote location, the Tohono O’odham Nation has often been called upon to provide emergency assistance to undocumented workers (and drug traffickers) attempting to cross the border who have underestimated the severe challenges of crossing this section of the harsh Sonora desert.

Land ownership along any wall-building line is another issue. Building it on federal land is relatively easy, especially if the U.S. administration continues to utilize mechanisms that ignore, or they claim trump, dozens of existing environmental and cultural laws. Costs and protests rise where the planned barrier is located on privately-owned land.

Some sections of barrier have already been built in the wrong place. In 2008, for instance, one Native American human rights delegation reported that the official International Boundary obelisks marking the Arizona/Sonora boundary had been moved about 20 meters south during barrier construction, a clear violation of international law. Costs escalate still further whenever the barrier needs to be relocated.

The effective implementation of many cross-border agreements will be adversely affected by a barrier. For instance, the U.S. Forest Service and Mexico’s National Forestry Commission have a co-operation agreement, the Bi‑national Convention on Forest Fires, for dealing with cross-border wildfires on the Arizona/Sonora border. It aims to increase public safety on both sides of the border, reduce habitat loss, and facilitate the fighting of wildfires. It allows for a united bi‑national command to be established and for firefighting brigades, together with supporting vehicles and aircraft, to cross the border by up to 16 km (10 miles) in either direction in order to battle ongoing wildfires, provided advance notice is given. With a wall, this is clearly impossible.

Quite apart from the cost implications and the potential adverse impacts for people, communities, trade and fauna in the border regions, building a wall is not the answer. Animals may not have a viable choice after a wall is built but if people still want to cross, and can’t do so by land, they will surely turn to the air, the oceans, or (as has already happened repeatedly with smugglers in both directions) underground tunnels.

In fact, despite fear-mongering news reports in the U.S. press, the flow of migrants over the past decade has actually reversed: the number of people now crossing the border from the U.S. to live in Mexico is higher than the number of Mexicans moving north. While some of the migrants moving south are Mexicans returning home, others are estadoudienses preferring to retire, live or work in Mexico.

Judy King’s Echoes from the Wall: Real Stories of Mexican Migrants (Mexico Insights, 2019) is available worldwide via Amazon. The case studies of individual migrants are excellent starting-points for geography classes about international migration in high schools and colleges.
Mexico’s vehicle industry

 Teaching ideas, Updates to Geo-Mexico  Comments Off on Mexico’s vehicle industry
Dec 272014
 

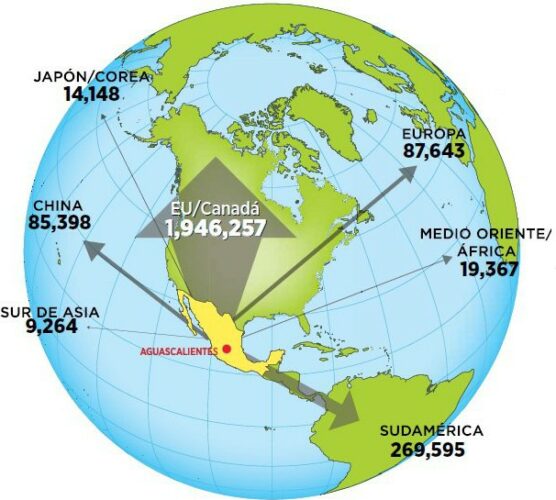
Mexico is one of the world’s “Top Ten” countries for vehicle production and for vehicle exports. In 2014, it has overtaken Brazil to become the world’s 7th largest vehicle producer and fourth largest exporter. 80% of Mexico’s production of around 3.3 million vehicles in 2014 were made for export. The trade surplus generated by the automotive sector exceeded 47 billion dollars in 2014.

auto-exports-forbes

Mexico’s vehicle exports in 2014. Credit: Forbes, México.

The industry attracts large amounts of Foreign Direct Investment (FDI). Vehicle assembly plants provide around 65,000 jobs, with a further 85,000 employed in distributorships nationwide and a whopping 450,000 employed in the autoparts sector.

The autoparts sector along produces items worth $80 billion/year, but Mexico also has to import components made elsewhere worth a further $35 billion. Clearly, this offers some opportunities for additional investment aimed at import substitution. Most of the opportunities are likely to be for Tier 2 companies. It is customary to divide the autoparts sector into three distinct parts: OEM, Tier 1 and Tier 2. OEM (Original equipment manufacturer) refers to companies that make a final product for the consumer marketplace (eg Volkswagen). Tier 1 companies are direct suppliers of components to OEMs, and Tier 2 companies are the key suppliers of parts or raw materials to Tier 1 suppliers.

Total production in 2014 topped the 3 million barrier, and the Mexican Automotive Industry Association (AMIA) believes production could reach 4 million units by 2015 and 5 million by 2020.According to  AMIA, the best selling models on the domestic market are the Aveo (GM), Jetta (VW), Versa and Tsuru (both Nissan).

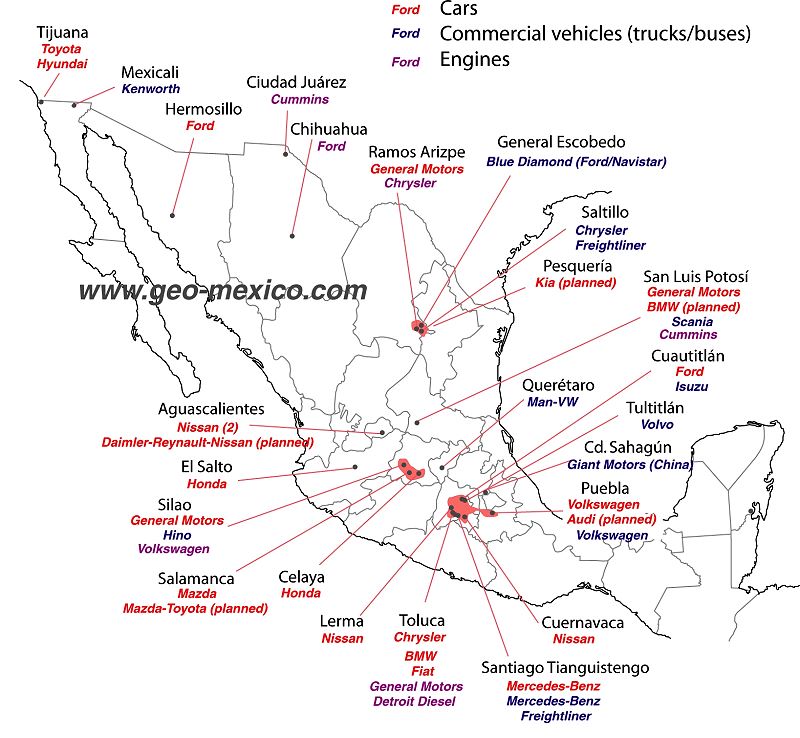
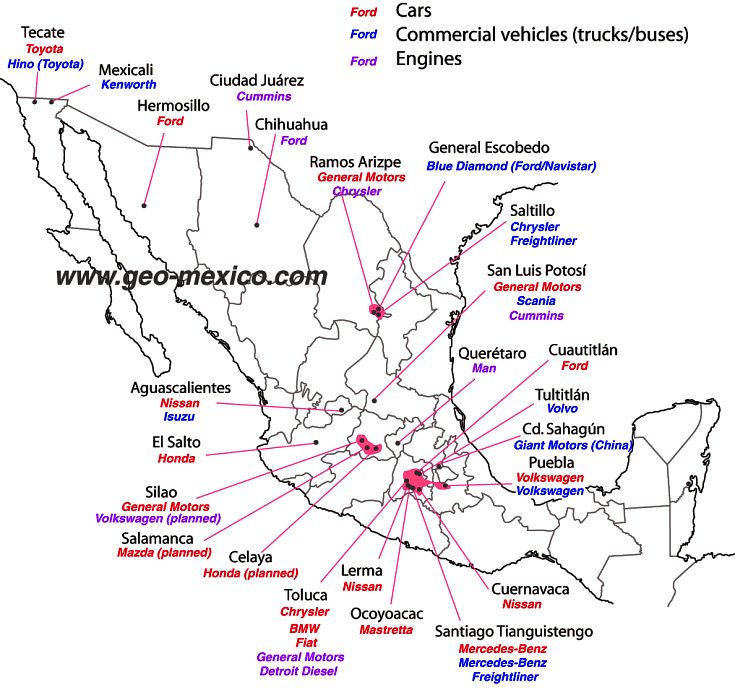
There are about 30 vehicle assembly plants in Mexico, manufacturing many brands of cars and trucks (see map). In addition, there are 1200 firms specializing in making parts for vehicles.

Vehicle manufacturing firms that have announced or confirmed major new investments during 2014 include:

  • Chrysler – 1.25 billion dollars to expand its assembly plant in Saltillo and manufacture a new line of Tigershark engines.
  • Nissan – to open its second plant in Aguascalientes.
  • Mazda – an additional 120 million dollars for its plant in Salamanca (Guanajuato), where it will manufacture several Mazda models as well as one Toyota model.
  • GM – investments worth 690 million dollars, divided  between its plants in Silao (Guanajuato), San Luis Potosí and Toluca (State of México).
  • Audi – about to open a 1.3-billion-dollar plant in San Jose Chiapa, near Puebla.
  • VW – 700 million dollars investment to adapt production lines in Puebla to produce its redesigned Golf hatchback.
  • Kia – plans to build a $1 billion vehicle assembly plant at Pesquería in the state of Nuevo Leon (scheduled to open in 2016) to produce up to 300,000 vehicles a year. The new plant is expected to generate a further 1.5 billion dollars in investment from firms seeking to join Kia’s supply chain.

This map is an updated version of the map we included in Where are Mexico’s vehicle assembly plants located? (2011).

Vehicle assembly plants in Mexico, 2014

Vehicle assembly plants in Mexico, 2014. Credit: Tony Burton/Geo-Mexico; all rights reserved.

As the map shows, certain areas of Mexico have attracted more investment in vehicle assembly plants than other areas. The two largest existing concentrations are focused on Toluca in the State of México, and on Saltillo-Ramos Arizpe in northern Mexico. However, the fastest growing cluster is in the central state of Guanajuato.

Virtual visit to the Chrysler plant in Saltillo (video, no commentary):

For a series of discussion questions related to this map and the vehicle assembly industry, see our earlier post – Where are Mexico’s vehicle assembly plants located?

Related posts:

Dec 082014
 

Every so often, a news article comes along which rattles our perceptions, causes us to think, and begs us to discuss big issues. This is one of those times.

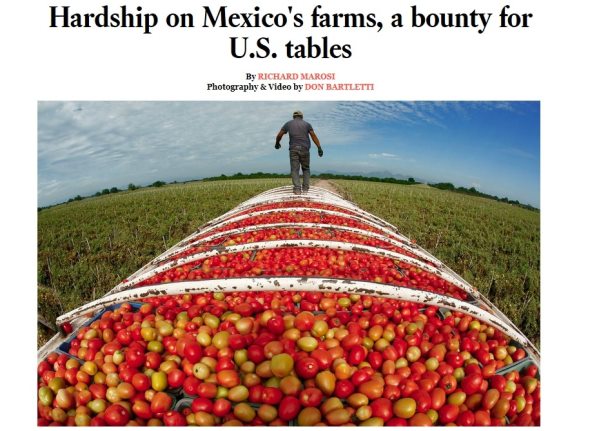
Los Angeles Times reporter Richard Marosi and photojournalist Don Bartletti traveled across nine Mexican states, observing conditions and interviewing workers at some of the mega-farms that have powered the country’s agricultural export boom.

The resulting article, the first of a four-part series, was published yesterday in the Los Angeles Times, and offers lots of potential for serious discussions in geography classes around the world about agribusiness practices, supply chains, the persistence of inequalities, and a host of other issues. The article is accompanied by some great photographs and short, informative videos.

la-times-article

In “Hardship on Mexico’s farms, a bounty for U.S. tables“, Marosi and Bartletti find that thousands of laborers at Mexico’s mega-farms endure harsh conditions and exploitation while supplying produce for American consumers.

This is a must-read series for anyone interested in the Geography of Mexico, and we can’t wait to see the next three parts of this series.

Related posts:

Oct 232014
 

The online Atlas of Economic Complexity is now interactive, allowing users to choose and combine a large number of variables related to imports, exports, date and country. In the webpage’s own words, it is “a powerful interactive tool that enables users to visualize a country’s total trade, track how these dynamics change over time and explore growth opportunities for more than a hundred countries worldwide.”

What is economic complexity?

A country with a high Economic Complexity has a wide range of complex knowledge capabilities related to productive enterprises. Its economy is likely to produce sophisticated products that require a very wide and diverse set of knowledge capabilities. For example, relatively few countries have the capabilities to produce highly complex chemicals or pharmaceuticals, since their production requires very specialized equipment and very precise measuring instruments. Equally, very few countries have nuclear power stations or space stations, since they lack the range of knowledge capabilities needed to build them. At the other end, a very large number of countries have far less complex economies that are capable of producing simple products (basic foods, mineral ores, lumber, garments, shoes, glass, kitchen utensils, furniture) but not products involving more complicated processes or technology

We first discussed the Atlas in 2012 in How “complex” is the Mexican economy?, when we noted that the Atlas ranked Mexico’s Economic Complexity Index (ECI) as #20 of the 128 countries studied. The interactive nature of the online Atlas has added the opportunity to explore many more trends in trade, generating a range of related, visually-appealing infographics.

In particular, choosing Mexico as the country, the Atlas can answer questions such as:

  • What does Mexico import and export?
  • How has Mexico’s trade evolved over time?
  • What are the drivers of Mexico’s export growth?
  • Which new industries are likely to emerge in Mexico? Which are likely to disappear?
  • What are the GDP growth prospects of Mexico over the next 5-10 years, based on its productive capabilities?

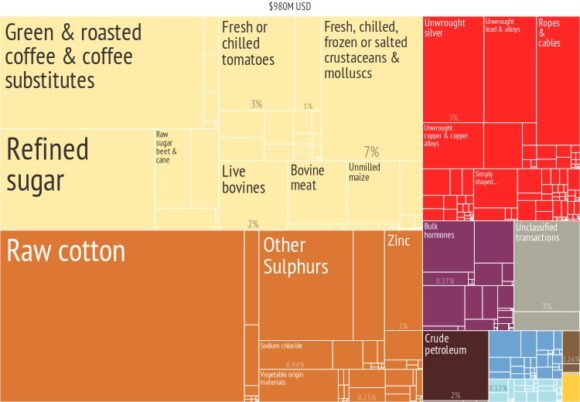
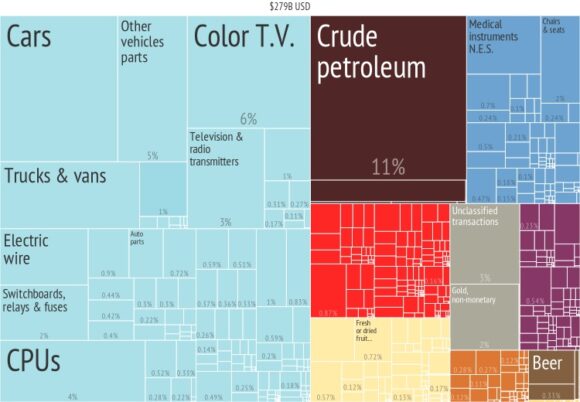
Playing with the variables and dates in the Atlas is a really interesting way to explore just how Mexico’s exports and imports have changed over the years. For example, compare these infographics for Mexico’s exports in 1964 and 2010 respectively:

What_did_Mexico_export_in_1964_

Mexico’s exports in 1964

Mexico's exports in 2010

Mexico’s exports in 2010

It is sometimes hard to imagine just how much Mexico has changed in the past fifty years! Overall, at rank #20, Mexico turns out to have an unusually high Economic Complexity Index given its income level. (All the other countries in the top 20 have significantly higher incomes than Mexico).

According to the Atlas, during the rest of this decade Mexico’s GDP should grow relatively rapidly, bringing its GDP rank more in line with its Economic Complexity Index. In general, analyses in the Atlas indicate that during the last few decades countries with higher than expected ECIs compared to their income levels experience more rapid economic growth.

Note, though, that while this relationship is empirically true, it does not explicitly include other factors thought to be important to economic growth such as governance and institutional quality, corruption, political stability, measures of human capital and competitiveness indicators.

Related posts

Mexico is a major net importer of “virtual” water

 Books and resources, Teaching ideas  Comments Off on Mexico is a major net importer of “virtual” water
Oct 132014
 

The concept of “virtual water” was developed by Professor J.A. Allan of King’s College (London University) and the School of Oriental and African Studies. Allan used it to support his argument that Middle Eastern countries could save their scarce water resources by relying more on food imports. The idea was sufficiently novel for Allan to be awarded the 2008 Stockholm Water Prize.

In Allan’s words, “The water is said to be virtual because once the wheat is grown, the real water used to grow it is no longer actually contained in the wheat. The concept of virtual water helps us realize how much water is needed to produce different goods and services. In semi-arid and arid areas, knowing the virtual water value of a good or service can be useful towards determining how best to use the scarce water available.”

As one example, producing a single kilogram of wheat requires (on average) around 1.5 cubic meters of water, with the precise volume depending on climatic conditions and farming techniques. The amount of water required to grow or make a product is known as the “water footprint” of the product.

Hoekstra and Chapagain have defined the virtual-water content of a product, commodity, good or service, as “the volume of freshwater used to produce the product, measured at the place where the product was actually produced”. The virtual water content is the sum of the water used in the various steps of the production chain.

Additional examples, showing the water footprint of producing one kilogram of:

  • biodiesel from soya –  11.4 cubic meters
  • beef –  15.4 cubic meters
  • butter –  5.5 cubic meters
  • chocolate – 17.0 cubic meters
  • pasta –  1.85 cubic meters
  • sugar (from cane) –  0.2 cubic meters

While the idea of virtual water has attracted some attention, its methodology is contested, and its quantification is not yet sufficiently precise to offer much potential for policy decisions.

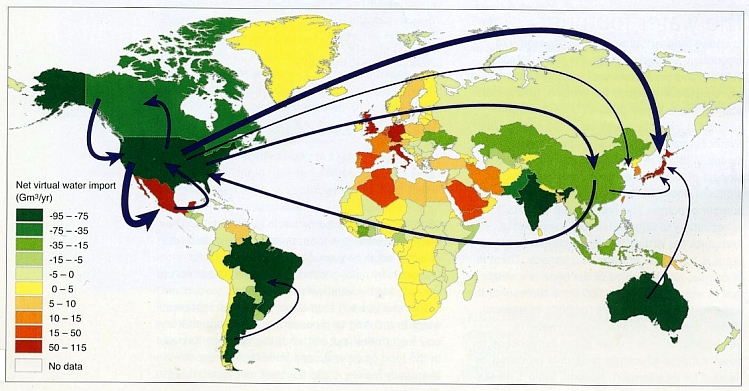
Imports and exports of virtual water represent the “hidden” flows of water involved when food and other commodities are traded from one place to another. The map below (from Hoekstra and Mekonnen, 2012) shows the net imports (imports minus exports) of virtual water for different countries for the decade 1996-2005. Note that only the major flows are shown.

water-virtual-tradeIn North America, both the USA and Canada have a significant positive virtual water balance (i.e. they are major exporters of virtual water), whereas Mexico has a significant negative water balance, and is clearly one of the world’s largest importers of virtual water.

As Allan’s original work suggests, this is not necessarily bad news since it may imply that Mexico is currently using less of its own (limited) water resources than it might otherwise have to. In other words, Mexico’s virtual water imports may be delaying the inevitable crunch time when water usage becomes a critical limiting factor in the nation’s development.

Source of map

A.Y. Hoekstra and M.M. Mekonnen. 2012. The water footprint of humanity. Proc. Nat. Academy of Sciences, 109, 3232-7. Map was reproduced in “Spotlight on virtual water” by Stuart N. Lane in Geography, vol 99-1, Spring 2014, 51-3.

Related posts:

How can tourism perception be assessed? A case study using the Lerma-Chapala drainage basin

 Books and resources, Teaching ideas  Comments Off on How can tourism perception be assessed? A case study using the Lerma-Chapala drainage basin
Aug 282014
 

In numerous previous posts, we have looked at the importance of tourism in Mexico, and have examined its impacts at different scales, from the national/international scale at one extreme to the single resort scale at the other:

National scale:

Sub-national regional scale:

Single resort scale

We have also considered the way in which the characteristics of tourism in a resort change over time:

Attempting to quantify the importance or impacts of tourism, beneficial or otherwise, is fraught with methodological difficulties. The number of hotel rooms in different cities is often used as a proxy measure of the relative importance of tourism in different communities, but looking only at tourist capacity “masks  the fact that hotels are rarely full. In 2007, the national occupancy rate was 54.8%. Traditional beach resorts such as Acapulco, Mazatlán and Puerto Vallarta had an occupancy rate of 52.2%, compared to 68.1% for modern, planned mega-resorts like Cancún and Los Cabos. The occupancy rate in the large cities—Guadalajara, Mexico City and Monterrey—was 55.0%, well ahead of the 47.2% for other interior cities.” (Geo-Mexico, p 134).

As in other branches of geography, it is not only the “reality” that matters, but also people’s perceptions of reality. Most decisions concerning location (such as where to live, the best place to start a new business. etc) are taken on imperfect or incomplete information; in other words, these decisions are based, at least to some extent, on perceptions.

In the case of tourism, it is the perception of visitors that matters. This is precisely why certain resorts gain a reputation as being “jet set” or the “in place” to vacation. The “in place” today is not going to be the “in place” in a few year’s time, since perceptions (and reality) change. Nowhere has this proved to be more true in Mexico than in the case of Acapulco.

But is it possible to measure tourist perceptions? It is very difficult to do so directly, but there are ways of tackling this question, and here we look at one approach, based on an analysis of tourist-oriented literature.

The approach is easiest to explain in the context of a real example, in this case an analysis of the likely perception of foreign tourists of destinations in the Lerma-Chapala drainage basin in Mexico. (This study formed part of my contribution on tourism to the Atlas de la cuenca Lerma-Chapala, construyendo una visión conjunta, Semarnat-Unam-IE, 2006 – the link is to a low-resolution pdf of the entire atlas).

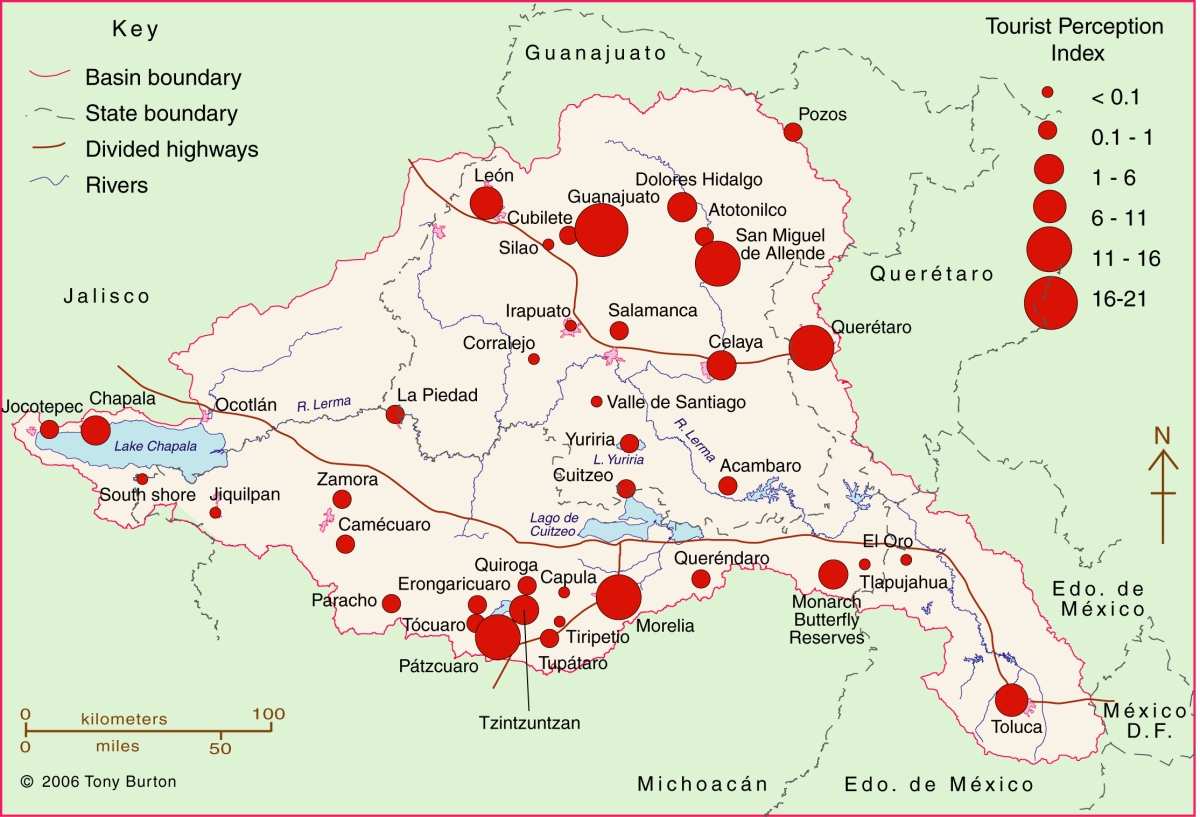
The Lerma-Chapala Basin (see map) is one of Mexico’s major river systems, comprising portions of 127 municipalities in five states: México, Querétaro, Michoacán, Guanajuato and Jalisco. The basin has considerable economic importance. It occupies only 2.9% of Mexico’s total landmass, but is home to 9.3% of Mexico’s total population, and its economic activities account for 11.5% of national GDP. It also has considerable importance for tourism.

Lerma Basin Tourist Perception Index.

Lerma Basin Tourist Perception Index. Cartography: Tony Burton / Geo-Mexico; all rights reserved Click to enlarge.

The red circles superimposed on the map represent an index of tourism perception. This index is based on an analysis of seven tourist guides that purport to cover the entire country:

  • AAA Tourbook (2004)
  • Let’s Go Mexico (2004)
  • Lonely Planet (2002)
  • Footprint Guide (1999)
  • Upclose Mexico (1998)
  • Insight Guide (1994)
  • Cadogan Guide (1991)

In each case, the total number of lines of text in the guide devoted to any location within the Lerma-Chapala drainage basin was counted, as well as the number of lines devoted to each individual location. This allowed a ratio or percentage to be worked out for each place for each book. For example, if a book had 240 lines in total devoted to the drainage basin, of which 60 were devoted to San Miguel de Allende, the perception index for San Miguel for that book would be 60/240 * 100 = 25%. Similar calculations were performed for all the locations mentioned, for each book, and then the mean index was calculated for each location. These mean indices were the basis for the size of the circles on the map.

In broad terms, the map shows which places are likely to be on a foreign traveler’s radar when they are visiting the area. Those familiar with this area may be surprised to see that the ghost town of Pozos merits as many lines of text as Quiroga (and indeed more lines of text than Atotonilco). Another surprise is that Tzintzuntzan appears to be as much in the tourist eye as Chapala, Dolores Hidalgo or Toluca. The main purpose of this post is not to analyse such apparent anomalies but only to suggest a relatively easy way of analysing tourist perceptions through the use of tourist-oriented literature. Applying the same method to the entire country, on a state-by-state basis, throws up far more interesting anomalies which we plan to share at some point in the future.

Related posts:

Related posts:

Monitoring air pollution in Guadalajara

 Books and resources, Teaching ideas  Comments Off on Monitoring air pollution in Guadalajara
Jun 162014
 

Air pollution in the city of Guadalajara, the state capital of Jalisco, has worsened over the past decade, though there are some recent signs of improvement :

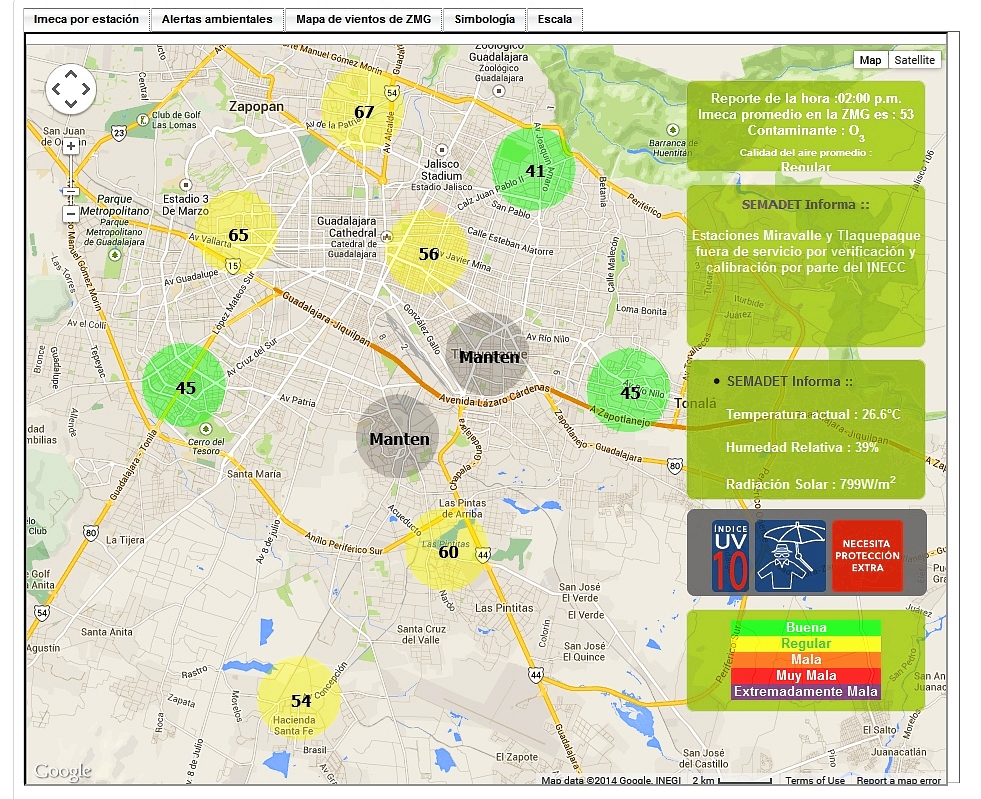
The Jalisco Environmental Agency now has a webpage where residents and travelers alike can now monitor Guadalajara’s air quality on an hourly basis. Readings for 10 stations are superimposed on a basemap on that page, together with links to graphs showing recent trends and other meteorological data. Tabs above the map also give a link to the current wind conditions across the city. Historical data (in Spanish) can also be accessed via the link to “Datos”.

Screenshot of Guadalajara air monitoring webpage

Screenshot of Guadalajara air monitoring webpage. Note: Two stations are shown as undergoing maintenance.

The map provides summary data in IMECAs, which stands for Índice Metropolitano de la Calidad del Aire (Metropolitan Index of Air Quality). IMECAs are a compound index combining measurements of concentrations of ozone (O3), sulphur dioxide (SO2), nitrogen dioxide (NO2), carbon monoxide (CO) and particles smaller than 10 micrometers (PM10).

In Guadalajara, formal smog alerts are issued if average readings rise above 150 IMECAs (“Very Bad”) for more than two consecutive hours. If readings rise above 200 IMECAs (“Extremely Bad”), then “serious alerts” impose restrictions on vehicle use and may lead to the suspension of school classes.

In Guadalajara, the worst air quality tends to be in the southern and eastern sections of the city. It also tends to occur in the months of April and May, immediately before the rainy season gets underway. The webpage system gives everyone an easy way to check these assertions!

In Guadalajara, mitigation efforts are centered mainly on reducing vehicle emissions (partly by stricter emissions testing and verification, and partly by improvements to the public transport network) since they are the main source of pollution. To date, there are no plans in Guadalajara to introduce a “Day without car” program similar to that in Mexico City:

Teaching idea

Use the Jalisco Environment Agency webpage to monitor Guadalajara’s air pollution and identify any patterns or trends related to air pollution in the city. Consider suggesting one or more hypotheses, such as “Air pollution gets worse in the afternoon”, or “The level of air pollution in eastern Guadalajara is worse than in western Guadalajara”, before testing your ideas using the online data.

Related posts:

May 262014
 

In a recent post – Mexico’s internet connections and e-commerce – we looked at how 35.8% of Mexican households now have computers, 30.7% are now connected to the internet, and at the very rapid rise of e-commerce over the past few years.

How does internet access in Mexico compare to other countries? Comparative studies show that Mexico lags well behind almost all major countries in terms of internet access. Mexico’s rate of 30.7% of households with internet access compares poorly with other countries in Latin America such as Brazil (37.8%), Chile (37.8%) and Argentina (34.0%).

Among OECD member states, Mexico ranks bottom in terms of internet access. South Korea ranks top, with 97.2%. The Netherlands, Norway, Iceland, Luxembourg, Sweden and Denmark all have rates over 90%. Canada has a rate of 78.4%, the USA 71.1% and Japan 67.1%. The lowest ranking European countries are Turkey (41.6%), Greece (50.2%) and Portugal (58.0%).

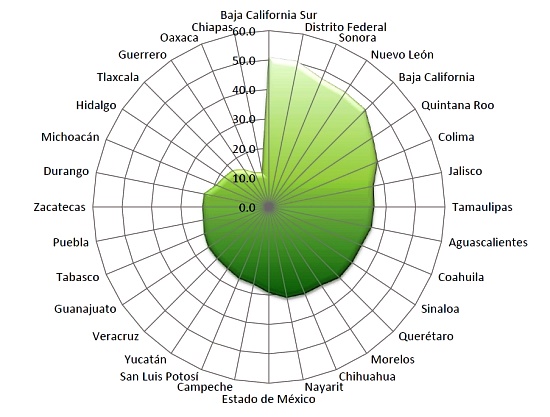
Within Mexico, the rate of internet access varies widely from one state to another (see graph).

Percentage of households with internet access

Percentage of households with internet access. Source: INEGI (2014)

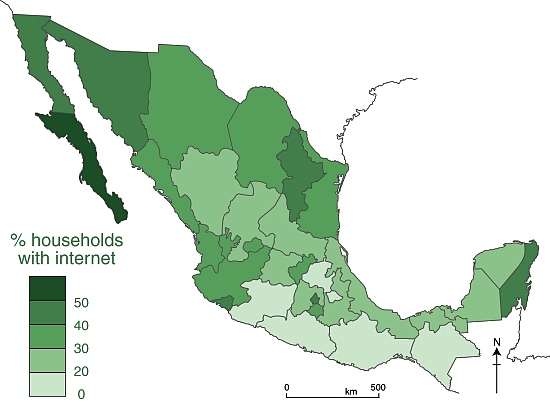
The disparities are evident from the graph, but the pattern becomes much clearer when the data are grouped and mapped:

Internet access, 2013

Pattern of internet access, 2013. Data: INEGI. Credit: Geo-Mexico

The north-south divide in Mexico, that we have frequently referred to in previous posts, is immediately evident (with the notable exception of the easternmost state of Quintana Roo). Perhaps not surprisingly, there is a close correlation between GDP/capita in different states and their internet access.

Discussion question:

What other factors are likely to influence rates of internet access? To support, or challenge your ideas, try using Geo-Mexico’s map index to find maps to compare with the map of internet access.

Source of data:

  • Estadísticas a Propósito del Día Mundial de Internet” (pdf file) (INEGI 2014)

Related posts:

Qualitative fieldwork methods: auto-photography

 Teaching ideas  Comments Off on Qualitative fieldwork methods: auto-photography
Jan 132014
 

In an interesting recent article, Melanie Lombard of the Global Urban Research Centre of the University of Manchester in the UK describes how she used the fieldwork technique of auto-photography to explore the views of people living in two informal settlements in Xalapa, the state capital of Veracruz.

What is auto-photography?

Auto-photography is not the same as selfies! In auto-photography participants take photographs, choosing images and representations for themselves. Auto-photography typically entails a researcher giving cameras to research subjects and then asking them to photograph particular places and/or events.

Why use auto-photography?

Visual images are of great importance in geography. Geographers have utilized photographs and other images in their research and teaching for decades, paying considerable attention since at least the 1950s to the ways in which people respond to particular images, and how they interpret them. Auto-photography follows in this long-standing geographic tradition of recording and analysing visual images.

In particular, auto-photography “allows researchers to capture and articulate the ways identity guides human action and thought. It can generate more authentic data because it enables researchers to look at the participants’ world through the participants’ eyes. Auto-photography does this because participants themselves select and record the static images they feel represent them the best. This is a particularly critical issue for those who conduct research on the experiences of marginalized groups. Because auto-photography provides participants a chance to speak for themselves, it helps researchers to avoid exclusive reliance on potentially culturally biased research instruments.” (Noland, 2006)

In other words, auto-photography is one way to challenge the assumptions and generalizations often made by “outsiders”, even if they are researchers with the best intentions!

Lombard studied two informal settlements (colonias populares) in Xalapa: Loma Bonita and Moctezuma.

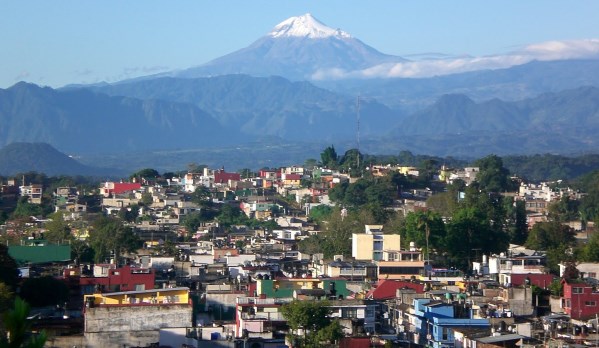
Xalapa, Veracruz

Xalapa, Veracruz (Mexico’s highest peak, Pico de Orizaba, in the background)

What method did she use?

Participants were given a camera and asked to take at least three photos to illustrate each of the following:

  • positive aspects of living in the neighborhood
  • negative aspects of living in the neighborhood
  • residents’ achievements in the neighborhood
  • special/typical characteristics of the neighborhood

Cameras were given to six selected individuals who were given a week to take a series of photos. During a follow-up interview, participants were asked about their motivations for having chosen particular locations to illustrate their neighborhood’s positive and negative aspects.

As Lombard points out, unlike the typically “negative framings” of informal settlements in most discussions, the images taken by the residents “convey a sense of everyday life taking place, amid hope and conviviality, as well as struggle and hardship”. Interestingly, photos of the local schools were taken by 5 of the 6 participants, with one 16-year-old teenager explaining how “in such an isolated neighbourhood, school is a service as significant as water or electricity”. There is a valuable lesson to be learned from the stark contrast between a photo of Loma Bonita school taken by the researcher, in which the school’s building and location are emphasized, and an image of the same school taken by one of the participants, who chose to photograph a group of students, accompanied by a teacher, engaged in a cultural activity in the playground.

Photos illustrating positive aspects of the neighborhood including a resident working a small plot of land for corn (maize) and one of a family butchering a pig. Such images underline the importance, as Lombard points out, of “understanding poverty from the point of view of the poor”, suggesting that residents view their neighborhoods not only as sites of hardship and discrimination, but also as “an important base for livelihoods”.

There are several financial and ethical considerations that also need to be considered. For example, should a financial reward be offered to participants? Might the offer of a financial reward change the level of commitment of participants and affect their choice of subject matter? In the context of Lombard’s study, she opted to give a copy of all photos to each participant, as well as giving them the opportunity to keep the camera that had been provided.

Lombard’s article is a valuable addition to the literature about qualitative fieldwork methods, though (as she takes pains to point out) the method does present “a set of specific ethical challenges” and the results of such studies may be difficult to interpret.

References:

Lombard, Melanie. 2013. Using auto-photography to understand place: reflections from research in urban informal settlements in Mexico. Area (RGS/IBG) 45:1, 23-32.

Noland, Carey M. 2006. Auto-Photography as Research Practice: Identity and Self-Esteem Research Journal of Research Practice, Volume 2, Issue 1.

Related posts:

“Los que llegaron”, Spanish language videos about Mexico’s immigrant groups

 Books and resources, Teaching ideas  Comments Off on “Los que llegaron”, Spanish language videos about Mexico’s immigrant groups
Oct 052013
 

Once TV México (“Eleven TV Mexico”) is an educational TV network owned by the National Polytechnic Institute (Instituto Politecnico Nacional) in Mexico City. Over the years, Once TV México programs have won numerous national and international awards.

Many of its programs are available as webcasts or on Youtube. Once TV México has made hundreds of programs that provide valuable resources for Spanish-language geography classes or for students of Spanish or anyone wanting to improve their Spanish-language skills. For example, their long-running program “Aquí nos tocó vivir” (“Here We Live”) has explored all manner of places throughout Mexico over the past 35 years, and has received UNESCO recognition for its excellence.

Of particular interest to us is “Los que llegaron” (“Those Who Arrived”), a series of programs looking at different immigrant groups in Mexico. Each 20-25 minute program focuses on a different group and explores the history of their migration to Mexico, their adaptation to Mexican life, their integration into society, the areas where they chose to settle, and the links between their home countries and Mexico.

Mexico has a long history of welcoming people from other countries, including political refugees. Each of these programs offers some fascinating insights into the challenges faced by migrants arriving in Mexico for the first time.

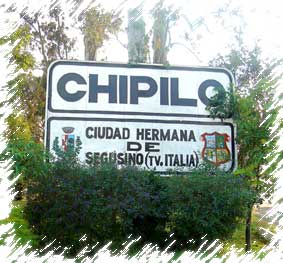
Sister city of Segusino, Italy

Sister city of Segusino, Italy

For instance, the program about Italian immigration to Mexico (above), explains why Mexico was seeking colonizers in the middle of the 19th century in order to populate and develop rural areas. One group of Italians settled in Veracruz (in present-day Gutiérrez Zamora); another group, 3,000 strong, and from the Veneto region in northern Italy, settled in Chipilo, near the city of Puebla. (For anyone not familiar with Chipilo, one of our favorite bloggers, Daniel Hernandez, has penned this short but memorable description of a typical Sunday morning there: Cruising in Chipilo, an Italian village in Mexico).

Italian immigration increased dramatically after the 1914-1918 war. Today, according to the program, there are approximately 13,000 Italian citizens residing in Mexico and an estimated 85,000 Mexicans of Italian descent. Note, though, that most sources quote a much higher figure for the latter category, perhaps as high as 450,000.

[Aside: In chapter 4 of “Mexican National Identity, Memory, Innuendo and Popular Culture”, William H. Beezley looks at the role of itinerant puppet theater in molding Mexico’s national identity. The largest and most famous single troupe of all was the Rosete Aranda troupe, formed by two Italian immigrants in 1850. The troupes went from strength to strength in the next half-century. By 1880, the Rosete Aranda company had 1,300 marionettes and by 1900 a staggering 5,104. Their annual tours around the country helped influence national opinions and attitudes.]

Program list for the “Los que llegaron” series:

  • Españoles (Spaniards)
  • Alemanes (Germans)
  • Húngaros (Hungarians)
  • Italianos (Italians)
  • Argentinos (Argentines)
  • Ingleses (English)
  • Japoneses (Japanese)
  • Estadounidenses (Americans)
  • Coreanos (Koreans)
  • Franceses (French)
  • Chinos (Chinese)
  • Libaneses (Lebanese)
  • Rusos y Ucranianos (Russians and Ukrainians)

Related posts:

Aug 302012
 

Veteran blogger Matt Osborne has unearthed a real gem! This 1977 BBC documentary was the tenth episode of The Age of Uncertainty, John Kenneth Galbraith’s history of economic thought. In this episode, Galbraith examines the economics of poverty and inequality.

The section of greatest interest to Geo-Mexico readers is his overview of the changing relationships between land and people in Mexico from precolonial times to the 1970s. [This ten minute segment starts at minute 4:33 of the video].

Galbraith does confuse his Teotihuacanos with his Aztecs, and clearly many things have changed since 1977, but this video is a great and straightforward introduction to the complex issues of land resources and population, suitable as the starting point for many discussions at high school or college level about land clearance, the financing of land improvement, the Green Revolution, population growth and social organization.

Related posts:

Interactive graph of changes in GDP/person and life expectancy in Mexico since 1800

 Books and resources, Teaching ideas  Comments Off on Interactive graph of changes in GDP/person and life expectancy in Mexico since 1800
Aug 252012
 

Gapminder is a wonderful resource for an overview of all manner of things geographic. The link below will take a few minutes to load, but should then show how Mexico’s GDP/person (on a purchasing power parity basis) and life expectancy have changed since 1800. The size of the yellow circle for each year is proportional to Mexico’s total population, with a scale that can be user-modified at the bottom right of the graph. Hover your mouse over a circle for the year to be identified.

The early figures for GDP/person are unlikely to be very reliable, but once we reach the 20th century, the figures are based on better assumptions and data. After falls in GDP/person and life expectancy in the early stages of the Mexican Revolution (which began in 1910), both variables increased steadily until about 1926. While life expectancy has continued to rise since then, with the occasional dip, GDP/person shows some obvious “blips” such as the early 1950s when it fell quite sharply.

It is interesting to play with the chart and look at how GDP/person and life expectancy have changed for other countries.

To do this:

  1. Select one or more countries by clicking on them [each country is identified when your mouse hovers over it]
  2. Use the slider at the bottom of the chart to select the time period of interest
  3. Sit back and prepare to get engrossed in the world of Gapminder!

Rocks and relief fieldtrip: Tequisquiapan and the Peña de Bernal

 Other, Teaching ideas  Comments Off on Rocks and relief fieldtrip: Tequisquiapan and the Peña de Bernal
Jun 212012
 

There is a close connection between geology and relief in many parts of Mexico. In this post we describe a one-day fieldwork excursion in the Tequisquiapan area of the central state of Querétaro that looks at this connection. The fieldwork is suitable for high school students but could easily be extended to provide challenges for college/university students.

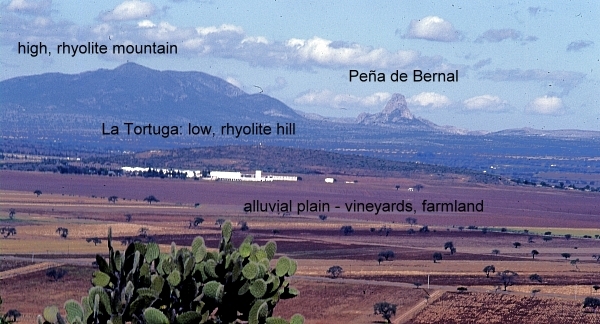
The fieldwork starts with a fieldsketch from near Tequisquiapan. Any suitable vantage point will do, provided it offers a clear view northwards to the very distinctive Peña de Bernal (seen in the background of the photo below). At this point, a simple line sketch should suffice to help students identify the following four different kinds of terrain:

  • flat or gently sloping plain, used for cultivation
  • low hills, with gently sloping sides, which look to be covered in bushes and cacti [scrub vegetation]
  • high mountains, with steeper slopes, also with no obvious signs of cultivation
  • the Peña de Bernal itself, a distinctive monolith with exceptionally steep sides

There is no need to identify any rocks or use any geological terms (students can add appropriate labels later!). Engage the students in a discussion about why there might be four different kinds of relief visible in this area, and how their ideas or hypotheses could be investigated further. Conclude the discussion by explaining that they are now going to look for evidence related to the idea that these four different kinds of relief are connected to significant differences in geology.

View looking north from "Las Cruces" near Tequisquiapan. Photo: Tony Burton; all rights reserved.

View looking north from "Las Cruces" near Tequisquiapan. Photo: Tony Burton; all rights reserved.

The next stop is a small roadside quarry on the flat area. The most accessible quarry many years ago was located a short distance south of Tequisquiapan on the east side of the highway, but any quarry on the flat land will serve to reveal the rocks that form the plain.

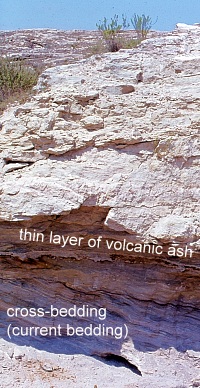
Roadside quarry, near Tequisquiapan. Photo: Tony Burton; all rights reserved

Roadside quarry, near Tequisquiapan. Photo: Tony Burton; all rights reserved

[Warning: Ensure that you park off the highway; when examining the rock in the quarry, avoid any overhanging sections, and do not do anything to cause slope instability or collapse].

The rocks in the quarry are in layers (sedimentary) and very distinctive. The individual particles of the rock are rough to the touch and sand-sized, so this is some kind of sandstone.

Some layers are more or less horizontal, but in places successive layers are laid down at a much steeper angle. This is “current bedding” and indicates that the rocks were formed by water, perhaps where a river entered a lake. The individual particles in the rock are not well-rounded, so have not traveled all that far.

Within each major layer, the material shows signs of sorting, with fine material sitting on top of coarse material. In some places, the sandstone contains small pebbles, so this rock is a sandstone conglomerate. Small casts of fossil shells can be seen in places, further suggesting it is a sedimentary rock deposited in a former lake.

A very thin white layer is present (at about head height in the photo). This layer is totally different to the sandstone conglomerate. It is fine material that has been compacted. Given the volcanic history of central Mexico, this is almost certainly a thin layer of volcanic ash that covered older rocks before being covered in turn by the next layer of sediments.

With some guidance, students should be able to work most of this out for themselves! The last stage at this stop is to ask why this rock forms the flat land in the area, rather than the hills. (Answer: softer, weaker, less resistant, easier to erode, etc).

The next stop is to take a look at the rock forming the low hills. The highway between Tequisquiapan and Ezequiel Montes (see map) conveniently cuts through a low ridge at San Agustín. This affords an opportunity to take a close look at the rock forming that ridge. [Warning: Ensure that you find a safe parking spot, and take every precaution, since traffic along this highway can be heavy and very fast-moving]

The rock at San Agustín is darker and much harder than the rock in the quarry. It has clear crystals in it, apparently arranged haphazardly. From its color (grey) and grainsize (fine), it is a rhyolite [a fine grained, acid igneous rock].  It is far more difficult to erode than the sandstone on the plain, so it forms upstanding ridges and low hills in the landscape.

From San Agustín, drive through Ezequiel Montes and on to the town of Bernal, one of Mexico’s “Magic Towns“. The next part is the most physically-challenging part of the excursion since it is necessary to climb at least part-way up the Peña de Bernal! [Warning: this is very steep in places, and climbing beyond the mid-way “chapel” is definitely not recommended]. Examining the rocks of the Peña de Bernal reveals that they are lighter in color than the rhyolite and fine-grained, but with larger crystals (phenocrysts) in some places. This rock must have cooled very slowly (or the phenocrysts would not have had chance to form) and this is an intrusive igneous rock known as microgranite. Eagle-eyed students should also find some other rocks while climbing the Peña de Bernal. In places, it is possible to find good specimens of a very hard, banded metamorphic rock that was formed when heat and/or pressure transformed pre-existing rocks. The banded rock is a gneiss [pronounced “nice”].

The presence of intrusive igneous rocks (formed underground) together with metamorphic rocks strongly suggest that the Peña de Bernal is an example of a volcanic plug. It represents the central part (and all that now remains) of a former volcano, whose sides, presumably composed of ashes and lava, have long since eroded away.

Conclusion:

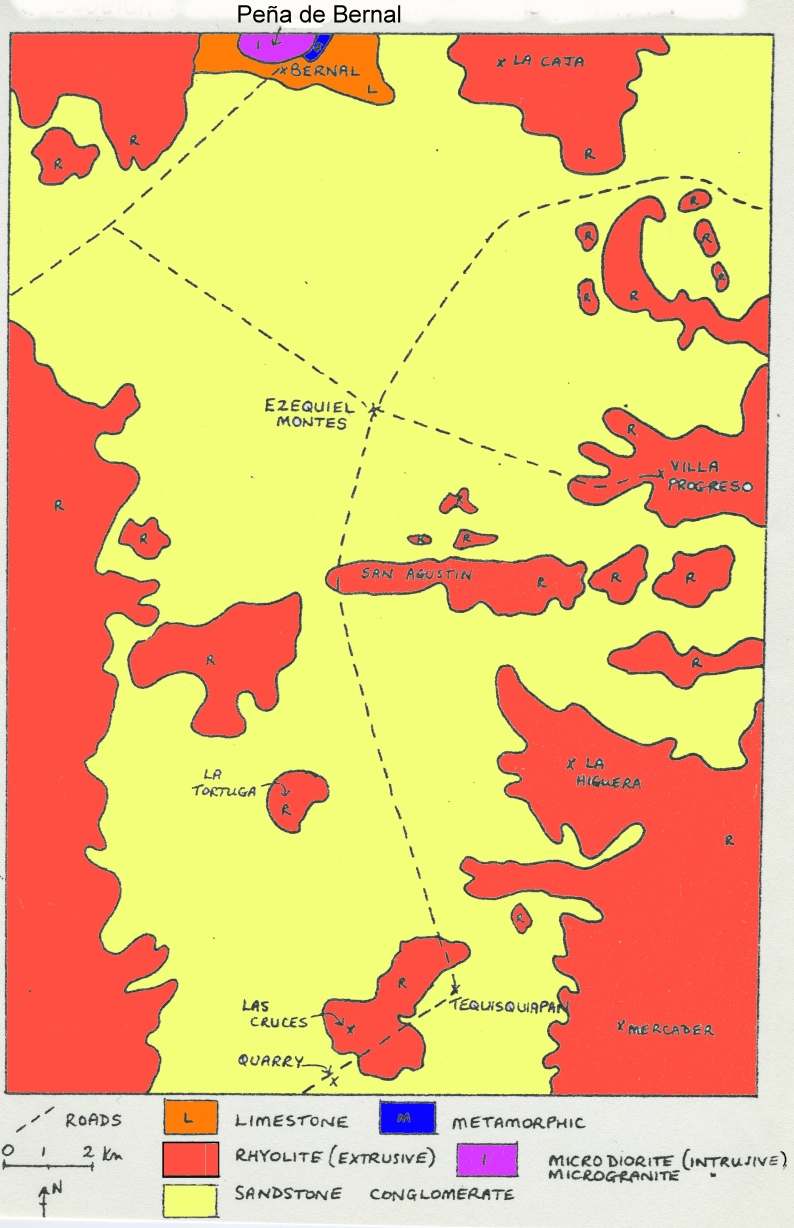
After students have had chance to work most of this out for themselves, a look at the local geological map should confirm that their deductions are reasonable. As can be seen on the map below, the flat area is indeed an alluvial plain (sandstone), with low rhyolite hills and ridges in places, and higher rhyolite mountains in the background, with the distinctive Peña de Bernal made of igneous and metamorphic rocks at the northern edge of the map.

In this particular part of Mexico, as in many other areas, the link between geology and relief is very strong! Happy exploring!

Sketch map, Geology of the Tequisquiapan area

Sketch map, Geology of the Tequisquiapan area; click to enlarge

Related posts:

Mapping remittance flows to Mexico, a practical exercise

 Books and resources, Teaching ideas  Comments Off on Mapping remittance flows to Mexico, a practical exercise
Jan 262012
 

Looking for a practical exercise about migration and remittance flows to challenge your students?

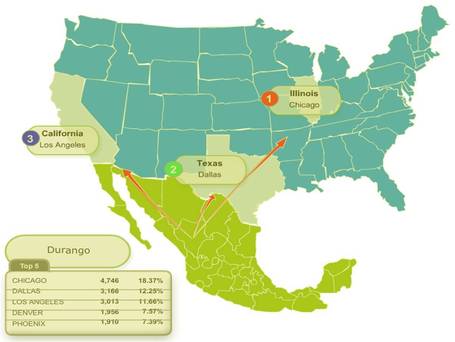
Remittances (the funds sent by migrant workers back to their families) are a major international financial flow into Mexico. Remittances bring more than 20 billion dollars a year into the economy, an amount equivalent to 2.5% of Mexico’s GDP. On a per person basis, Mexico receives more worker remittances than any other major country in the world. An estimated 20% of Mexican residents regularly receive some financial support from relatives working abroad. Such remittances are the mainstay of the economies of many Mexican families, especially in rural areas of Durango, Zacatecas, Guanajuato, Jalisco and Michoacán.

Two data tables [see link]  included in the World Bank Working Paper by Raúl Hernández-Coss, referred to in several previous posts, offer an ideal starting-point for practical mapping and analysis exercises for students. (The data is from 2004 but we are more interested in general patterns than precise values). The data tables are here:

A ready-made printable base map, showing the state boundaries of Mexico and USA, can be found here:

Suggested mapping exercises:

1. Which US areas have most Mexican migrants?

Use Column 2 (Mexican nationals living in this jurisdiction) of Table VI.A.1 and draw proportional circles on a base map to show which areas have most migrants. [To draw circles where the area of each circle is in direct proportion to the number of Mexican nationals, the first step is to calculate the square root of each number. These square roots are then used as the basis for working out the diameter (or radius) of the circle you draw for each location. The area of each circle is then proportional to the number of migrants. Remember to choose the most appropriate scale for the circles, so that it is easy to compare places. (If you draw very small circles, or super-large circles, they will be difficult to compare!)

2. Which US areas send the highest value of remittances back to Mexico?

Use column 4 of Table VI.A.1 to show the value of total “annual remittance flows” on a base map. You may be able to superimpose this information on the same base map you drew for Q1 which would make it very easy to see if the areas with most Mexican nationals send the most remittances back to Mexico each year. Can you see any anomalies on your map, either where an area sends far more remittances back than might be expected from the number of migrants, or where an area sends only a small value of remittances back despite having a very large number of Mexican nationals?

3. How does the “average remittance” (column 5 of Table VI.A.1 vary?

Use the available figures to see if you can identify any pattern to which areas send relatively large remittance payments, and which send much smaller average payments.

4. Where do all the remittance payments go?

Level One: Use the information from Table VI.A.2 to draw a map with arrows showing the largest single flows from each area in the USA to their corresponding state in Mexico.

Level Two: Work out the dollar value of the main remittance flows, by using the % figures given for some areas in Table VI.A.2 and their corresponding total annual remittance values from Table VI.A.1. (eg the value of the Los Angeles to Jalisco flow is 26% of $7,886.3 million). Then map the ten largest flows using flowlines (arrows where the width of each arrow is proportional to the value of remittances).

Look at the map or maps created and see if you can identify any patterns. If you can describe a pattern, then also look to see if you can find any anomalies, and try to explain your findings.

Related posts:

Food speculation fuels a tortilla crisis in Mexico

 Books and resources, Teaching ideas  Comments Off on Food speculation fuels a tortilla crisis in Mexico
Oct 292011
 

The Ecologist Film Unit has produced an excellent 8-minute video on how financial speculation on corn (maize) has led to a dramatic rise in the price of corn tortillas, with potentially disastrous effects for the health and well-being of the many of Mexico’s poorest. Reporter Tom Levitt’s video, accompanied by text, presents a compelling case, one which would be an excellent starting-point for class discussions.

Two short quotes set the scene:

“For many Mexicans, particularly the estimated 40 million living on less than $5 a day (£3), tortillas account for almost half of their average daily calorie intake. As a whole, the country consumes 23 times more maize than rice.”

“In 2000 there was $6 billion invested in commodities, by 2011 it was $340 billion, of which $126 billion, according to data from Barclays Capital, is reported to be invested in food. The vast majority of this new investment has been by speculators with no interest in the agricultural sector or in actually taking delivery of the commodity.”

The result? Higher prices for corn, greater unpredictability in prices, and adverse changes to the diet of tens of thousands, as corn becomes more expensive than meager household budgets permit.

The video is a powerful indictment of the harm being done to ordinary people in many parts of the developing world by rich-world market speculators and investment banks. Watch it now, or read the full article:

The maquiladora export landscape

 Books and resources, Teaching ideas  Comments Off on The maquiladora export landscape
Oct 102011
 

InfraNet Lab is “a research collective probing the spatial byproducts of contemporary resource logistics.” Given its emphasis on spatial aspects, it includes many topics of interest to geographers.

InfraNet Lab was included on Planetizen’s 2009 list of the 10 best planning, design, and development websites. Planetizen describes InfraNet Lab as:

“An intense and directed blog focusing on the physical manifestations of controlling resources. It’s a fresh look at the impacts of modern world’s infrastructural needs and the intertwined networks between urbanism, architecture and landscape that result. With archives dating back to April 2008, InfraNet Lab offers a crash course in innovative ideas that reframe the infrastructure conversation around the impacts of human resource dependence and, ultimately, methods for making improvements. An insightful and inciting read for anyone feeling underwhelmed by the status quo of modern-day infrastructure.”

One post on InfraNet Lab of particular interest to us is the guest post by Juan Robles, following an InfraNet Lab seminar at Daniels Faculty of Architecture, Landscape, and Design at the University of Toronto. Robles writes about the landscapes resulting from the growth of maquiladoras in Mexico. He looks at how the necessary infrastructures and networks for maquiladoras to succeed have developed, and how they have transformed the Mexico-US border area. The changes have certainly been profound:

“The ongoing processes of trade and communication that now integrate the 21st century regional economies have created numerous territories of abundance. Among these spaces the maquiladora landscape, in the northern border of Mexico, has seen the greatest change in the last 50 years.”

This is a well illustrated account of the spatial changes associated with maquiladoras, and includes a variety of useful maps and graphics.

Shanty towns support maquiladoras

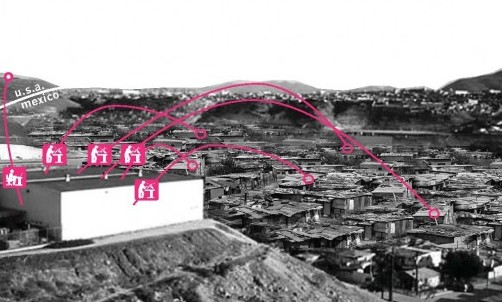
Shanty towns support maquiladoras. Credit: Juan Robles/InfraNet Lab.

InfraNet Lab is a valuable resource for AP, A-level and IB. In InfraNet Lab’s words:

The globe’s networked ecologies of food, water, energy, and waste have established new infrastructures and forms of urbanism linking dispersed entities. These agglomerations evolve and shift as resources are uncovered or depleted. While these ecologies exist at the service of our contemporary lifestyles, they have typically remained hidden from view and from the public conscience. Yet as resources of food, fuel and water begin to run scarce, new resources are mined and new networks develop.

InfraNet Lab takes the view that “Long accepted patterns of globalization are being called into question as transportation costs soar and resources run scare, transforming mobility and trading patterns. New local, regional and international networks of goods, movement and trade are beginning to emerge.”

This means that InfraNet Lab offers some very valuable resources for courses such as the IB Geography’s Paper 3 for Higher Level students which looks at the impacts of all kinds of international interactions.

The financial flows involved in Mexico’s vehicle manufacturing industry

 Other, Teaching ideas  Comments Off on The financial flows involved in Mexico’s vehicle manufacturing industry
Sep 192011
 

In previous posts, we have seen Where Mexico’s vehicle assembly plants are located, as well as looked at some of the reasons for Mexico’s success in this industrial sector and examined Mexico’s vibrant autoparts sector.

In this post we analyze the varied financial flows involved in the industry. Both local and international financial flows underpin vehicle manufacturing in Mexico.

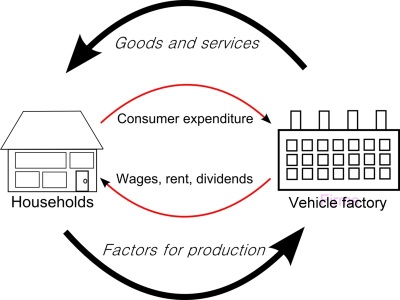
financial flows

The following are some of the most important financial flows in the vehicle manufacturing sector.

  • International financial flows are in green
  • Domestic/local financial flows are in magenta

1. Foreign firms form Mexican subsidiaries and invest in Mexico; start-up capital to construct the factory and set up the business comes almost entirely from outside the country and enters Mexico as FDI. In recent years, FDI for auto firms has varied from $1 billion to $3 billion.

2. In many cases, local partners are involved, and they also contribute some of the start-up funds.

3. The factories employ workers, in some cases several thousand of them. These workers earn wages and spend most of their wages in the local economy. Each manufacturing job therefore has an economic multiplier effect, and generates more (indirect) jobs in the local economy. These jobs include positions in shops, services, transport, banking, auto-repair, etc. It is estimated that the economic multiplier for vehicle manufacturing is 3:1 – in other words, for every dollar spent in the industry three more are spent in the economy.

4. The factories purchase parts (components), some from Mexican suppliers, and some from overseas.

5. The factory produces vehicles, some of which are sold in the local market, via a series of vehicle distribution/sales points. This generates smaller two-way financial flows within the country.

6. Most of the parts and vehicles made in Mexican auto factories are exported. This generates another major financial flow, as purchasers overseas send funds back into Mexico to pay for their goods. This financial flow (a) allows production to continue and (b) generates profits for the factory owners (the car firms and shareholders).

7. The majority of these profits leaves Mexico, and is repatriated to the corporation’s home country, but both the workers in the factory, as well as the factory owners, pay taxes (state and federal) which remain in Mexico. In the case of shareholders, it is usually a financial flow towards their home country.

Previous posts in the mini-series:

Class exercise:

Use the description of financial flows above to draw an annotated diagram or a map to show the financial flows associated with the manufacturing of vehicles in Mexico. If you can think of additional flows that might be important, add those as well. Compare your diagram/map with that of other students and discuss the results.

Where are Mexico’s vehicle assembly plants located?

 Teaching ideas  Comments Off on Where are Mexico’s vehicle assembly plants located?
Aug 272011
 

Mexico is one of the world’s “Top Ten” countries for vehicle production and for vehicle exports. 75% of Mexico’s annual production of around 2 million vehicles are made for export. The industry attracts large amounts of Foreign Direct Investment (FDI). Vehicle assembly plants provide around 60,000 jobs, with a further 80,000 employed in distributorships nationwide and a whopping 420,000 employed in the autoparts sector. The combined exports of vehicles and autoparts bring 85 billion dollars a year into the Mexican economy.

There are more than 25 vehicle assembly plants in Mexico, manufacturing many brands of cars and trucks (see map). In addition, there are 1100 firms specializing in making parts for vehicles. In this post, we consider the location of vehicle assembly plants; in a later post we will look more closely at the characteristics of the vehicle assembly and autoparts industry in Mexico.

Vehicle assembly plants in Mexico, 2011

Vehicle assembly plants in Mexico, 2011. Credit: Tony Burton/Geo-Mexico; all rights reserved.

As the map shows, certain areas of Mexico have attracted more investment in vehicle assembly plants than other areas. The two largest existing concentrations are focused on Toluca in the State of México, and on Saltillo in northern Mexico. However, the fastest growing cluster is in the central state of Guanajuato, where two major plants are currently in the planning stages.

  • 1. What are the advantages and disadvantages of having several vehicle assembly plants in the same area?
  • 2. What the advantages and disadvantages of locating vehicle assembly plants far apart?
  • 3. Vertical linkages occur when one company controls many or all stages in the production of a product. For instance, an auto company may make its own engines and accessories to attach to the vehicles it makes. Horizontal linkages exist where one company is supplied with the components (engines, gearboxes) it needs by another company. What part do you think vertical and horizontal linkages might play when a major automaker decides where to locate a new vehicle assembly plant?
  • 4. Why are there no vehicle assembly plants in southern or eastern Mexico?
  • 5. What are the main reasons for the cluster of vehicle assembly plants near Mexico City and Toluca?
  • 6. Why has Ford chosen to locate its two plants in northern Mexico in different states?

Discuss your suggestions with your classmates and teacher. The answers to these questions should give you a useful list of the major factors that explain the distribution of vehicle assembly plants in any country, not just Mexico.

Related post:

A case study of clustering in a different industry

Aug 162011
 

In several previous posts we have looked at specific migration channels connecting Mexico to the USA:

A Mexican government website, for its Institute for Mexicans Abroad, has lots of statistics about the number of Mexicans registered at each of Mexico’s consulates (which number more than 40) in the USA, together with their state of origin. A series of handy interactive maps for 2008, 2009 and 2010 provide a quick overview of some of the major flows.

  • Mexicans registered in consulates in the USA, 2008
  • Mexicans registered in consulates in the USA, 2009
  • Mexicans registered in consulates in the USA, 2010

Hovering your mouse over any state in Mexico brings up details of which consulates in the USA attracted the highest number of registrations for migrants who originated from that state.

Example of map

Example of migration map, courtesy of Dr. Seth Dixon

By way of illustration, consider the patterns shown using the 2010 map for migrants who originated in the three states (Campeche, Yucatán and Quintana Roo) forming the Yucatán Peninsula. It turns out that migrants from the state of Yucatán are far more concentrated than migrants from the other two neighboring states. About 60% of all migrants from the state of Yucatán who registered in Mexican consulates in the USA registered in either San Francisco, Los Angeles (both California) or Portland (Oregon).

For migrants from Campeche, the “top three” consulates are Omaha (Nebraska), Atlanta (Georgia) and Dallas (Texas), but these three account for only about 22% of all Campeche migrants registered with a consulate, meaning that the spread of migrants from Campeche is far less focused than that of migrants from Yucatán state.

In the case of Quintana Roo, the top three consulates for registrations are San Francisco (California), Atlanta (Georgia) and Dallas (Texas); these three account for almost 40% of all registrations of migrants from Quintana Roo.

Identifying a pattern, or variations between the patterns for several states is one thing; explaining it is another!

Q. What factors might influence the differences in patterns noted for the three states of the Yucatán Peninsula?

Aug 082011
 

Durango has long been considered the scorpion capital of Mexico (even the local soccer team became known as Los Alacranes, the Scorpions). At one point in the past, the city paid a bounty for each scorpion killed. Some historical accounts suggest that the scorpion catch rose dramatically, until the local authorities realized that some families had started their own financially lucrative scorpion-breeding programs.

These days, few scorpion stings are reported in Durango, partly because Durango’s scorpion hunters (alacraneros) catch and kill thousands each rainy season; prime specimens are encased in souvenir key rings and wall clocks sold in the local market. They also supply medical research labs.  Research in one lab at the University of California has isolated several peptides that appear to suppress the immune system, promising another way to prevent transplant rejection.

Lourival Possani, and his colleagues at Mexico’s National University (UNAM) have discovered a toxin (named scorpine) in scorpion venom that slows down the growth of malaria parasites in fruit flies; if similar techniques work in malarial mosquitoes, it may be possible to dramatically reduce the spread of malaria.

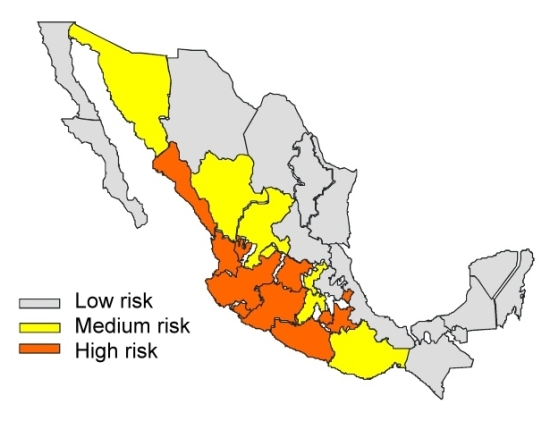
About 250,000 people in Mexico are stung by scorpions each year—more people than in any other country. Several dozen people die each year. Indeed, for the past 20 years, scorpion stings have been the leading reason in Mexico for  deaths due to adverse reactions and poisoning caused by venomous plants and animals. There are more than 200 different species of scorpions in Mexico, of which only 8, all belonging to the genus Centruroides are a significant public health risk. The map shows the areas defined by Mexico’s Health Secretariat as being of High, Medium and Low risk for dangerous scorpions.

Mortality remains higher in the smallest settlements, and is greatly reduced in mid-sized and large settlements. This is a function of both the reduced proximity of medical care in small settlements and of the higher numbers of scorpions/10,000 people in less urbanized settings. The highest mortality rates by age occur in the 0-1 years group (7 deaths/million), followed by the 1-4 age group (3.8/million) and the 60+ years group (0.8/million) (all data from http://www.scielo.br/pdf/rpsp/v21n6/05.pdf)

Scorpion risk in Mexico

Scorpion risk in Mexico (Secretaria de Salud)

Fortunately, progress is being made. The number of recorded deaths from scorpion stings [1] has fallen from more than 1,000/year in the 1950s to 285 in 1995, about 80 in 2003, and 57 in 2005. This improvement is the result of public health campaigns stressing the importance of seeking emergency treatment and of the development of antivenin serum (known as Alacramyn in Mexico and Anascorp in the USA). Mexico’s antivenin industry, led by the Bioclon Institute, is world class, exporting serum to the USA and Australia as well as throughout Latin America. The biggest threat from scorpions comes from central and northern states in Mexico, including several along the Pacific Coast: Nayarit, Jalisco, Colima, Michoacán and Guerrero.

According to UNAM’s Biomedical Investigation Institute, 277,977 people in Mexico reported scorpion stings in 2010. In the first five and a half months of 2011, 98,818 people in Mexico have been stung. The five states with the highest incidence of reported scorpion stings are: Jalisco (19,995), Guerrero (15,769), Morelos (13,123), Guanajuato (12,326) and Michoacán (10,597).

The incidence of scorpion stings rises sharply in summer when higher temperatures encourage scorpions to leave their lairs and go exploring.

Q. What other factors, besides the ones mentioned in this post, might help explain the pattern of risk shown on the map? Hint – can you think of things that the states shown as “high risk” — or the “low risk” ones — have in common?

– – – – –

[1] A Google search using the terms “scorpion”, “deaths” and “Mexico” finds dozens of websites all claiming that “In Mexico, 1000 deaths from scorpion stings occur per year.” This includes the two highest ranking sites in the results here and here, for articles dated 14 April 2011 and 20 August 2009 respectively. Given that 1000 deaths/year from scorpions has not been true for 20+ years, perhaps it’s time for these sites  to update their data by referring to Geo-Mexico!

Some rural areas are more rural then others

 Excerpts from Geo-Mexico, Teaching ideas  Comments Off on Some rural areas are more rural then others
Jul 022011
 

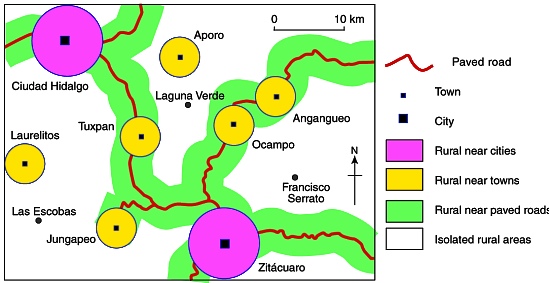
We all recognize that some cities are more urban than others. For example, Mexico City is considered more urban that a town of 20,000. By the same token, some rural communities are more “rural” than others. For example, a small settlement located near a city or along a main road would be considered less rural than an equally sized settlement in a more isolated area.

CONAPO's categories of rural area applied to eastern Michoacán

CONAPO's categories of rural area applied to eastern Michoacán. Credit: Tony Burton; all rights reserved.

The National Population Council (CONAPO) classifies rural localities into four groups based on accessibility to cities, towns and roads. The map shows how these four groups relate to a region in the eastern part of Michoacán state.

Suggested classroom exercise:

Appendix B of Geo-Mexico gives the percentages for each of these four rural groups in each state. What would be the best way to map the figures for the percentages of rural groups in each state?

Make your own “Better Life Index”

 Books and resources, Teaching ideas  Comments Off on Make your own “Better Life Index”
May 252011
 

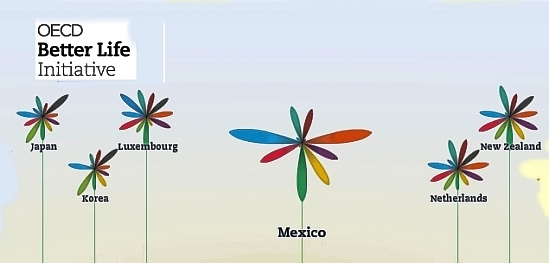
An interactive graph from the OECD (Organisation for Economic Co-operation and Development) now allows you to compile your own “Better Life Index” and compare “well-being” across the 34 member countries of the OECD. From an educational perspective, the graph offers hours of fun and fact-filled learning opportunities.

Better Life Index

The graph allows you to set individual weightings for each of 11 variables considered by the OECD to be important for well-being, and then see how the 34 countries rank on a graph. The graphs can be arranged either by rank or by country name. The 11 variables are:

  • housing
  • income
  • jobs
  • community
  • education
  • environment
  • governance
  • health
  • life satisfaction
  • safety
  • work-life balance

The symbols for each country are a flowers with 11 petals, one for each variable, where the length of the petal represents that country’s score and the width of the petal reflects the weighting you’ve given it.

This would be a great starting point for discussions of what “well-being” really means, and why different people (different countries?) would choose very different weightings for the 11 variables.

Related posts:

Various simple and compound development indices are discussed in chapters 29 and 30 of Geo-Mexico: the geography and dynamics of modern Mexico. Ask your local library to purchase a copy today!

Mexican migrant farmworkers in the USA

 Mexico's geography in the Press, Teaching ideas  Comments Off on Mexican migrant farmworkers in the USA
Mar 152011
 

The Economist (December 18-31, 2010) has a three-page article about migrant Mexican farmworkers, entitled “Fields of tears: they came to America illegally, for the best of reasons” (subscription required for web access).

This article is a great educational resource, offering dozens of possible debating points. It relates the adventures and misadventures of a young family from the state of Oaxaca, following them from their initial decision to leave for “El Norte” (USA) to their successive attempts to cross the border. They finally succeeded and “joined the vast undocumented workforce that undergirds America’s food supply”.

The Economist correspondent toiled alongside Mexican field workers as they picked strawberries in temperatures of up to 40 degrees C. (100 degrees F). The article goes on to consider the lifestyles of migrants, their access to services such as education and health care, and the degree to which they are welcomed by native-born Americans.

Looking at the life and motivation of a single family is a highly effective way of gaining familiarity with the multitude of issues related to the major flow of migrants from Mexico to the USA.

Previous posts related to Mexico-USA migration:

Migration between Mexico and the USA is the focus of chapter 25 of Geo-Mexico: the geography and dynamics of modern Mexico. Ask your library to buy a copy of this handy reference guide to all aspects of Mexico’s geography today! Better yet, order your own copy…

Geography research in Oaxaca funded by the US military stirred up a storm of protest

 Other, Teaching ideas  Comments Off on Geography research in Oaxaca funded by the US military stirred up a storm of protest
Feb 282011
 

In 2005, a geography research project known as México Indígena, based at the University of Kansas, received 500,000 dollars in funding from the US Defence Department to map indigenous villages in two remote parts of Mexico, in collaboration with the Autonomous University of San Luis Potosí , Radiance Technologies (USA), SEMARNAT (Mexico’s federal environmental secretariat) and partnered with the US Foreign Military Studies Office (FMSO).

Under some circumstances, this might not be a huge problem. After all, the large-scale survey maps of many countries were developed primarily by military engineers with military funding, in the interests of national security. In the past, several countries, including France and the UK, extended their map-making to cover their colonies or dependent territories.

What sets México Indígena apart is that, between 2005 and 2008, under the guise of “community participatory mapping”, US researchers, funded by the US military, collected detailed topographic, economic and land tenure information for several villages in Mexico, an autonomous nation, whose people have long viewed their northern neighbors with considerable suspicion. After all, in the mid-19th century, the USA gained a large portion of Mexico’s territory.

The indigenous villages mapped were in the Huasteca region of San Luis Potosí, and in the Zapotec highlands of Oaxaca, the most culturally diverse state in Mexico. The villages mapped in Oaxaca included San Juan Yagila and San Miguel Tiltepec.

México Indígena is part of a larger mapping project, the Bowman Expeditions. In the words of the México Indígena website:

“The First Bowman Expedition of the American Geographical Society (AGS) was developed in Mexico…  The AGS Bowman Expeditions Program is based on the belief that geographical understanding is essential for maintaining peace, resolving conflicts, and providing humanitarian assistance worldwide.”

“The prototype project in Mexico is producing a multi-scale GIS database and digital regional geography, using participatory research mapping (PRM) and GIS, aiming at developing a digital regional geography, or so-called “digital human terrain,” of indigenous peoples of the country.”

Mexico’s indigenous communities are the poorest in the country, beset by poverty, poor access to education and health care, and limited economic opportunities. Among the common concerns voiced by protesters against the mapping project were that the information collected could be used for:

  1. Counter-insurgency operations
  2. Identification and subsequent acquisition of resources
  3. Biopiracy

Despite attempts at clarification by the project leaders, some communities remain upset, claiming that they were not made aware of the US military’s funding, and have demanded that all research findings either be returned to the community or destroyed (see, for example, this open letter from community leaders in San Miguel Tiltepec).

Choose the conclusion you prefer:

1. Mexico’s indigenous peoples face enough challenges already. Their best way forward is if US military funding for mapping beats a hasty retreat, or

2. Mexico’s indigenous peoples face enough challenges already. Their best way forward is to welcome and embrace offers of help from outside their community.

Further reading/viewing:

The México Indígena controversy is the subject of a short film entitled, “The Demarest Factor: US Military Mapping of Indigenous Communities in Oaxaca, Mexico”. The film investigates the role of Lt. Col. Geoffrey B. Demarest ( a US Army School of the America’s graduate) and the true nature of the mapping project. It discusses parallels between US political and economic interests within the North American Free Trade Agreement (NAFTA) and a US military strategy designed to secure those very interests.

Things to think about:

  • Should academic research in foreign countries ever be funded from military sources?
  • Does the right of self-determination mean that indigenous peoples can refuse to cooperate with academic researchers, even when the research may bring benefits to the community?
  • Should researchers ever be allowed to collect information from a community without the community’s express consent?

The irony about the choice of “Bowman” for the AGS research expeditions.

Isaiah Bowman (1878-1950), born in Canada, was a US geographer who taught at Yale from 1905 to 1915. He became Director of the AGS in 1916, a position he only relinquished when appointed president of Johns Hopkins University in 1935. He served as President Woodrow Wilson’s chief territorial adviser at the Versailles conference in 1919. Bowman’s best known work is “The New World: Problems in Political Geography” (1921). His career has been subject to considerable scrutiny by a number of geographers including Geoffrey Martin (The life and thought of Isaiah Bowman, published in 1980) and Neil Smith who, in American Empire: Roosevelt’s Geographer and the Prelude to Globalization (2003) labels Bowman an imperialist, precisely the claim made by many of its opponents about the México Indígena mapping project.

The ten states in Mexico with the lowest population density

 Other, Teaching ideas  Comments Off on The ten states in Mexico with the lowest population density
Feb 172011
 

In a previous post we looked at “The ten states in Mexico with the highest population density“. At the end of that post, we suggested that you try to guess which 10 states in Mexico have the lowest population density. In this post, we look at the answer!

Below is a table showing the 10 states in Mexico with the lowest population density.

RankStatePopulation density (people/sq.km)
1Baja California Sur8.6
2Durango13.2
3Chihuahua13.7
4Campeche14.3
5Sonora14.7
6Coahuila 18.1
7Zacatecas19.8
8Quintana Roo29.9
9Nayarit38.9
10Oaxaca40.6

You probably got many of the answers right, since several of the states in the table are among Mexico’s largest states in terms of area. In fact, Mexico’s five largest states (Chihuahua, Sonora, Coahuila, Durango and Oaxaca, are all on the list. However, there are some surprises. For example, both Nayarit and Campeche are smaller than the average Mexican state. Why might this be so? Large parts of each state currently have very few residents. Much of Nayarit is either mountainous terrain or swampy, coastal wetland. A large part of Campeche is sparsely peopled tropical evergreen forest (tropical rainforest).

To conclude this brief look at population density, here is a map showing the population density of all Mexico’s 32 states. [For simplicity, we count the Federal District as a state.]

Population density map
Mexico’s population density in 2010

Several chapters of Geo-Mexico: the geography and dynamics of modern Mexico discuss population issues, including population distribution and population density. Buy your copy today to have a handy reference guide to all major aspects of Mexico’s geography!

The ten states in Mexico with the highest population density in 2010

 Other, Teaching ideas  Comments Off on The ten states in Mexico with the highest population density in 2010
Feb 102011
 

The table below shows the ten states in Mexico with the highest population density (people per square kilometer) in 2010.

Question:

  • Find a blank map of Mexico [click here for a printable pdf map of Mexico] and locate each of these ten states.
  • What do these ten states have in common?
  • Can you suggest a reason or reasons for any pattern you have found?

[the answer appears at the end of this post; no peeping until you have come up with an answer!]

RankStatePopulation density, 2010 (people/square km)
1Federal District5,936.8
2State of Mexico678.9
3Morelos364.2
4Tlaxcala292.6
5Aguascalientes211.0
6Guanajuato179.2
7Puebla168.5
8Querétaro156.2
9Hidalgo128.0
10Colima115.5

Did you suggest that these states are all small in area? If so, well done! The list of the ten states with the highest population density includes the eight smallest states in Mexico in terms of area, and all ten of the states are in Mexico’s twelve smallest states. The other two small  states, neither of which has a very high population density, are Nayarit and Tabasco; they are both smaller than either Puebla or Guanajuato.

Why should small states have higher population densities than large states? The main reason is because it is likely that a higher percentage of their area will be used for villages, towns and cities, and there will be less countryside (where population densities are usually very low) than is likely in large states. Of course, many other factors also play a part, including the location of resources (minerals, soil, water, biodiversity), the opportunities for employment and the relative wealth of the area (people may migrate from poorer areas to areas which they think are richer or offer more opportunities).

In a future post, we will take a look at which states in Mexico have the lowest population density.But, before we do, which states do YOU think will have the lowest population density? Choose your “top ten”, make a list or mark them on your map, and come back to Geo-Mexico next week to see if you are right…

How much longer will Mexico be an exporter of oil?

 Other, Teaching ideas  Comments Off on How much longer will Mexico be an exporter of oil?
Dec 152010
 

This interesting graph comes from a report published earlier this year by the Mexican Institute for Competitiveness (Instituto Mexicano para la Competitividad, IMCO). The purple line shows Mexico’s oil consumption in thousands of barrels/day from 2005 to 2009, with predicted values for the period 2010 to 2025. The yellow line shows Mexico’s oil production for the same period.

Graph of Mexico's oil production and consumption

Mexico's oil production (yellow) and consumption (purple), 2005-2025. Graph: IMCO.

Discussion questions:

  • In which year is Mexico’s consumption of oil predicted to equal its production?
  • What effects is this likely to have on Mexico’s economy?
  • What factors might cause this date to occur earlier than predicted?
  • What factors might cause this date to occur later than predicted?

A national map and summary of the methodology behind these rankings are provided in an earlier post:

For full details of the study:

Mexico’s economy and workforce are analyzed in chapters 14 to 20 of Geo-Mexico: the geography and dynamics of modern Mexico. Ask your library to buy a copy of this handy reference guide to all aspects of Mexico’s geography today! Better yet, order your own copy, which will still arrive in time for Christmas…

Dec 122010
 

The map below shows the average number of inhabitants per household (“household size”) for each of Mexico’s states.

The national average household size is 3.9 persons. The middle band on the map shows those states with household size between 3.7 and 4.0 inclusive. The darkest shade shows states with a household size of 4.1 or greater; the lightest shade shows those with a household size of 3.6 or smaller.

Average household size in Mexico, 2010

Average household size in Mexico, 2010. Cartography: Tony Burton; all rights reserved.

Discussion questions:

  • Compare this map with the maps of:
  1. potable water,
  2. GDP/person
  3. infant mortality
  • Discuss the possible reasons for any connections you note between household size, potable water, GDP/person and infant mortality.
  • What other factors might also affect household sizes?
  • What are the drawbacks to using any of these measures (household size, potable water, GDP/person, infant mortality) on their own as a development indicator?

Development indices of various kinds are discussed in chapters 29 and 30 of Geo-Mexico: the geography and dynamics of modern Mexico. Ask your local library to purchase a copy today!

Where in Mexico do people still lack access to potable water?

 Maps, Teaching ideas  Comments Off on Where in Mexico do people still lack access to potable water?
Nov 162010
 

The map shows the 14 states in Mexico where less than 90% of the population has potable water in their homes.

map of potable water in Mexico

The 14 states with poorest potable water access in Mexico

How does the distribution of state with relatively poor access to potable water compare with maps of:

Development indices of various kinds are discussed in chapters 29 and 30 of Geo-Mexico: the geography and dynamics of modern Mexico. Ask your local library to purchase a copy today!

Which states in Mexico have the highest infant mortality rates?

 Maps, Other, Teaching ideas  Comments Off on Which states in Mexico have the highest infant mortality rates?
Nov 122010
 

Infant mortality is the number of deaths of infants (aged less than 1 year old) for every 1,000 live births. It is widely regarded as a very useful development indicator, and is one of the statistics used when calculating compound (multifactor) development indices. The Federal District has the lowest infant mortality rate in the county – 13.8, ahead of Nuevo León (14.0), Coahuila (14.8) and Baja California (14.9).

RankStateInfant mortality rate
22Michoacán20.0
23Campeche20.1
24Zacatecas20.3
25San Luis Potosí20.5
26Tabasco20.9
27Puebla20.9
28Hidalgo21.3
29Veracruz21.6
30Guerrero24.4
31Oaxaca24.6
32Chiapas25.3

The table lists the 11 states in Mexico which have the highest rates of infant mortality. No other state has an infant mortality rate of 20.0 or higher. The map clearly reveals that these states are mostly in the south of Mexico, a long way from the USA border.

Map of infant mortality

The eleven states with the highest infant mortality rates

Compare this map with the map of GDP/person. Are there any states which appear to be anomalies to the general rule that GDP/person and infant mortality rates are inversely related?

Development indices of various kinds are discussed in chapters 29 and 30 of Geo-Mexico: the geography and dynamics of modern Mexico. Ask your local library to purchase a copy today!