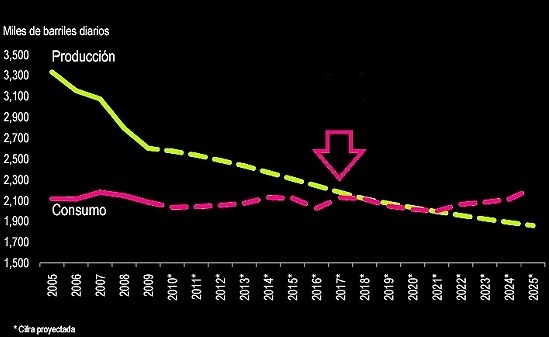
This interesting graph comes from a report published earlier this year by the Mexican Institute for Competitiveness (Instituto Mexicano para la Competitividad, IMCO). The purple line shows Mexico’s oil consumption in thousands of barrels/day from 2005 to 2009, with predicted values for the period 2010 to 2025. The yellow line shows Mexico’s oil production for the same period.
Discussion questions:
- In which year is Mexico’s consumption of oil predicted to equal its production?
- What effects is this likely to have on Mexico’s economy?
- What factors might cause this date to occur earlier than predicted?
- What factors might cause this date to occur later than predicted?
A national map and summary of the methodology behind these rankings are provided in an earlier post:
For full details of the study:
Mexico’s economy and workforce are analyzed in chapters 14 to 20 of Geo-Mexico: the geography and dynamics of modern Mexico. Ask your library to buy a copy of this handy reference guide to all aspects of Mexico’s geography today! Better yet, order your own copy, which will still arrive in time for Christmas…

Sorry, the comment form is closed at this time.