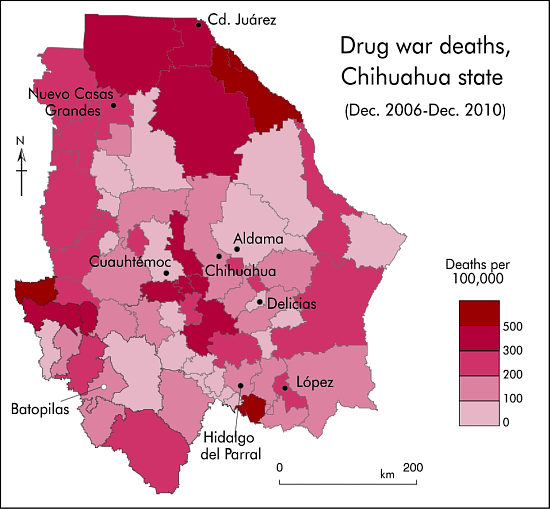
The map (below) of drug war death rates for the 67 municipalities of Chihuahua reveals a rather complicated pattern that is not amenable to easy explanation.
There is a clear cluster of very high death rate municipalities around Ciudad Juárez, which has for years been the main focus of drug violence in Mexico.
There is also a group of high death rate municipalities west and south of Chihuahua City suggesting that it might be a center of significant drug cartel activity.
The reason for high death rate areas on the western and southern borders of Chihuahua is not readily apparent from the map, though they do coincide with the area of lowest HDI (Human Development Index) scores in the state (see Geo-Mexico, figure 29.3).
This south-western part of the state forms part of the Western Sierra Madre physiographic region (see map linked to above), an area of rugged relief with limited highway connections where rivers have carved giant canyons (such as the Copper Canyon system) into the forested plateaus and mountains. The “culture of violence” in this region, sometimes called Mexico’s “Golden Triangle”, was analyzed by Carlos Mario Alvarado in “La [Sierra] Tarahumara, una tierra herida: análisis de la violencia en zonas productoras de estupefacientes en Chihuahua” (The Tarahumara Sierra, a wounded land: analysis of the violence in narcotic drug production zones in Chihuahua) published by the state government in 1966.
Alvarado found that between 1988 and 1993, in the southernmost municipality of Guadalupe y Calvo and in neighboring drug-growing municipalities, murders had a bimodal distribution each year, with peaks in April-May-June (when poppies and marijuana are planted) and September-October-November (when they are harvested). The four-year drug-violence death-rate for those municipalities in the early 1990s was significantly higher than the four-year drug war deaths ration shown on the map for 2006-2010.
Guadalupe y Calvo, “one of the most violent municipalities in Mexico”, had a four-year rate for 1991-1994 of about 510/100,000 inhabitants. Batopilas’s rate, 478/100,000, was almost as high. The rate in Morelos, sandwiched between these two municipalities, was over 700/100,000. On this limited evidence, it does not appear that this region has actually become any more violent than it used to be!
Returning to the map, it is also interesting that there are some relatively low death rate areas along the rather isolated Mexican-USA border in eastern Chihuahua. Careful analysis of the Chihuahua highway network does not provide any real insights to explain the mapped pattern.
There is some good news. For the 2007-2010 period, five of Chihuahua’s 67 municipalities did not experience a single drug war related death, though they are all very small municipalities with an average population of about 2,000.
Finally, we should remember that even the lightest areas on the map represent municipalities with death rates quite high compared to the rest of Mexico. Five of the municipalities in this group of 18 have death rates over twice the national average and 12 are above the average.
Previous posts in this mini-series:
- Are communities in Mexico which have large numbers of foreigners affected by the war against drugs?
- Which communities in Mexico have the highest rates of drug war deaths?
- Is drug war violence concentrated in Mexico’s largest cities?
- Deaths from war on drugs have increased rapidly since 2006
- The rates of drug war deaths vary enormously in Mexico’s states
Geo-Mexico: the geography and dynamics of modern Mexico discusses drug trafficking in several chapters. A text box on page 148 looks at trends in the drug trafficking business and efforts to control it. Buy your copy today to have a handy reference guide to all major aspects of Mexico’s geography!
One Response to “The geography of drugs-related deaths and violence in the state of Chihuahua”
Sorry, the comment form is closed at this time.

This is often a extremely good read for me, Must admit you’re one from the very best bloggers I ever saw.Thanks for posting this informative article.