Mexico’s population: now over 117 million and expected to peak at about 138 million

 Updates to Geo-Mexico  Comments Off on Mexico’s population: now over 117 million and expected to peak at about 138 million
Feb 282013
 

Mexico’s population in January 2013 was 117.4 million; 57.3 million males (48.8%) and 60.1million (51.2%) females according to a December 10, 2012 report by CONAPO (Consejo Nacional de Población) in Proyecciones de la población de México 2010-2050”. By January 2014 it will grow by over a million to 118.6 million. However demographic trends indicate that population growth in Mexico is declining significantly.

The birth rate is expected to fall from 19.7 births per 1,000 population in 2010 to 14.0 in 2050. As the Mexican population ages the death rate is projected to increase from 5.6 per 1,000 in 2010 to 9.2 in 2050. Consequently the annual rate of natural population growth is expected to decline from 1.41% in 2010 to 0.48% in 2050. Extrapolating the trends from the CONAPO projection suggests that death rates will surpass birth rates sometime in the by 2070s and natural population change will become negative. Of course, we must also take emigration into account.

According to the CONAPO report net emigration from Mexico was 321,000 in 2012, though some have noted that due to the Great Recession net emigration to the USA is near zero or less [Pew Research Center’s “Net Migration from Mexico Falls to Zero – and Perhaps Less”]. CONAPO expects net emigration to peak at about 689,000 by 2020 and then gradually decline to 590,000 by 2050. Given the current low levels of emigration to the USA and the rapid growth of the Mexican economy, some feel that these levels are rather high.

As a result of trends in birth rates, death rates and emigration, Mexico’s population growth rate is declining. Annual population growth is expected to fall below a million in 2017, below 500,000 in 2032 and below 100,000 by 2049. Extrapolating the rates in the CONAPO projection, Mexico’s population growth is expected to peak in 2053 at 137.6 million and then start to gradually decline. Of course, it is very difficult to accurately project emigration figures. If emigration is a third less than projected by CONAPO, then Mexico’s population could peak at 145 million.

Related posts:


Apr 042011
 

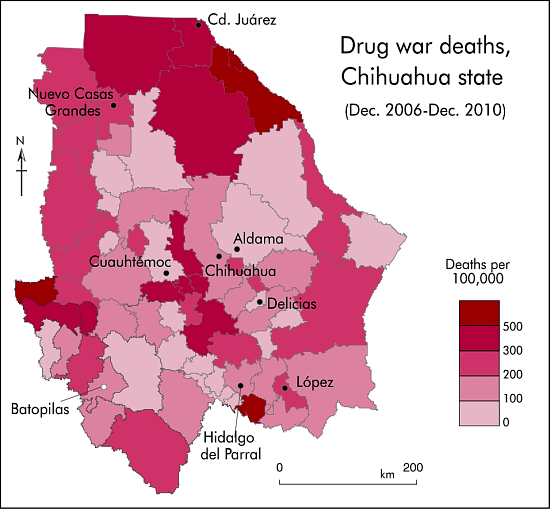
The map (below) of drug war death rates for the 67 municipalities of Chihuahua reveals a rather complicated pattern that is not amenable to easy explanation.

There is a clear cluster of very high death rate municipalities around Ciudad Juárez, which has for years been the main focus of drug violence in Mexico.

Drug war deaths in the state of Chihuahua
Drug war deaths in Chihuahua (Dec. 2006—Dec. 2010). Cartography: Tony Burton; all rights reserved.

There is also a group of high death rate municipalities west and south of Chihuahua City suggesting that it might be a center of significant drug cartel activity.

The reason for high death rate areas on the western and southern borders of Chihuahua is not readily apparent from the map, though they do coincide with the area of lowest HDI (Human Development Index) scores in the state (see Geo-Mexico, figure 29.3).

This south-western part of the state forms part of the Western Sierra Madre physiographic region (see map linked to above), an area of rugged relief with limited highway connections where rivers have carved giant canyons (such as the Copper Canyon system) into the forested plateaus and mountains. The “culture of violence” in this region, sometimes called Mexico’s “Golden Triangle”, was analyzed by Carlos Mario Alvarado in “La [Sierra] Tarahumara, una tierra herida: análisis de la violencia en zonas productoras de estupefacientes en Chihuahua”  (The Tarahumara Sierra, a wounded land: analysis of the violence in narcotic drug production zones in Chihuahua) published by the state government in 1966.

Alvarado found that between 1988 and 1993, in the southernmost municipality of Guadalupe y Calvo and in neighboring drug-growing municipalities, murders had a bimodal distribution each year, with peaks in April-May-June (when poppies and marijuana are planted) and September-October-November (when they are harvested). The four-year drug-violence death-rate for those municipalities in the early 1990s was significantly higher than the four-year drug war deaths ration shown on the map for 2006-2010.

Guadalupe y Calvo, “one of the most violent municipalities in Mexico”, had a four-year rate for 1991-1994 of about 510/100,000 inhabitants. Batopilas’s rate, 478/100,000, was almost as high. The rate in Morelos, sandwiched between these two municipalities, was over 700/100,000. On this limited evidence, it does not appear that this region has actually become any more violent than it used to be!

Returning to the map, it is also interesting that there are some relatively low death rate areas along the rather isolated Mexican-USA border in eastern Chihuahua. Careful analysis of the Chihuahua highway network does not provide any real insights to explain the mapped pattern.

There is some good news. For the 2007-2010 period, five of Chihuahua’s 67 municipalities did not experience a single drug war related death, though they are all very small municipalities with an average population of about 2,000.

Finally, we should remember that even the lightest areas on the map represent municipalities with death rates quite high compared to the rest of Mexico. Five of the municipalities in this group of 18 have death rates over twice the national average and 12 are above the average.

Previous posts in this mini-series:

Geo-Mexico: the geography and dynamics of modern Mexico discusses drug trafficking in several chapters. A text box on page 148 looks at trends in the drug trafficking business and efforts to control it. Buy your copy today to have a handy reference guide to all major aspects of Mexico’s geography!

Feb 092011
 

Previous posts in this mini-series analyzed the recently released data on drug war deaths for Mexican states, the largest cities, and the communities with the highest death rates per 100,000 population. This post looks into the number and rates of drug war deaths for 25 communities with large numbers of non-Mexican (ex-pat) residents or visitors. Drug war deaths include deaths of drug cartel members, law enforcement personnel, and innocent by-standers.

Drug war death rates of larger communities of particular ex-pat interest were addressed in an earlier blog which focused on municipalities with populations over 750,000. The table (link above) indicates the number drug war related deaths (from December 2006 through December 2010) and the rate per 100,000 population in the 25 municipalities.

In general, these municipalities have death rates below the national average. The rates for Xalapa, La Paz, and Los Cabos are less than one eighth the national average. Those for Guanajuato and San Miguel de Allende are almost as good. Apparently, foreigners in these communities have relatively little to worry about with regard to drug war violence.

Only six of the 25 have death rates above the national average. Mazatlán has the highest drug war death rate, about four times the rate for all of Mexico, but still less than a fourth that of Ciudad Juárez. The rate for Playas de Rosarito is also very high, even higher than that of its northern neighbor Tijuana. Interestingly, its southern neighbor Ensenada has a low rate, about one eighth that Playas de Rosarito.

The drug war death rate for Tepic, Nayarit is over twice the national average. The rates are also relatively high for Cuernavaca and Nuevo Laredo. Actually, the rate for Nuevo Laredo is less than most of the smaller municipalities surrounding it. There is considerable variation among three adjoining municipalities near Lake Chapala: Ixtlahuacan (43.8), Jocotepec (28.5) and Chapala (18.4). All three have rates many times higher than the nearby city of Guadalajara (9.7).

I wonder how much these drug war death rates are affecting or will affect the choices that foreigners make concerning where to live or where to vacation in Mexico?

Previous posts in this mini-series:

Related posts about the geography of drug trafficking and drug cartels in Mexico:

Geo-Mexico: the geography and dynamics of modern Mexico discusses drug trafficking in several chapters. A text box on page 148 looks at trends in the drug trafficking business and efforts to control it. Buy your copy today to have a handy reference guide to all major aspects of Mexico’s geography!

Which communities in Mexico have the highest rates of drug war deaths?

 Updates to Geo-Mexico  Comments Off on Which communities in Mexico have the highest rates of drug war deaths?
Feb 052011
 

Guadalupe, in the state of Chihuahua, with 139 deaths among a population of only 6,458, has the highest drug war death rate in Mexico: 2,152 drug deaths per 100,000 population. Mier (Tamaulipas) and General Treviño (Nuevo León) are not far behind. Most of the municipalities in the attached table (link below) have rather small populations; 15 of the municipalities had fewer than 6,500 inhabitants in 2010.

A previous post noted that among big cities, Ciudad Juárez had the highest rate of drug war deaths by far, over twice the rate for the runner-up Culiacán in Sinaloa. However, Ciudad Juárez ranks only 10th when smaller municipalities are included in the analysis. The table lists the 20 municipalities with the highest rates of drug war related deaths (from December 2006 through December 2010) per 100,000 population. Drug war deaths include deaths of drug cartel members, law enforcement personnel, and innocent by-standers.

All 20 municipalities listed in the table are in one of four border states: Chihuahua, Sonora, Nuevo León and Tamaulipas. In fact, half of the 20 municipalities are in the state of Chihuahua. Five form a cluster around Ciudad Juárez on the border and four are just south of Chihuahua City. The three in Tamaulipas and three in Nuevo León are bunched together between Nuevo Laredo and Reynosa within 60 kilometers of the border. Three of the four in Sonora are not far from the highway joining the state capital Hermosillo with Nogales on the US border.

Previous posts in this mini-series:

Related posts about the geography of drug trafficking and drug cartels in Mexico:

Geo-Mexico: the geography and dynamics of modern Mexico discusses drug trafficking in several chapters. A text box on page 148 looks at trends in the drug trafficking business and efforts to control it. Buy your copy today to have a handy reference guide to all major aspects of Mexico’s geography!

Is drug war violence concentrated in Mexico’s largest cities?

 Updates to Geo-Mexico  Comments Off on Is drug war violence concentrated in Mexico’s largest cities?
Feb 012011
 

It is commonly believed that crime and murder rates are highest in the largest cities. Is this the case for Mexican drug war deaths? Recently available data (from Mexican government) on drug war deaths indicate that this generalization is definitely NOT TRUE for Mexico’s largest cities. Drug war deaths include deaths of drug cartel members, law enforcement personnel, and innocent by-standers.

True, the largest numbers of deaths were recorded in some of the larger cities: Ciudad Juárez (6,637 deaths), Culiacán in the state of Sinaloa (1,890), Tijuana (1,667), Chihuahua City (1,415), and Acapulco (661). On the other hand, the number of deaths per 100,000 population was four to five times higher in some small municipalities in the states of Chihuahua, Sonora, Tamaulipas, and Nuevo León. A future post will take a more in-depth look at the drug war death rates in these smaller communities.

In this post, we consider only those Mexican municipalities whose 2010 population exceeded 700,000. The table below indicates drug war death rates per 100,000 population since December 2006 for the 22 Mexican municipalities with 2010 populations over 700,000. It is no surprise that the rate for Ciudad Juárez (484.7) is the highest, about 16 times the national average of 30.8. The city accounted for about 30% of the country’s drug war deaths during the four year period. In general, the cities with the highest rates are in the northern or western areas with concentrated drug cartel activity. However, Saltillo in the northern state of Coahuila has one of the lowest rates.

Only six of the largest 22 municipalities in the table have death rates above the national average. Monterrey is just below the average, Guadalajara is less than a third the average and Mexico City is less than a quarter. Two Mexico City suburbs, Nezahualcoyotl and Ecatepec in the State of Mexico, have rates nearly twice that of the capital, but are still less than half the national average. Zapopan, a suburb of Guadalajara has a rate 36% higher than Guadalajara.

Puebla, the center of the fourth largest metropolitan area in the country has an extremely low rate, less than 3% of the national average. Querétaro and Mérida also have very low rates.

Our next post in this mini-series will look at the smaller municipalities which tend to have the highest drug war death rates of all.

Previous posts in this mini-series:

Related posts about the geography of drug trafficking and drug cartels in Mexico:

Other relevant link

Geo-Mexico: the geography and dynamics of modern Mexico discusses drug trafficking in several chapters. A text box on page 148 looks at drug trafficking business and efforts to control it. Buy your copy today to have a handy reference guide to all major aspects of Mexico’s geography!

The rates of drug war deaths vary enormously in Mexico’s states

 Updates to Geo-Mexico  Comments Off on The rates of drug war deaths vary enormously in Mexico’s states
Jan 292011
 

Despite what some media reports might suggest, not all parts of Mexico are plagued with serious drug war violence. A previous post – Deaths from war on drugs have increased rapidly since 2006 – discussed which states accounted for the most drug war deaths during the last four years and noted that these states were mostly in northern and western Mexico. The data on drug war deaths include deaths of drug cartel members, law enforcement personnel, and innocent by-standers.

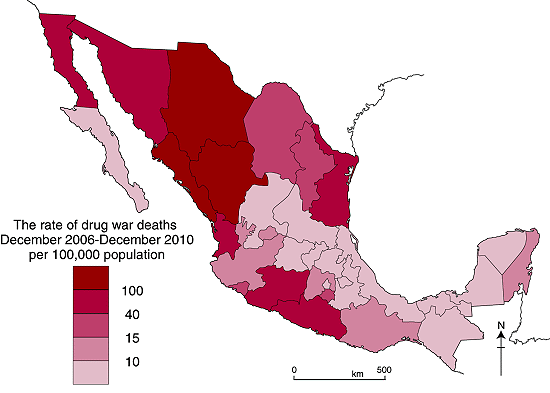
A more accurate way to compare states is to incorporate population to determine the rates of drug war deaths. The table above, and the map below, were compiled using the recently released data on deaths and the preliminary results of the 2010 census. There are some obvious methodological issues associated with combining drug war death figures for a four-year period with a population “snap shot” taken in mid-2010, but we believe these issues are minor and will not have any significant effect on the broad patterns of drug war deaths that the analysis reveals.

Drug war death rates, by state, December 2006-December 2010

The national average rate is 30.81 deaths per 100,000 population. It is not surprising that the State of Chihuahua, which led the country with 10,135 deaths, had the highest rate, almost 300 deaths per 100,000 population. The rate for Chihuahua is almost ten times the rate for the country as a whole. The rates for the other leading drug war states are significantly smaller, but way above the national average.

The four most populous states, Mexico, Federal District, Veracruz and Jalisco, are centrally located and have death rates ranging from half the national average for Jalisco down to about a fifth for Veracruz. Interestingly, for these four states the rates decline from west to east. This pattern does hold when less populous intervening states are included. Two of these, Querétaro and Puebla have about the lowest rates in the country, about one-fifteenth the national average.  Yucatán also has a very low rate. The drug war death rates for Tlaxcala, Puebla and Yucatán are less than one half of one percent of the rate in Chihuahua. Clearly, some parts of the country are far more affected by drug wars than others.

Previous post in this mini-series:

Related posts about the geography of drug trafficking and drug cartels in Mexico:

Other relevant link

Geo-Mexico: the geography and dynamics of modern Mexico discusses drug trafficking in several chapters. A text box on page 148 looks at the drug trafficking business and efforts to control it. Buy your copy today to have a handy reference guide to all major aspects of Mexico’s geography!

Maternal health in southern Mexico

 Mexico's geography in the Press  Comments Off on Maternal health in southern Mexico
Jul 282010
 

A short piece in The Economist entitled “Maternal Health in Mexico: A perilous journey” (26 June 2010) highlights some of the reasons why maternal mortality has remained stubbornly high in southern Mexico, despite a marked improvement in recent years. Since 1990, maternal mortality (death related to childbearing) has fallen by 36% in Mexico as a whole.
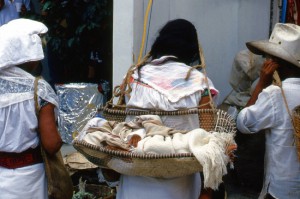
Maternal mortality remains alarmingly high

Carrying the future; maternal mortality remains alarmingly high. Photo: Tony Burton. All rights reserved. Click to enlarge.

Any average figure for the whole country disguises enormous regional differences. Rates for the richer inhabitants in the more developed regions in Mexico are comparable to rate in the USA or Canada. However, rates in the impoverished southern states such as Chiapas, Oaxaca and Guerrero are up to 70% higher than the national average.

In the words of the Research for Development blog “In 2005 the maternal mortality rate was 63.4 deaths per 100,000 live births. In the state of Guerrero the rate rose to 128 deaths per 100, 000 live births. Both figures are a long way from Mexico’s commitment under the Millennium Development Goals (MDGs) of 22.3.” Click here to see how well Mexico is doing in meeting other MDGs.

One study found that in the year 2000, only 44.8% of women in Chiapas gave birth with a doctor present; 49.4% did so with midwives, and the remaining 5.8% were attended by family members or give birth alone.

As The Economist article emphasizes, indigenous women are only one-third as likely to survive giving birth as non-indigenous women.

Why is this? What are the key factors preventing lower maternal mortality rates?

The Economist singles out:

  • means of transport – lack of a car means a total reliance on public transport. Public transport is poor in many remote areas
  • poor roads – many rural roads are unpaved, and the terrain in much of Mexico means than travel times are often much longer than might be expected
  • the expense of the hospital tests and medical supplies which can save a mother’s life
  • errors in delivery care or hospital procedures – according to The Economist, “40% of urban maternal deaths are caused by using the wrong medicine, by botched surgery or by other forms of malpractice.”
  • reluctance to see a male doctor (for social or cultural reasons)
  • language issues – many indigenous women do not speak Spanish at all well, if at all, and very few doctors have any knowledge of indigenous languages, so communication is often poor

What is needed to reduce maternal mortality rates? Understandably, The Economist focuses its attention on financial or economic solutions. More money is needed, it argues, for “midwifes and contraceptives.” It reports that increased funds are coming from a variety of sources, including the Spanish government, Carlos Slim (the Mexican entrepreneur who is the world’s richest man) and from the Bill and Melinda Gates Foundation. Between them, they have announced plans to spend 150 million dollars “on health care for the poor in Central America and southern Mexico”.

In addition, the article calls for investment in “infrastructure, health and education”, making the claim that investment in these areas would help the south catch up with the rest of the country.

We consider this analysis of possible remedies for the problem to be incomplete. The political will to continue making investments in health care installations and personnel over the long-term requires, in our opinion, a significant shift in attitudes among the wealthier and more influential sectors of Mexican society.

At present most members of the wealthy elite regard indigenous Mexicans as second class citizens.

At the time of the Chiapas uprising in 1994, for example, a subset of well-educated Mexicans called on the government to resolve the problems the nation faced in southern Mexico once and for all by using maximum force to re-establish complete military control over the area. Fortunately, the government of the day did not follow their advice but opted for alternative approaches such as dialogue.

Mexico’s indigenous peoples are rarely shown on TV or in advertisements. Instead, most firms prefer to picture blond, blue-eyed mestizos. Alongside increased financial investment in the south, a massive shift in public perception is required. For everyone’s sake, let us hope that this can be achieved with a minimum of turmoil.

Mexico’s government has to make tough choices about how far the national budget can stretch, and which things should be prioritized. Decisions are often based on political expediency as much as on the nation’s pressing development needs. Indigenous peoples are not well represented in federal government.

At present, the best-trained physicians and nurses aspire to work in the world class medical facilities in Mexico’s major cities. Health care workers in Mexico’s remote areas are often there only to fulfill the social service requirements for their professional qualification; they perform valuable work, but certainly have no long-term commitment to these regions. In the words of a MacArthur Foundation researcher (quoted in “Evaluation of The MacArthur Foundation’s Work in Mexico to Reduce Maternal Mortality, 2002-2008”) , qualified doctors (residents) “see their work as a big favor they do for the community, rather than understanding that indigenous populations in our country also have a right to health.”

We believe that a change in how society perceives indigenous peoples is a fundamental prerequisite for genuine long-term change, particularly in states such as Chiapas and Oaxaca.

Mexico’s indigenous populations, and the disparities in wealth and opportunity they face, are analyzed in chapters 10 and 29 of Geo-Mexico: the geography and dynamics of modern Mexico. Ask your local or university library to buy a copy today!!
May 152010
 

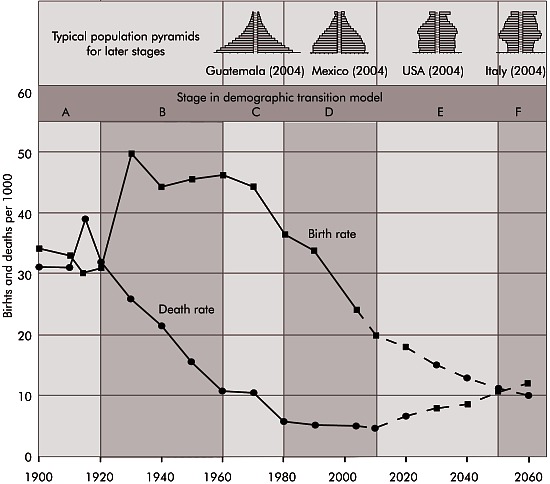
Mexico’s population exploded in the mid-20th century as death rates plummeted and birth rates remained high.  From 1940 to 1980, the number of Mexicans more than quadrupled from under 20 million to over 80 million.  In the 1960s and 1970s the population growth was among the world’s fastest at 3.3% a year.  At this rate, the population doubles in less than 22 years.

Mexico's birth rates, death rates and demographic transition

Concerns about overpopulation resulted in a massive planning program which included health professionals, multimedia advertising, and messages is telenovelas (serialized TV dramas) and historietas (comic books).  As a result of this campaign and the demographic transition (the drop in fertility rates with modernization observed in all countries), the average number of children per woman dropped dramatically from 5.7 in 1976 to about 2.2 in 2010.  Mexico’s population should peak at about 120–130 million in about 2045.  This is a fairly large spread because accurately predicting future rates of immigration to the USA is very tricky.

Mexico’s natural increase now is about 1.5%, but actual increase (including immigration/emigration) was closer to 1% in 2006, 1.3% in 2008 and will probably be down to 1% again by 2011.

Mexico’s National Population Council (CONAPO) has projected a fertility rate of 2.1 for 2010, but international sources estimate it to be between 2.2 and 2.3 in 2010.

Mexico’s population dynamics are the subject of chapter 9 of Geo-Mexico: the geography and dynamics of modern Mexico; the importance of telenovelas and historietas is discussed in chapter 18.

Mar 112010
 

Some of Mexico’s key population indicators are listed below, with the latest estimates of the 2010 values for each indicator:

  • Total population –  108.4 million
  • Crude birth rate  – 17.8 / 1,000
  • Crude death rate – 5.0 / 1,000
  • Natural population growth rate – 1.28%/yr
  • Infant mortality rate – 14 / 1,000 live births
  • Total fertility rate – 2.1 children per woman of reproductive age
  • Life expectancy – 75 years (male  73 ; female 78)

Table 9.1 of Geo-Mexico: the geography and dynamics of modern Mexico provides values for each of these indicators for the period from 1900 to 2000 inclusive, together with estimates (projections) for the period from 2010 to 2050.

Click here for a post about Mexico’s population age-sex pyramids for 1990, 2010 and 2050.