How can we measure the health of forests and other forms of natural vegetation? It has become commonplace to read about biodiversity and many conservation programs rightly stress its importance in the global scheme of things. In a previous post, we examined the biodiversity of Mexico and saw how it is one of the most biodiverse countries in the world.
Biodiversity may be a useful indicator of likely ecological resilience in the face of changing circumstances such as global climate change, but it does not tell the whole picture. In simple biodiversity measures, each species is counted and treated as being equally important. Species close to extinction are singled out for conservation efforts in an attempt to preserve a viable wild population of that species. If all else fails, specimens are transferred to botanical gardens or seeds are collected and stored in the hope that the species can be reintroduced and reestablished in a suitable location at some point in the future.
But are all plant species equal? Should a giant redwood count the same as a dandelion? Certainly in terms of their ability to store carbon, larger plants are more valuable than smaller plants, though the total number of each species also matters. Storing carbon is important. When trees are cut down and burned (to clear the way for agriculture or settlement, for example) this stored carbon is released into the air and contributes to the processes causing global warming.
The term biomass is used to describe the total mass of living organic matter in a plant or in an area. The total biomass of a plant includes its bark, leaves and twigs. In a tropical forest, biomass includes every tree, shrub, sapling, vine, epiphyte and flower. About 50% of the biomass in most forests is carbon. The amount of biomass varies seasonally and is not necessarily stable over time, since plants increase their biomass as they grow. In a forest, the balance that matters in terms of sustainable forestry is the balance between the forest’s production of “new” biomass (through photosynthesis) and the consumption of some of its biomass by chopping, burning and natural decay. Clearly, human activity can directly impact this balance, but so too can natural events such as forest fires.
Bio-geographers have a great interest in assessing biomass since it provides a starting point for numerous models that attempt to estimate the effects of releasing some, or all, of this stored carbon on future global climates. Increasingly, their estimates from the use of remote sensing and satellite images are proving to be quite reliable when tested by comparing them to the biomass of the same area calculated from on-the-ground fieldwork.
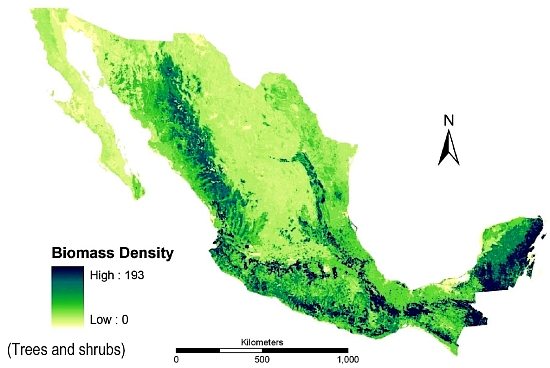
The measure of biomass shown on the map is biomass density. Biomass density is the total amount of above ground living organic matter expressed as oven-dry metric tons per hectare. This map immediately reveals why conserving Mexico’s southern rainforests is so important. They are not only the most biodiverse areas of Mexico, their high biomass density values show that they also have far more than their fair share of Mexico’s total biomass. Conserving and managing these forests therefore needs to be a priority strategy in Mexico’s efforts to limit and mitigate climate change.
Sources:
The map comes from “Advances of Mexico in preparing for REDD” by Bernardus H.J. de Jong, Leonel Iglesias Gutiérrez and José Armando Alanís de la Rosa. Presentation given at the UNFCCC Workshop on Methodological Issues relating to Reducing Emissions from Deforestation and Forest Degradation in Developing Countries. Tokyo, Japan, 25 to 27 June 2008.
To read more about estimating biomass, see Estimating Biomass and Biomass Change of Tropical Forests: a Primer. (FAO Forestry Paper – 134) by Sandra Brown. FAO Forestry Paper 134. 1997.
Related posts:
- The geography of wildfires in Mexico: the disastrous wildfire season of 2011
- Mexico’s mega-biodiversity
- The diversity of species (plants and animals) in Mexico
- Which areas of Mexico have the greatest biodiversity?
- Mexico’s vegetation zones. The link is to a pdf map (in color) of vegetation zones. The map (all rights reserved) is a color version of Figure 5.1 in Geo-Mexico.

Sorry, the comment form is closed at this time.