In several previous posts we have looked at specific migration channels connecting Mexico to the USA:
- From Morelos to Minnesota; case study of a migrant channel between Mexico and USA
- Migration channels between Mexico and the USA, or how distant towns are linked through migration
- Over half a million natives of the state of Puebla live in New York City
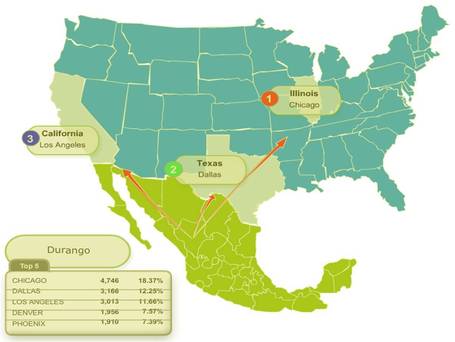
A Mexican government website, for its Institute for Mexicans Abroad, has lots of statistics about the number of Mexicans registered at each of Mexico’s consulates (which number more than 40) in the USA, together with their state of origin. A series of handy interactive maps for 2008, 2009 and 2010 provide a quick overview of some of the major flows.
- Mexicans registered in consulates in the USA, 2008
- Mexicans registered in consulates in the USA, 2009
- Mexicans registered in consulates in the USA, 2010
Hovering your mouse over any state in Mexico brings up details of which consulates in the USA attracted the highest number of registrations for migrants who originated from that state.
By way of illustration, consider the patterns shown using the 2010 map for migrants who originated in the three states (Campeche, Yucatán and Quintana Roo) forming the Yucatán Peninsula. It turns out that migrants from the state of Yucatán are far more concentrated than migrants from the other two neighboring states. About 60% of all migrants from the state of Yucatán who registered in Mexican consulates in the USA registered in either San Francisco, Los Angeles (both California) or Portland (Oregon).
For migrants from Campeche, the “top three” consulates are Omaha (Nebraska), Atlanta (Georgia) and Dallas (Texas), but these three account for only about 22% of all Campeche migrants registered with a consulate, meaning that the spread of migrants from Campeche is far less focused than that of migrants from Yucatán state.
In the case of Quintana Roo, the top three consulates for registrations are San Francisco (California), Atlanta (Georgia) and Dallas (Texas); these three account for almost 40% of all registrations of migrants from Quintana Roo.
Identifying a pattern, or variations between the patterns for several states is one thing; explaining it is another!
Q. What factors might influence the differences in patterns noted for the three states of the Yucatán Peninsula?
2 Responses to “Interactive maps offering some insights into Mexico-USA migration channels”
Sorry, the comment form is closed at this time.

The factors that might influence the differences in the patterns noted in the three states of the Yucatan Peninsula are: relatives; job opportunities; wages; better assistance from other migrants; assistance from other migrants in finding homes; and, assistance in border crossing (if required).
[…] In several previous posts we have looked at specific migration channels connecting Mexico to the USA: From Morelos to Minnesota; case study of a migrant… An excellent way to show examples of chain migration and the gravity model…students will understand the concepts with concretes examples. These interactive maps have crisp geo-visualizations of the migratory flows. […]