A recent publication from the public opinion research consultancy Mitofsky offers some insights into the distribution of different socio-economic groups within Mexico.
The Mitofsky study relies on the AMAI 10×6 system to tabulate the percentage of households in each state that fall into six distinct categories: A/B, C+, C, D+, D and E.
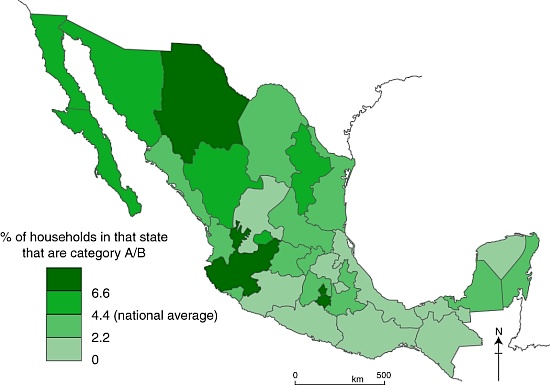
Across Mexico as a whole, 4.4% of households are categorized as A/B (the highest category, see map below), 12.3% as C+, 17.9% as C, 39.1% as D+, 21.6% as D and 4.7% as E (the lowest category).
The data show that, between them, four states–the Federal District (23.4% of all A/B households in Mexico), Jalisco (14.4%), State of México (9.3%) and Nuevo León (5.9%)– account for more than half of all the homes in this category in Mexico
The map shows how the incidence of A/B households (the highest socio-economic category) vary, state by state, across the country.
Do you live in an A/B household?
1. Housing characteristics:
– average of 6-8 rooms (often 3 bedrooms, 3 bathrooms) built of brick and/or concrete
– floors tiled, hardwood or stone; more likely to have carpets or rugs than lower categories
– most are owner-occupied, not rented
2. Sanitary Infrastructure
– connected to municipal potable water and sewer systems
– all have tub, shower, and water heater (usually using gas)
– two-thirds of these homes have water cisterns and pump to supply water tanks.
– some have air conditioning and/or central heating
3. Practical Infrastructure
– average 2 vehicles
– all have stoves, refrigerators and washing machines
– almost all have microwave ovens, blenders, toasters, coffee-makers and juice extractors
4. Communications and Entertainment Infrastructure
– almost all have fixed line telephones and cell phones
– most have 3 or 4 TVs and satellite or cable TV
– all have DVDs and stereos/CD players; half have video game consoles
– average more than 1 computers per household; 75% connected to Internet
– many have memberships of private sports clubs and own a second home or time-share.
– more than 50% have traveled by air at least once in last 6 months, and most travel overseas at least once a year
5. Educational and Occupational Profile of Head of Family
– usually has a bachelor’s degree or higher
– work in medium or large companies, as directors, CEOs or other high-ranking professionals
6. Expenditures
– these households save more, but also spend more on education, entertainment, communication and vehicles
– food purchases account for only 7% of total expenditures, well below the average for the total population
– of these food purchases, the proportion spent on dairy products, fruit, and drinks is greater than lower categories
Questions worth thinking about:
- How does this map compare to other maps on Geo-Mexico of inequalities across the country? (Use the site search feature or tags from the tag cloud on the left hand side of each page to find other inequality maps)
- To what extent does this map confirm that north-south divide described in several previous posts?
Source:
Niveles socioeconómicos por entidad federativa 2009 – 2010 by Roy Campos and Ana María Hernández; CONSULTA MITOFSKY, December 2010.
Related Posts:

Sorry, the comment form is closed at this time.