Aug 012016
 

The National Statistics Agency’s (INEGI’s) 2015 Survey of Socioeconomic Conditions includes data for average household incomes in Mexico, on a state-by-state basis. The national average household income (for a three month period) is $45,887 (pesos) . The map below shows how each state’s average household income compares to the national average.

Household income, by state, 2015. Data: INEGI. Cartography: Tony Burton / Geo-Mexico; all rights reserved

Household income, by state, 2015. Data: INEGI. Cartography: Tony Burton / Geo-Mexico

The state with the highest household income is Nuevo León, with $66,836, more than 140% of the national average. The state with the lowest household income is Guerrero ($27,584), where the average household income is only 60.1% of the national average. Guerrero’s average household income is only 41% of the average for Nuevo León.

As we have regularly highlighted in the past, regional differences in Mexico are considerable, and a definite “north-south divide”can be identified for almost every socio-economic variable. Development efforts need to be focused on improving the key indicators for southern Mexico and reducing these regional disparities.

Related posts:

Nov 192015
 

Proficiency in English is widely seen as an ever-more-essential skill in our increasingly-internationalized and business-oriented world. Many Mexicans have acquired excellent English, whether from education, family connections or residence abroad. It therefore comes as something of a shock to study the latest English Proficiency Index, put out by the Toronto-based organization,  Education First (EF).

Education First modestly describes itself as “The World Leader in International Education”. (This claim is rather grandiose, given that the International Baccalaureate, for one, is far larger and much better known in educational circles worldwide).

The 2015 edition of EF’s English Proficiency Index (EPI) “ranks 70 countries and territories based on test data from more than 910,000 adults who took our online English tests in 2014. This edition continues to track the evolution of English proficiency, looking back over the past eight years of EF EPI data.”

EF categorizes the level of English proficiency in different places as “very high”, “high”, “moderate”, “low” or “very low”.

English proficiency in Mexico

English proficiency in Mexico (grey = moderate; yellow = low; orange = very low). Credit: EF EPI, 2015

Strangely, Mexico does not do well on this index. According to EF, no state or city in Mexico performs beyond the “moderate” level (colored grey on the map). From the map, it appears that there is, in this context as in many others, something of a north-south divide in Mexico, with southern states under-performing in comparison with northern states.

The highest-scoring cities for English proficiency are Monterrey (53.59) and Mexico City (53.03), both classed as “moderate”, followed by Hermosillo (52.36), Tijuana (51.27), Guadalajara (50.52), Ciudad Juárez (49.35), and Mexicali (48.51), all classed as “low”. At the bottom end of proficiency, Puebla (47.84), Cancún (47.14), and Oaxaca (44.61) are all in the “very low” category.

EF recognizes that the people taking its tests are “self-selected and not guaranteed to be representative of the country as a whole. Only those people either wanting to learn English or curious about their English skills will participate in one of these tests. This could skew scores lower or higher than those of the general population.” On the other hand, it also claims that, “The EF English Proficiency Index is increasingly cited as an authoritative data source by journalists, educators, elected officials, and business leaders.”

That may be so, but given the EPI methodology and EF’s overblown claims of being “The World Leader in International Education”, perhaps we should take these results with a grain of salt ~ of which Mexico has lots!

Related posts:

Oct 282015
 

The 2015 survey of connectivity by Mexican consultancy Gabinete de Comunicación Estratégica (GCE) provides further support, if any were needed, of the north-south digital divide that we have commented on several times previously.

GCE carried out a telephone survey of 49,600 people, across the entire country, including respondents in the 76 largest cities. Respondents ranged in age from 18 to 50; 48% had a university degree and about the same percentage was categorized as “lower middle class”.

The survey question was “¿Cuenta usted con conexión a Internet?” (Do you have a connection to the Internet?)

At city level, Cancún was the most connected city. The two cities sharing the lowest levels of connectivity were Tlaxcala and Acapulco.

Cyber-connectivity in Mexico, 2015. Data: GCE 2015. Cartography: Geo-Mexico

Cyber-connectivity in Mexico, 2015. Data: GCE 2015. Cartography: Geo-Mexico

At state level (map), Baja California Sur led the way in terms of Internet users (84% of respondents claiming access to the Internet), followed by Nuevo León (81.5%) and Baja California (80.4%). (Note that the likely margin of error in results is plus or minus 4%.)

Guerrero is at the other end of the scale, with just 49% of residents online. After last-place Guerrero came Zacatecas, where 53% were connected, and Oaxaca with 55%.

Most Internet users in those three states used a desktop computer to connect. On average, most Internet users spent an hour or two a day online and social networks were the most popular destination for 20% of respondents. Facebook led the way among those networks with 74%, followed by WhatsApp with 12% and Twitter with 7%.

Another question in the survey asked which was the most trustworthy source for information: the Internet, television or newspapers. The Internet won with 28%, television came second with 25% and newspapers trailed with 24%. Frederico Berrueto Pruneta, general manager of GCE, asserts that, “What we are seeing is a very clear tendency where the Internet has won the battle over television, which had already won against newspapers”.

  • Full Report (Spanish, pdf): Connectivity in Mexico in 2015

Related posts:

An update on the Human Development Index in Mexico

 Updates to Geo-Mexico  Comments Off on An update on the Human Development Index in Mexico
Mar 192015
 

The latest United National Development Program (UNDP) report about the Human Development Index (HDI) in Mexico gives scores and ranks for each state. The full report, in Spanish, entitled “Índice de Desarrollo Humano para las entidades federativas, México 2015: Avance continuo, diferencias persistentes“, is readily available online, and is based on data up to and including 2012.

The HDI is a compound index based on several aspects of three major criteria: health, education and income.

HDI improved between 2008 and 2012 in all states except Baja California Sur. The greatest percentage increases in HDI were in Puebla (where HDI rose 3.7%), Chiapas (3.6%) and Campeche (3.6%). HDI in Baja California Sur fell 0.8%, mainly due to a lower score for education.

HDI in Mexico, with comparison countries for each state

HDI in Mexico, with comparison countries for each state. Click map to enlarge.

The pattern of HDI in Mexico, by state, is shown on the map. The highest HDI values in 2012 were for the Federal District with a score of 0.830, Nuevo León (0.790) and Sonora (0.779). At the other end of the spectrum, Chiapas had the lowest HDI (0.667), below Guerrero (0.679) and Oaxaca (0.681).

As noted previously on Geo-Mexico, the north-south divide in Mexico persists. In general, northern states, together with the Yucatán Peninsula states (Campeche, Yucatán and Quintana Roo) all have HDI values considered “medium” or higher, while southern Mexico (plus some other states, including Zacatecas, Guanajuato, Michoacán and Veracruz) all have “low” values.

The map includes international comparisons. For example, Oaxaca, one of most deprived states in Mexico, had a level of HDI in 2012 comparable to that of Botswana in Africa, even though that nation’s HDI is actually 38 positions below that of Mexico in the world rankings.

The report highlights the extent of disparities by calculating the number of years it will take each state, at the rates of change experienced from 2008 to 2012 to reach the HDI level of Mexico City. Interestingly, while it will apparently take Chihuahua 200 years to reach the HDI level of Mexico City, it will take Chiapas only 20 years to reach the same point.

The main conclusion that can be drawn is that the overall quality of life continues to improve in Mexico though not at equal rates throughout  the country. Disparities persist and current patterns of public spending have failed to make significant inroads into diminishing these disparities. The UN report considers it a priority to close the development gaps in Mexico, especially in the two southern states of Chiapas and Oaxaca.

Related posts:
May 262014
 

In a recent post – Mexico’s internet connections and e-commerce – we looked at how 35.8% of Mexican households now have computers, 30.7% are now connected to the internet, and at the very rapid rise of e-commerce over the past few years.

How does internet access in Mexico compare to other countries? Comparative studies show that Mexico lags well behind almost all major countries in terms of internet access. Mexico’s rate of 30.7% of households with internet access compares poorly with other countries in Latin America such as Brazil (37.8%), Chile (37.8%) and Argentina (34.0%).

Among OECD member states, Mexico ranks bottom in terms of internet access. South Korea ranks top, with 97.2%. The Netherlands, Norway, Iceland, Luxembourg, Sweden and Denmark all have rates over 90%. Canada has a rate of 78.4%, the USA 71.1% and Japan 67.1%. The lowest ranking European countries are Turkey (41.6%), Greece (50.2%) and Portugal (58.0%).

Within Mexico, the rate of internet access varies widely from one state to another (see graph).

Percentage of households with internet access

Percentage of households with internet access. Source: INEGI (2014)

The disparities are evident from the graph, but the pattern becomes much clearer when the data are grouped and mapped:

Internet access, 2013

Pattern of internet access, 2013. Data: INEGI. Credit: Geo-Mexico

The north-south divide in Mexico, that we have frequently referred to in previous posts, is immediately evident (with the notable exception of the easternmost state of Quintana Roo). Perhaps not surprisingly, there is a close correlation between GDP/capita in different states and their internet access.

Discussion question:

What other factors are likely to influence rates of internet access? To support, or challenge your ideas, try using Geo-Mexico’s map index to find maps to compare with the map of internet access.

Source of data:

  • Estadísticas a Propósito del Día Mundial de Internet” (pdf file) (INEGI 2014)

Related posts:

The pattern of farm sizes in Mexico: is there a north-south divide?

 Other  Comments Off on The pattern of farm sizes in Mexico: is there a north-south divide?
Feb 242014
 

In 2007, INEGI census recorded 2.4 million “units of production” (farms) under 2 hectares in size. This number is 43.5% of all farms, and includes farms not being actively worked. 22.9% of farms were between 2 and 5 hectares in area and a further 23.4% between 5 and 20 hectares. In sum, almost 90% of all farms had an area of 20 hectares or less. At the other end of the size spectrum, 2.2% of farms were larger than 100 hectares.

In terms of land tenure, 68.5% of all farms were in ejidos (a form of collective farming), 28.5% held privately and the remaining 3% were other (communal, public, mixed). Almost three-quarters of all farms under 20 hectares in area are ejidos, whereas about three-quarters of all farms over 100 hectares in size are private.

Map of average farm size in Mexico, by state, 2007

Map of average farm size in Mexico, by state, 2007. Data: INEGI. Credit: Tony Burton/Geo-Mexico

The choropleth map (above) shows the average size of farms (in hectares) by state. It is very clear that larger farms are concentrated in northern Mexico. All the states along the US border have average farm sizes in excess of 100 hectares. At the other extreme, a ring of states in central Mexico (centered on the Federal District) have average farm sizes that are below 5 hectares. The average farm size is slightly larger to the south of that ring of tiny farms, and significantly larger towards the east, including those states comprising the Yucatán Peninsula.

The general pattern is of a north-south division, which becomes even clearer when the average farm sizes are plotted as an isoline map. With minor exceptions, the “surface” represented by these isolines slopes steeply away form the highest values in north-western Mexico towards the south-east.

Average farm size in Mexico

Average farm size in Mexico. Data: INEGI Credit: Tony Burton / Geo-Mexico

Classroom exercise

Having recognized this pattern in farm sizes, can you think of reasons that might explain it? The short answer is that farm sizes vary in response to a multitude of factors, These include historical, demographic, and socioeconomic factors as well as relief, climate, natural vegetation and soils.

Q1. Compare the maps in this post with maps for some of the factors you think might be important. (Try our Geo-Mexico Map Index as a starting point). For example, the northern area of Mexico, the area with largest farms, is primarily semi-arid or arid. Why might farms in arid and semi-arid areas be larger than in other areas?

Q2. Have a class discussion about the relative importance of the factors that have been identified or suggested.

Q3. Discuss the relative merits of the two mapping methods used in this post (choropleth and isoline) to portray average farm sizes.

Related posts:

Geo-Mexico has many other agriculture-related posts (easily found via our tag system). They include posts about the geography of growing/producing Christmas trees, cacao, honey, sugarcane, coffee, chiles, floriculture, tomatoes, tequila, horticultural cropsand oranges. Also worth reading are:

Where are the wealthiest households in Mexico?

 Other  Comments Off on Where are the wealthiest households in Mexico?
Nov 102011
 

A recent publication from the public opinion research consultancy Mitofsky offers some insights into the distribution of different socio-economic groups within Mexico.

The Mitofsky study relies on the AMAI 10×6 system to tabulate the percentage of households in each state that fall into six distinct categories: A/B, C+, C, D+, D and E.

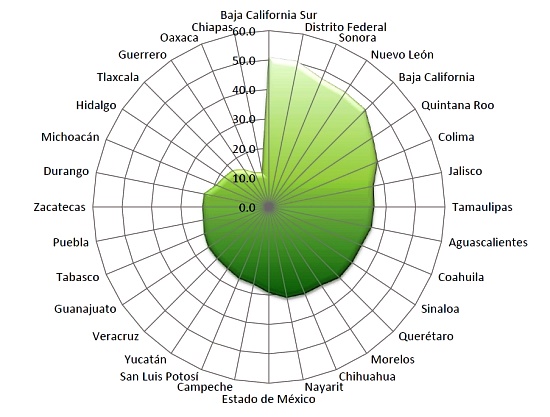
Across Mexico as a whole, 4.4% of households are categorized as A/B (the highest category, see map below), 12.3% as C+, 17.9% as C, 39.1% as D+, 21.6% as D and 4.7% as E (the lowest category).

The data show that, between them, four states–the Federal District (23.4% of all A/B households in Mexico), Jalisco (14.4%), State of México (9.3%) and Nuevo León (5.9%)– account for more than half of all the homes in this category in Mexico

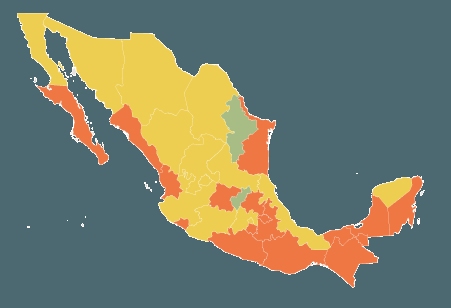
The map shows how the incidence of A/B households (the highest socio-economic category) vary, state by state, across the country.

Distribution of highest socio-economic status households in Mexico.
Households in the highest socio-economic group in Mexico. (Geo-Mexico/Tony Burton; all rights reserved)

Do you live in an A/B household?

1. Housing characteristics:
– average of 6-8 rooms (often 3 bedrooms, 3 bathrooms) built of brick and/or concrete
– floors tiled, hardwood or stone; more likely to have carpets or rugs than lower categories
– most are owner-occupied, not rented

2. Sanitary Infrastructure
– connected to municipal potable water and sewer systems
– all have tub, shower, and water heater (usually using gas)
– two-thirds of these homes have water cisterns and pump to supply water tanks.
– some have air conditioning and/or central heating

3. Practical Infrastructure
– average 2 vehicles
– all have stoves, refrigerators and washing machines
– almost all have microwave ovens, blenders, toasters, coffee-makers and juice extractors

4. Communications and Entertainment Infrastructure
– almost all have fixed line telephones and cell phones
– most have 3 or 4 TVs and  satellite or cable TV
– all have DVDs and stereos/CD players; half have video game consoles
– average more than 1 computers per household; 75% connected to Internet
– many have memberships of private sports clubs and own a second home or time-share.
– more than 50% have traveled by air at least once in last 6 months, and most travel overseas at least once a year

5. Educational and Occupational Profile of Head of Family
– usually has a bachelor’s degree or higher
– work in medium or large companies, as directors, CEOs or other high-ranking professionals

6. Expenditures
– these households save more, but also spend more on education, entertainment, communication and vehicles
– food purchases account for only 7% of total expenditures, well below the average for the total population
– of these food purchases, the proportion spent on dairy products, fruit, and drinks is greater than lower categories

Questions worth thinking about:

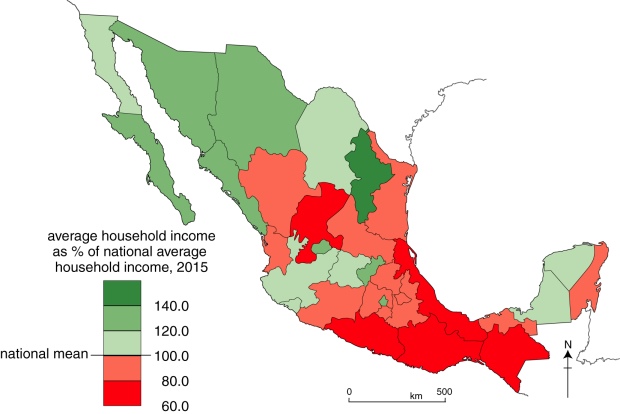
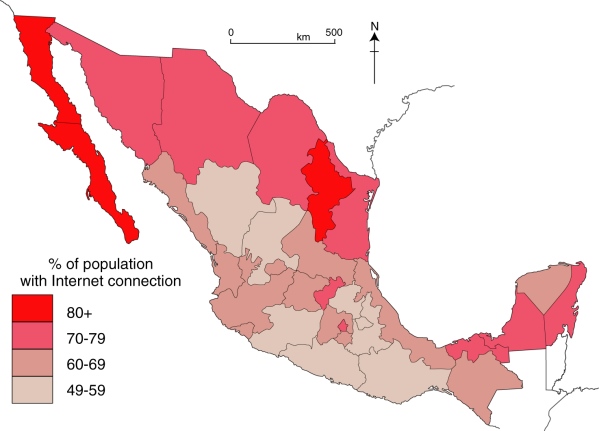
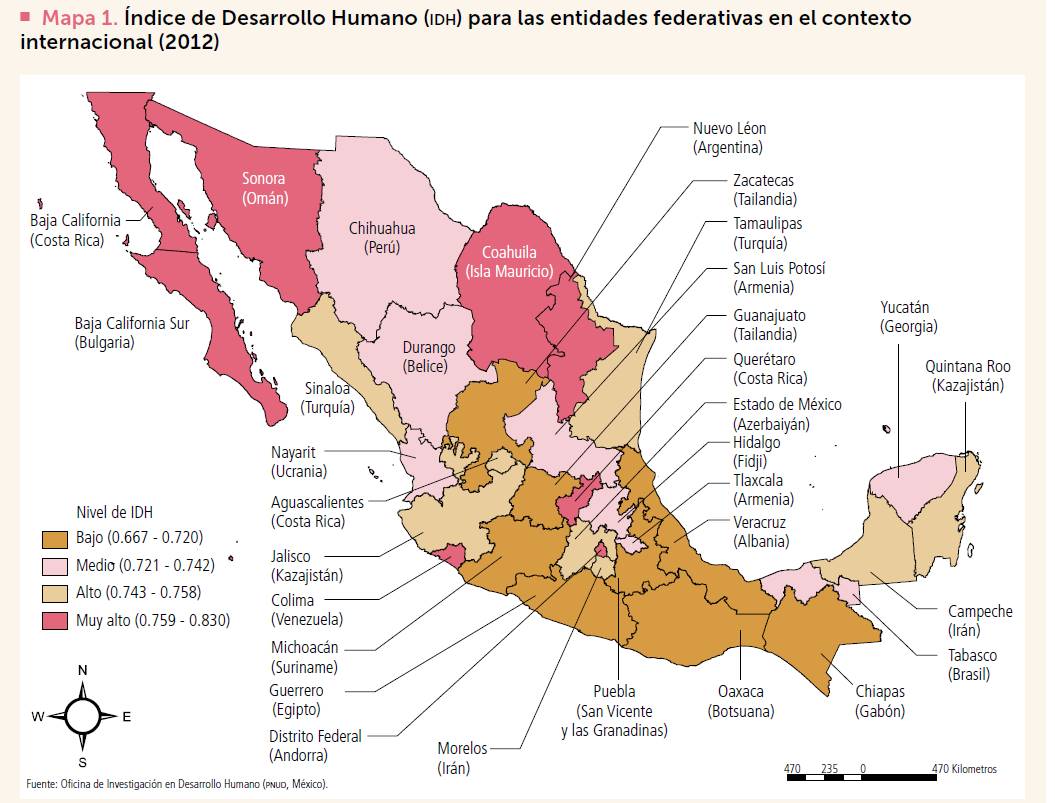
  • How does this map compare to other maps on Geo-Mexico of inequalities across the country? (Use the site search feature or tags from the tag cloud on the left hand side of each page to find other inequality maps)
  • To what extent does this map confirm that north-south divide described in several previous posts?

Source:

Niveles socioeconómicos por entidad federativa 2009 – 2010 by Roy Campos and Ana María Hernández; CONSULTA MITOFSKY, December 2010.

Related Posts:

Consumer shopping habits and regions in Mexico

 Mexico's geography in the Press  Comments Off on Consumer shopping habits and regions in Mexico
Mar 172011
 

Nielsen, the world’s leading consumer information and research company (offices in more than 100 countries), recently analyzed the shopping habits of consumers in Mexico. From a geographical perspective, one of the most valuable aspects of the study is Nielsen’s use of consumer purchasing habits to suggest a division of Mexico into distinct shopping regions.

The market for consumer goods in Mexico is very large, and has grown rapidly since the 1980s. Mexico is now the world’s 11th most populous nation (112.3 million people in 2010) and has the world’s 11th largest economy. It is also the most populous Spanish-speaking country in the world. Mexico’s size and diversity result in great variations in consumer patterns from one area to another. To achieve maximum success, manufacturers, distributors and retailers in Mexico need to appreciate these regional differences.

Mexico's consumer regions

Mexico's consumer regions. Credit: Nielsen

As we have stressed in previous posts, Mexico has a marked north-south divide. Inhabitants in the north tend to be better-educated and live in smaller households, with higher household incomes and more purchasing power than their counterparts in southern Mexico. The Nielsen study broadly supports this division of wealth, but adds some refinements to the pattern.

The map summarizes Nielsen’s view of the pattern of Mexico’s consumer habits. Throughout the country, small traditional stores (defined by Nielsen as those stores where a salesperson or clerk must be present to serve shoppers) remain a vitally important option for consumer purchases.

Convenience stores and small supermarkets are most popular in Nielsen’s Pacific and North areas. Larger supermarkets are more important in the Valley of Mexico and in the Southeast region.

In all regions, traditional convenience stores are visited frequently, either daily or even twice-daily. Consumers typically visit the nearest supermarket twice a week, with Sunday being the single most popular shopping day. Mid-week supermarket shopping is most common in the Pacific, North and Southeast areas.

Related post:

Mexico’s North–South political divide

 Updates to Geo-Mexico  Comments Off on Mexico’s North–South political divide
Jun 222010
 

The Mexican 2006 Presidential election was very close.  Felipe Calderon of the center-right PAN party garnered 35.89% of the vote to barely edge out Lopez Obrador of the leftist PRD party, who got 35.33%.  Roberto Madrazo of the left-center PRI party was a distant third with 22.23% of the vote.

What is amazing is that while the margin of overall victory was very small, only 0.56%, the votes for the two leading candidates were extremely lopsided within Mexico’s 32 states.  In 17 of the 32 states, the winner got over twice as many votes as the other.  In only three states was the spread less than 10%.  Thus, the colors on the election map below are very solid.  Interestingly, the PRI party which had an iron grip on Mexican politics for seven decades up until 2000 did not win in a single state.

It is also very interesting that voting behavior exhibited a strong north-south pattern.  In the 2006 Presidential election, 14 of 17 northern states voted for Calderon of PAN (blue on the map), while 13 of 15 southern states voted for Obrador of PRD (yellow on the map).

It is not surprising that the more conservative, pro Catholic PAN party appealed to the wealthier, more urban northern voters and staunch Catholic voters in western Mexico.  On the other hand, the populist PRD candidate was more appealing to the poorer, more rural southern voters.

2006 Election results

Mexico City is the main exception, while it is the most prosperous place in the country it is also the most progressive and left-leaning.  It recently approved same-sex marriages as well as legalizing marijuana and abortions.

The other exceptions to the north – south divide raise some interesting questions.  Why did so few voters in the northern state Nayarit vote for PAN (18.9%) compared to PRD (41.8%) and PRI (33.7%)?  Similarly, why did Baja California Sur favor PRD (43.1%) so convincingly over PAN (34.4%)?  Interestingly, Yucatan in the PRD dominated southeast voted overwhelming for PAN (46.2%) compared to PRD (15.9%) and PRI (32.9%).  It was closer in the southern state of Puebla where PAN (26.8%) edged out PRD (23.1%).

To explain these few anomalies to the north–south pattern will require a closer look at the political dynamics of these states and the election returns at the municipality level.  It will be interesting to see if this strong north–south divide persists in the 2012 Presidential election.

Mexico’s North-South economic divide weakens slightly in 2009

 Mexico's geography in the Press, Updates to Geo-Mexico  Comments Off on Mexico’s North-South economic divide weakens slightly in 2009
Mar 222010
 

The rapid rates of economic growth in recent decades in the north of Mexico has led to a pronounced economic north-south divide, mapped and analyzed in some detail in chapter 14 of Geo-Mexico: the geography and dynamics of modern Mexico.

GDP/person in Mexico, 2007 (Color version of Fig. 14-3 of Geo-Mexico). All rights reserved.

In 2009, this divide weakened slightly. However, this was not so much a case of the south catching up but more a case of the north stumbling in its progress, due to its heavy reliance on economic ties to the USA.

Northern border states, where manufacturing is important, saw their GDP fall by more than 10% on average during 2009, according to Banamex’s Regional Economic Activity Indicators (Indicadores Regionales de Actividad Económica), published in mid-March. This decline in GDP was accompanied by a fall in employment and also by a significant fall in remittances sent home from Mexican migrant workers in the USA. It should be remembered, however, that these states all experienced marked rises in their GDP in the years immediately prior to the worldwide economic downturn.

No fewer than 29 of Mexico’s 32 states (counting the Federal District as a state for simplicity) saw their GDP decline in 2009. Only 3 states—Zacatecas, Chiapas and Oaxaca—bucked the trend and saw a rise in their GDP in 2009. In the state of Zacatecas GDP grew 1.6% (helped by a resilient construction sector), in Chiapas 1.1% and in Oaxaca 0.8%. It is noteworthy that none of these three states is particularly well integrated into the global economy. As a result, what was happening outside Mexico’s boundaries had little effect on their economic progress.

The list below gives the % change in GDP during 2009 for a sample of states, alongside the national average for comparison:

Zacatecas           + 1/6%
Chiapas               + 1.1%
Oaxaca                + 0.8%

State of México       – 5.6%
Jalisco                     – 6.0%
Federal District       – 6.4%
Querétaro               – 6.3%

National average    – 6.7%

Tamaulipas            – 7.8%
Nuevo León           – 9.3%
Baja California        -10.5%
Chihuahua              -13.6%
Coahuila                -14.4%