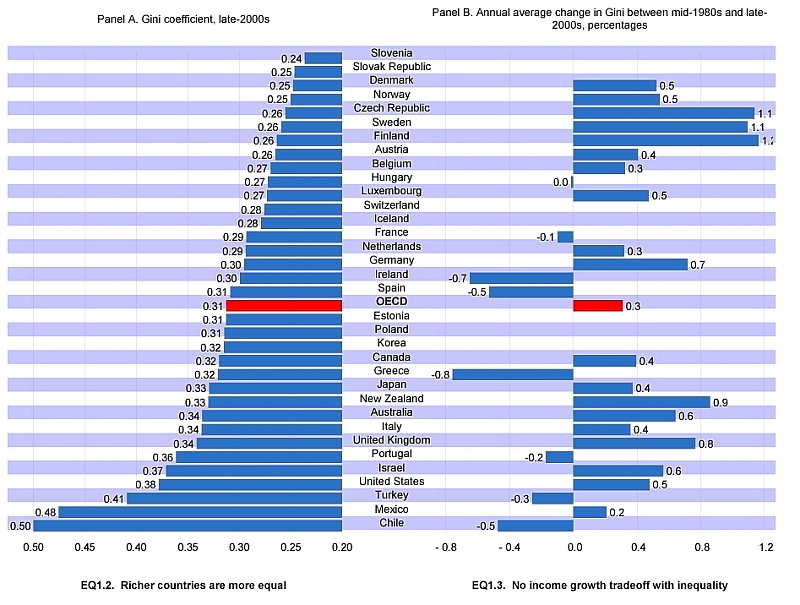
The GINI index, used to quantify the degree of inequality within a population or country (the higher the value, the more inequality), was introduced in a previous post. In this post we report on the change in GINI index for the member countries of the OECD (Organisation for Economic Cooperation and Development). The OECD regularly publishes updated GINI coefficients. Society at a Glance 2011 – OECD Social Indicators includes the following graph which gives a great view of changes in inequality between the mid 1980s and the late 2000s.
It is no surprise to see that Mexico’s inequality is almost the highest of any OECD member country. However, the right hand side of the graph shows that the increase in inequality in Mexico over the period was actually smaller than the OECD average, and well below the change in the USA, Canada and several European countries. This suggests that Mexico’s economy is becoming increasingly resilient and economic downturns do not necessarily result in raising inequality in Mexico as much as elsewhere.
It will be interesting to see how Mexico’s GINI index changes in coming years. High levels of economic inequality remain one of Mexico’s most-pressing issues, and one which will be central to the upcoming 2012 elections.
Related posts:

Sorry, the comment form is closed at this time.