Mexico currently has 65 Magic Towns (Pueblos Mágicos), some of which we have described in previous posts. Regular readers will know we have some reservations about the program, especially about the inclusion on the list of some places that have relatively little to attract the average tourist.
Are Magic Towns distributed evenly across the country?
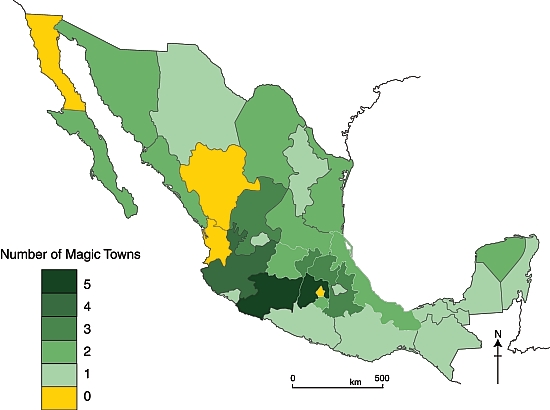
The map shows the distribution of the 57 Magic Towns, by state, as of 1 October 2012. Magic Towns are clearly not evenly distributed across Mexico. Two states – the State of México and Michoacán– each have five Magic Towns, while Jalisco has four. It is no surprise that the Federal District (México D.F.) is not designated a Magic Town, but it is a surprise that there are no Magic Towns in Baja California, Durango or Nayarit. Mexcaltitán, an island town in Nayarit, was one of the first towns in Mexico to be designated a Magic Town, but had this status revoked in 2009.
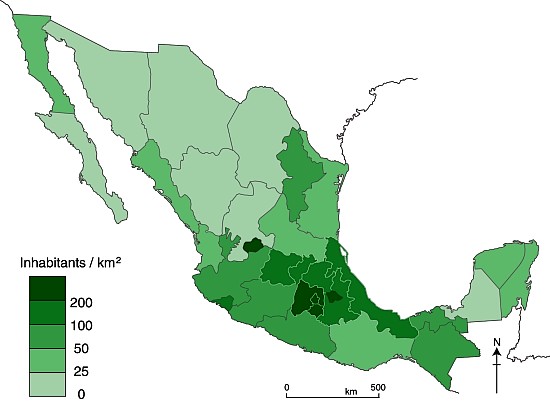
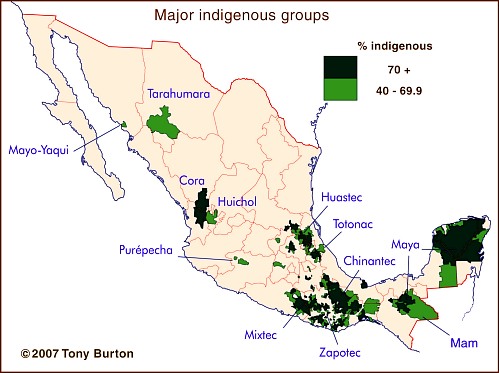
Southern Mexican states appear to be drastically underrepresented, especially when area of state, population and indigenous groups are taken into account.
Larger states (in area and/or population) would surely be more likely to have more Magic Town candidates. However, it is clear from comparing the maps of Magic Towns and population density (above) that the number of Magic Towns does not appear to be related to either the area of states, or to their population density.
Indigenous groups are relevant because they tend to live in relatively remote areas of great natural beauty, such as the Copper Canyon region or the Huasteca, and they also exhibit many distinctive cultural traits, giving them a head-start in the race to demonstrate their attractiveness for tourism. Again, though, there is little common ground between the map of indigenous groups and the map of Magic Towns. In particular, the states of Guerrero, Oaxaca and Campeche all seem to have fewer Magic Towns than might be expected.
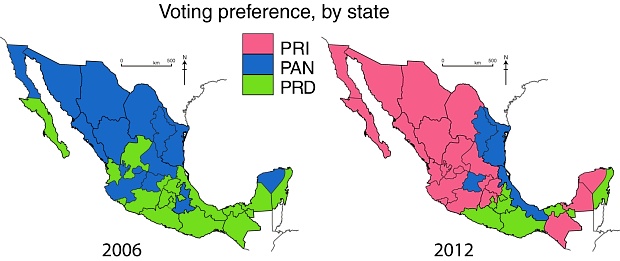
Even politics does not appear to help explain the distribution of Magic Towns, though it must be pointed out that the pattern of voting for presidential elections (maps) may not match the pattern of municipal voting which would be more relevant to applications for Magic Town status.
If and when more towns are added to the Magic Towns list, perhaps the reasons for their distribution will become more obvious.
This post examined the distribution of Mexico’s Magic Towns, as of 1 October 2012, at which point there were only 57 in total. Since this post was written, additional Magic Towns include:
- Magic Towns #58-62: Chiapa de Corzo, Comitán de Domínguez, Huichapan, Tequisquiapan, Batopilas
- Magic Towns #63, 64 and 65: Chignahuapan (Puebla), Cholula (Puebla) and Pinos (Zacatecas)
There is no doubt that Mexico has many other places that would be very worthy additions to the list. Which places would you add?
Related posts:
- Mexico’s three latest Magic Towns (#55, 56, 57) include Loreto
- Magic or mystery? Mexico adds four more Magic Towns to its list (#51, 52, 53, 54)
- Mexico’s 50 Magic Towns (#49, 50)
- Mexico’s Magic Towns now number 48, and counting… (#45, 46, 47, 48)
- Mexico adds three more Magic Towns to its list (#42, 43, 44)
- Mexico’s Magic Towns program to continue at least until 2012
- Mexico’s Magic Towns now include Zacatlán in the Sierra Norte of Puebla
One Response to “The distribution of Mexico’s Magic Towns”
Sorry, the comment form is closed at this time.


es muy interesante