Measuring poverty sounds easy but is surprisingly difficult. What exactly constitutes poverty? What is “extreme poverty”? Simple poverty measures are often uni-dimensional. For example, many poverty figures quoted in the past were based on the proportion of the population having to survive on less than a dollar a day (later revised upwards to $1.25 a day). Such indices are simple and appealing, but inherently misleading. One of the more serious flaws of such indices (whatever the dollar figure used) is that $30 a month may be sufficient to purchase far more goods and services in some countries than in others. $30 in a European city like Geneva will not go anywhere near as far as $30 in the Mexican city of Oaxaca which in turn will not go anywhere near as far as in a mid-sized Chinese city.
The “Human Poverty Index” (HPI) was a vast improvement, since it combined the proportion of the population facing serious shortfalls in life expectancy, with measures of literacy and of living standards. HPI calculations are based on:
- the percentage of population expected to die before the age of 40 years
- the illiteracy rate among adults
- the standard of living, worked out by combining the percentage of population lacking access to health services, the percentage lacking access to safe water, and the percentage of children under 5 years of age suffering from malnutrition.
Even this multi-criteria approach to defining poverty had its critics, with most arguments centering on which criteria should be included, or on their relative weighting within the index.
Another approach, adopted by Mexico’s National Political and Social Development Commission (Coneval) is (as we saw here) to combine income limits (about three dollars a day in this case) with social indicators in a multidimensional system. People in poverty have incomes below the limit and lack access to at least one of the list of social rights.
In 2010, an alternative multi-dimensional index, the Multidimensional Poverty Index (MPI) was published. This has quickly gained international acceptance and is rapidly becoming the preferred way of measuring poverty. The Multidimensional Poverty Index (MPI) was originally presented in an Oxford Poverty & Human Development Initiative (OPHI) working paper by Sabina Alkire and Maria Emma Santos: OPHI WORKING PAPER NO. 38: Acute Multidimensional Poverty: A New Index for Developing Countries (July 2010).
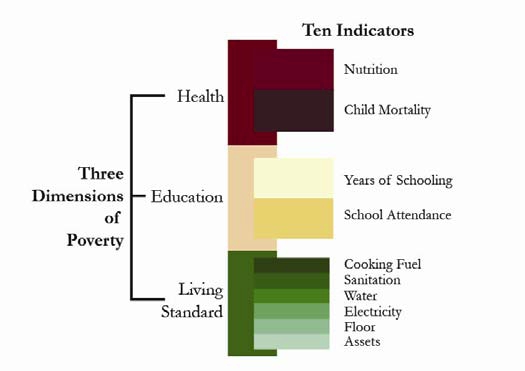
The MPI recognizes that poverty is a very complex phenomenon and seeks to identify the “deprivations that batter a person at the same time.” In the original paper, the index was calculated for 104 countries, with a combined population of 5.2 billion. The index consists of ten indicators corresponding to the three dimensions that are used to calculate the widely-used Human Development Index (HDI): Education, Health and Standard of Living. Each of the three dimensions is given equal weighting in the final index. Each of the indicators within each dimension is also given equal weighting.
Dimension One: Health [weighting 1/3 of total] Indicators:
- Child Mortality: has any child in the family died?
- Nutrition: Are any adult or children in the family malnourished?
Dimension Two: Education [weighting 1/3 of total] Indicators:
- Years of Schooling: Have all household members completed 5 years of schooling?
- Child Enrollment: Were any school-aged children out of school in years 1 to 8?
Dimension Three: Standard of Living [weighting 1/3 of total] Indicators:
- Electricity: Does the household lack electricity?
- Drinking water: Does the household fail to meet Millennium Development Goal (MDG) targets, or is it more than 30 minutes walk to water
- Sanitation: Does the home fail to meet MDG targets, or is the toilet shared?
- Flooring: Is the floor of the home dirt, sand, or dung?
- Cooking Fuel: Is cooking fueled by wood, charcoal, or dung?
- Assets: Does the household own only one or none of the following: radio,TV, telephone, bike, motorbike?
From these values, the MPI can be calculated as the product of two numbers:
- the percentage of people involved and
- the “average intensity of deprivation” which reflects the number of dimensions in which households are deprived.
Many of these indicators overlap with indicators used to evaluate the Millennium Development Goals (MDGs). This means that analyzing MPI should help countries check their progress towards meeting several Millennium Development Goals (MDGs), while focusing on their most vulnerable people. (For details see the original paper). By looking at the simultaneous deprivations of households, it should help policy makers decide where they need to develop new strategies and where they need to refocus their efforts.
How does Mexico stack up on the Multidimensional Poverty Index (MPI)?
Mexico had an MPI rank of 29 out of the 104 countries surveyed (where the #1 rank means the least poverty), with 10.1% of the population deprived in terms of education, 9.2% deprived in terms of health and 6.7% deprived in terms of living standards.
A cautionary note is needed since any index is only as good as the data used in its calculations, but the MPI does seem to be a far more robust measure of poverty and personal deprivation than any of its predecessors.
Related posts:
- Is poverty in Mexico on the rise?
- Make your own “Better Life index”
- How did Mexico rank on the 2010 Legatum Prosperity Index?
- Inequality in wealth in Mexico: the GINI index
- Females, males and gender inequality in Mexico
Geo-Mexico: the geography and dynamics of modern Mexico is an excellent resource for courses in geography, economics, sociology and development studies, designed to be relevant to both general and academic readers. It provides an up-to-date account of Mexico suitable for students taking initial university or college courses related to geography, economics and Mexican or Latin American studies. Buy your copy today!
Education professionals are invited to contact us if they would like to request a review copy. In addition, the entire book is searchable via the “Look Inside” feature of amazon.com
