In a previous post – 2013 Mexico Peace Index: Mexico becoming more peaceful –we reported the work of the Institute for Economics and Peace in devising its inaugural 2013 Mexico Peace Index (MPI).
The interactive online maps that form part of this report repay some exploring. In addition to allowing you to view the pattern for MPI on a state-by-state basis, they also allow you to see the pattern for each of the 7 main indicators:
- Homicide (includes murder, infanticide and non-negligent manslaughter)
- Violent crime (includes rape, robbery and aggravated assault)
- Weapons crime (the proportion of crimes that involve a firearm)
- Incarceration (the annual number of people per 100,000 people over the age of 18 sentenced to prison)
- Police funding (proportion of the Federal District Public Security Contribution Fund)
- Organized crime (includes extortion, kidnapping, and drug related crimes)
- Justice efficiency (the ratio of sentenced homicides to total number of homicides)
Looking at these maps recently, one curiosity that struck me was that the map for incarceration rates shows a clear distance-decay pattern (the kind of pattern we older geographers love to find, even if we can’t explain it!).
The map is a screenshot of incarceration rates in 2012. The incarceration rate is defined as the number of people /100,000 people over the age of 18 sentenced to prison in that year.
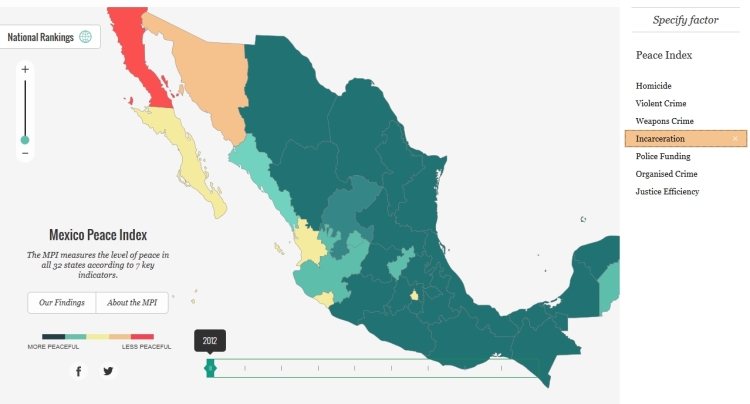
Incarceration rate in Mexico, 2012. Credit: Mexican Peace Index. Institute for Economics & Peace
In this case (see map), it appears that the rate of incarceration varies with distance from the US state of California. The closer to California, the higher the incarceration rate. Looking more closely, it becomes apparent that the states along the northwest coast of Mexico, west of the Western Sierra Madre, have higher incarceration rates than those inland or further south. This means that a better description of the pattern might be that states that are closer in travel time, or ease of travel, to California have higher incarceration rates. This has the added attraction of bringing the eastern state of Quintana Roo into the picture given the large number of flights from Los Angeles to Cancún!
Even if a pattern exists, this kind of conjectural analysis is not the same as a causal explanation. In this case, surely it is just a coincidence that incarceration rates happened to arrange themselves like this? Perhaps the analysis of incarceration rates in future years will shed more light on this spatial curiosity!
For other examples of distance decay, see
- The pattern of Catholicism in Mexico
- The purity of illicit drugs declines with distance from the Mexico-USA border
- Migration channels between Mexico and the USA; distant towns linked through migration
The full 96-page 2013 Mexico Peace Index report – available here – is well worth reading and offers many more insights into the changes taking place in Mexico.
- 2013 Mexico Peace Index: Mexico becoming more peaceful
- Mexican attitudes on the drug war, violence and crime (Jul 2012)
- How much drugs money is laundered in Mexico each year?
- How does money laundering work, and what is being done about it?
- Geographic trends in Mexico’s drug violence (Feb 2011)
- Mexico’s drug cartels and their shifting areas of operation, a 2012 update
Sorry, the comment form is closed at this time.