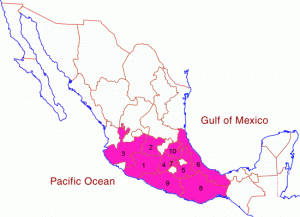
The table shows the 10 states which receive the highest total remittances.
| Rank | State | Remittances ($ millions), 2005 |
|---|---|---|
| 1 | Michoacán | 2,595 |
| 2 | Guanajuato | 1,715 |
| 3 | Jalisco | 1,693 |
| 4 | State of México | 1,675 |
| 5 | Puebla | 1,174 |
| 6 | Veracruz | 1,155 |
| 7 | Federal District | 1,452 |
| 8 | Oaxaca | 1,002 |
| 9 | Guerrero | 957 |
| 10 | Hidalgo | 718 |
The data show very clearly that all the states receiving high total amounts of remittances are in the southern half of Mexico.
(a) What factors might explain this pattern?
(b) Compare this map with a map of the states with highest per person remittances. Why are some states only shown on one of the maps, and not on the other?
(c) Find a table showing the total population of each state in Mexico. To what extent do the total population figures for each state help to explain whether or not they are in the top 10 states for receiving remittances?
“Migration to the USA” is the title of chapter 26 of Geo-Mexico: the geography and dynamics of modern Mexico. This chapter provides a good introduction to the geography, history and impacts of migration and remittances. Buy your copy today!

Sorry, the comment form is closed at this time.