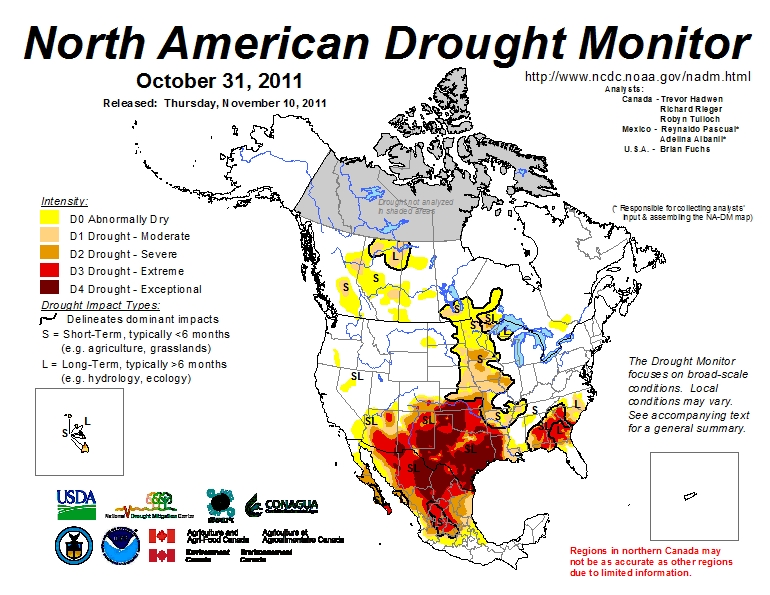
The North America Drought Monitor (NADM) is a “cooperative effort between drought experts in Canada, Mexico and the United States to monitor drought across the continent on an ongoing basis”. The program began in 2002 . The NADM is an extension of an earlier version that was limited to the USA.
The NADM combines multiple indices and local information to produce “drought monitor” maps that best reflect the consensus of numerous scientists, some working at state or federal level, and others working in tertiary education and research.
What exactly is a “drought”?
The basic definition of a drought is a prolonged period of abnormally low precipitation. In practice, this means a period when precipitation is significantly less than would normally be expected for the time period under consideration. The amount of precipitation that is “normal” varies greatly from one area to another, and can also vary with the seasons. Low precipitation in a desert would not necessarily indicate a drought! On the other hand, low precipitation in a rainforest almost certainly would indicate a drought. Since most of Mexico experiences a dry season and a rainy season each year, this further complicates the picture. Not only is it important to know how much precipitation falls, but it is also important to know when it falls.
This definition must be borne in mind when looking at the Drought Monitor maps, as should the seasonality of precipitation throughout most of Mexico, and the distribution of precipitation, which varies greatly from north to south.
The NADM maps show that the drought situation can change quite rapidly from one month to the next. (Use the link above to compare February and March 2011, for example, or March and April 2011).
In a future post, we will take a closer look at the impacts of the drought (shown on the map) that currently affects much of northern Mexico.

Sorry, the comment form is closed at this time.