In the past few months, it has become harder than ever to assess the cleanliness of Mexico’s beaches. Alejandro Calvillo, director of the consumer rights organization “El Poder del Consumidor” recently published an alarming blog post alleging that Mexican authorities have gone to considerable lengths in recent months to mask the true state of Mexico’s contaminated beaches. (Playas contaminadas en México, un secreto de Estado)
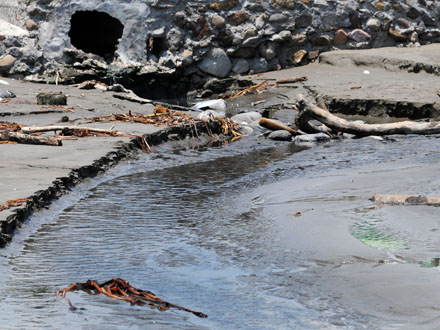
Drain on Mocambo Beach, Veracruz. Credit: La Voz del Sureste.
Calvillo explains that for several years, government agencies published regular monthly statistics relating to the cleanliness of all the country’s major swimming beaches. While some people queried the veracity of some figures, at least the data was publicly available, and provided some starting point for analysis and discussion. Indeed, this data allowed us to write in Geo-Mexico (p 46) that,
“Coastal waters are also regularly monitored for contamination. The percentage of Mexico’s resort beaches that met national water quality norms rose from 93.7% in 2003 (when 226 beaches in 35 destinations were tested) to 98.4% in 2007 (276 beaches in 46 destinations). Seawater at all coastal resorts is now well within the national standard except for Ixtapa-Zihuatanejo on the Guerrero coast.”
However, soon after the new administration (of president Enrique Peña Nieto) took office, Calvillo claims that a decision was made to cease releasing regular monthly data for beach contamination and to remove the historical time series of beach cleanliness data from government internet sites (such as those of the Health Secretariat and Environment Secretariat). Fortunately, Calvillo’s claims are not the whole truth. Data are still being published for many beaches, via an interactive webpage titled Playas Limpias (Clean Beaches) hosted by the Health Secretariat. However, it does appear to be true that the historical series of pre-2013 data have vanished, and that no data is available, even in 2013, for several beaches that were previously regularly monitored.
There is no doubt that in recent years hundreds of Mexican beaches have on occasion had excessive levels of Enterrococos faecalis, the main bacteriological indicator. (About a decade ago, counts of Enterococcus spp. replaced fecal coliform counts as the best way to assess the water quality at public salt water beaches.) The major source of contamination, despite years of campaigning by environmental groups, comes from hotels, towns and cities that continue to dispose of their effluent directly into the sea, often in close proximity to popular swimming beaches (see photo). Progress has been made in some states, including Jalisco, Nayarit and Veracruz, but there is still a long way to go.
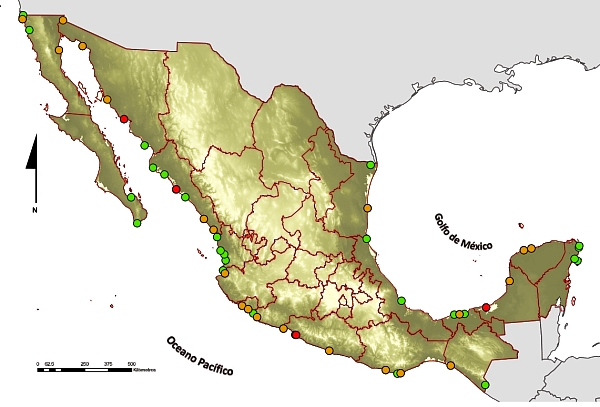
Water quality on Mexican beaches, 2011. Source: Atlas Digital del Agua México 2012;
(green=good; yellow=moderate; red=poor)
Calvillo writes that official reports in 2011 (see map) listed 99 beaches where Enterococus levels had been found in excess of 200 Enterococci/100 ml of water on at least one occasion. Values over 200 Enterococci/100 ml are considered to pose a “health risk”, according to Mexican norms. Of these 99 beaches, 70 were on the Pacific coast. The worst beaches included 1 in Baja California Sur (La Paz), 4 in Nayarit (including Sayulita, Rincón de Guayabitos), 3 in Jalisco (including Playa del Cuale in Puerto Vallarta), 10 in Michoacán (including Caleta de Campos, Chuquapan and Playa Nexpa) and 3 in Guerrero. In the worst locations, the Enterococci count was over 20,000/100 ml.
Of the 29 beaches with excessive values on the Gulf of Mexico and on the Caribbean coast, the most polluted were on the Gulf of Mexico, including locations in Tamaulipas, Veracruz and Campeche.
In summer 2012, the 22 beaches that posed a health risk according to the data included Regatas (Veracruz), Rincón de Guayabitos (Nayarit) and Playa Carabali (aka Playa Hornos) in Acapulco (Guerrero).
Despite having made less data available for 2013, in the days leading up to the 2013 Easter vacation period, federal and state government officials repeatedly stressed that all beaches were clean and ready to receive the anticipated hordes of holidaymakers. It is difficult to assess the accuracy of these claims in the absence of more data. Were the beaches really clean, or were tourists in some destinations risking potentially serious gastrointestinal and other diseases every time they went swimming?
Adding another layer of complexity to interpreting the statistics is the fact that several states have massaged the data tables by selectively changing the names of some beaches, and omitting others. For example, Calvillo points out that in 2011 the state government of Veracruz renamed four beaches that had previously experienced high pollution levels so that their historical records would be hard to find:
- Costa de Oro I became Gaviota II
- Iguana Norte was renamed Tortuga II
- Iguana Sur became Pelícano II
- Penacho del Indio was renamed Pelícano I.
In 2012 Veracruz removed two beaches from its list completely: Iguana Centro and Acuario, which it deemed “no longer of interest to tourists,” perhaps because its 2009 count was a record-breaking 159,490 Enteroccocus/100 ml.
Veracruz is not the only state to have “tweaked” its data. Jalisco decided (in 2009) not to monitor either Conchas Chinas or Boca de Tomatlán, both of which had registered high levels of contamination in previous years. In the state of Guerrero, the main beach in Zihuatanejo (historically one of the most polluted beaches) has not been monitored since 2011 because of “technical problems”. [Note: Measurements began again here in 2013, at about the time this post was first published.]
The moral of this post? The absence of data for any particular beach should not be taken as indicating that it is not contaminated. On the contrary, the absence of data might perhaps better be interpreted as a sure sign that the beach HAS or MIGHT HAVE a problem!
Related posts: