Attempting to quantify the importance or impacts of tourism, beneficial or otherwise, is fraught with methodological difficulties. The number of hotel rooms in different cities is often used as a proxy measure of the relative importance of tourism in different communities, but looking only at tourist capacity “masks the fact that hotels are rarely full. In 2007, the national occupancy rate was 54.8%. Traditional beach resorts such as Acapulco, Mazatlán and Puerto Vallarta had an occupancy rate of 52.2%, compared to 68.1% for modern, planned mega-resorts like Cancún and Los Cabos. The occupancy rate in the large cities—Guadalajara, Mexico City and Monterrey—was 55.0%, well ahead of the 47.2% for other interior cities.” (Geo-Mexico, p 134).
As in other branches of geography, it is not only the “reality” that matters, but also people’s perceptions of reality. Most decisions concerning location (such as where to live, the best place to start a new business. etc) are taken on imperfect or incomplete information; in other words, these decisions are based, at least to some extent, on perceptions.
In the case of tourism, it is the perception of visitors that matters. This is precisely why certain resorts gain a reputation as being “jet set” or the “in place” to vacation. The “in place” today is not going to be the “in place” in a few year’s time, since perceptions (and reality) change. Nowhere has this proved to be more true in Mexico than in the case of Acapulco.
But is it possible to measure tourist perceptions? It is very difficult to do so directly, but there are ways of tackling this question, and here we look at one approach, based on an analysis of tourist-oriented literature.
The approach is easiest to explain in the context of a real example, in this case an analysis of the likely perception of foreign tourists of destinations in the Lerma-Chapala drainage basin in Mexico. (This study formed part of my contribution on tourism to the Atlas de la cuenca Lerma-Chapala, construyendo una visión conjunta, Semarnat-Unam-IE, 2006).
The Lerma-Chapala Basin (see map) is one of Mexico’s major river systems, comprising portions of 127 municipalities in five states: México, Querétaro, Michoacán, Guanajuato and Jalisco. The basin has considerable economic importance. It occupies only 2.9% of Mexico’s total landmass, but is home to 9.3% of Mexico’s total population, and its economic activities account for 11.5% of national GDP. It also has considerable importance for tourism.
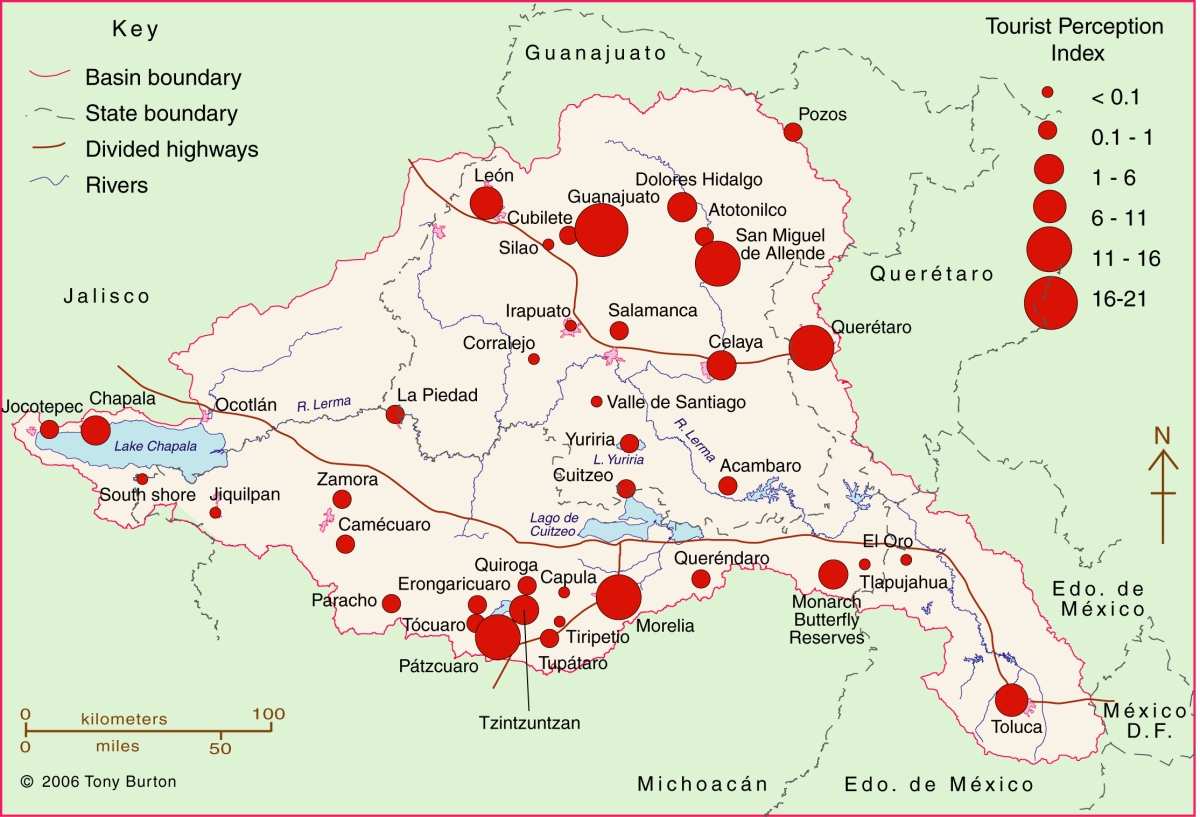
Lerma Basin Tourist Perception Index. Cartography: Tony Burton / Geo-Mexico; all rights reserved Click to enlarge.
The red circles superimposed on the map represent an index of tourism perception. This index is based on an analysis of seven tourist guides that purport to cover the entire country:
- AAA Tourbook (2004)
- Let’s Go Mexico (2004)
- Lonely Planet (2002)
- Footprint Guide (1999)
- Upclose Mexico (1998)
- Insight Guide (1994)
- Cadogan Guide (1991)
In each case, the total number of lines of text in the guide devoted to any location within the Lerma-Chapala drainage basin was counted, as well as the number of lines devoted to each individual location. This allowed a ratio or percentage to be worked out for each place for each book. For example, if a book had 240 lines in total devoted to the drainage basin, of which 60 were devoted to San Miguel de Allende, the perception index for San Miguel for that book would be 60/240 * 100 = 25%. Similar calculations were performed for all the locations mentioned, for each book, and then the mean index was calculated for each location. These mean indices were the basis for the size of the circles on the map.
In broad terms, the map shows which places are likely to be on a foreign traveler’s radar when they are visiting the area. Those familiar with this area may be surprised to see that the ghost town of Pozos merits as many lines of text as Quiroga (and indeed more lines of text than Atotonilco). Another surprise is that Tzintzuntzan appears to be as much in the tourist eye as Chapala, Dolores Hidalgo or Toluca. The main purpose of this post is not to analyse such apparent anomalies but only to suggest a relatively easy way of analysing tourist perceptions through the use of tourist-oriented literature. Applying the same method to the entire country, on a state-by-state basis, throws up far more interesting anomalies which we plan to share at some point in the future.
Previous posts about the importance of tourism in Mexico, and its impacts at different scales, from the national/international scale at one extreme to the single resort scale at the other, include
- Retirees and “residential tourism”: a case study of Chapala-Ajijic in Jalisco
- Day trips and tourism in the Lerma-Chapala basin
- Tourism’s environmental impacts in the Lerma-Chapala drainage basin
- Cultural and eco-tourism in the Copper Canyon region of Mexico
- The growth of Cancún, Mexico leading tourist resort
- When did Acapulco first become a tourist resort?
- The development of Huatulco, the tourist resort in southern Oaxaca
Sorry, the comment form is closed at this time.