An overview of Mexico’s indigenous peoples

 Other  Comments Off on An overview of Mexico’s indigenous peoples
Apr 162010
 

How many indigenous people are there?

According to INEGI figures, about six million Mexicans over the age of five speak at least one indigenous language. Another three million Mexicans consider themselves indigenous but no longer speak any indigenous language.

How many indigenous towns or villages exist?

INEGI figures show that, in over 13,000 localities, more than 70% of the population speaks an indigenous language. Most of these localities are small rural settlements with fewer than 500 inhabitants. These settlements are often highly marginalized, with high levels of poverty.

Speaking an Indian language is associated with disadvantage

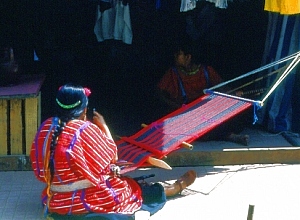
Oaxacan weaver. Photo: Tony Burton. All rights reserved

Speakers of indigenous languages fall way below the Mexican average on almost any socio-economic indicator. For instance, almost 33% of indigenous-speakers are illiterate, compared to a national rate of 9.5%. Females are particularly disadvantaged – indigenous females stay in school a full year less than their male counterparts, and for only half the time that the average non-indigenous female does. Even today, almost 5% of indigenous infants die before reaching their first birthday. A third of indigenous houses lack electricity; more than half do not have piped water.

Where do the indigenous people live?

More than 92% of the indigenous population lives in central and southern Mexico. With the notable exception of the 50,000+ Tarahumara Indians who live in the remote Copper Canyon region of Chihuahua, other indigenous groups in northern Mexico have relatively small populations.

The reason is largely historical. The major pre-Columbian civilizations in Mexico—Maya, Aztec, Zapotec, etc—developed in central or southern Mexico. The north always had fewer indigenous people. The disparity in numbers between north and south was heightened in early colonial times, as Spain expanded its territorial interests in New Spain along two major axes of economic development: the Mexico City-Veracruz corridor (the major trade route linking the capital to the port and Europe) and the Mexico City-Zacatecas corridor (the major route linking the capital to valuable agricultural and mining areas). It is no coincidence that indigenous languages and customs first died out along these corridors, as the indigenous people were forced to become assimilated into the developing dominant culture.

Indigenous peoples and languages did much better in the south. At last count, Oaxaca has over one million indigenous speakers representing more than a third of the state’s population. The state’s largest indigenous linguistic groups are the Zapotec, Mixtec, Mazatec, Chinantec, and Mixe. Oaxaca’s ethnic diversity is celebrated in the annual Guelaguetza festival, normally held in July.

Chiapas has almost as many indigenous speakers as Oaxaca. The largest indigenous groups in Chiapas are the Tzotzil, Tzeltal and Chol. One numerically-small Chiapas group is the Mam. Its recent history is an interesting study in how an indigenous group can re-invent itself in order to survive in the modern world.

The population figures quoted in this post are from INEGI’s Census and II Conteo de Población y Vivienda 2005 (INEGI, Aguascalientes).

Click here for original article on MexConnect

Chapter 10 of Geo-Mexico: the geography and dynamics of modern Mexico is devoted to Mexico’s indigenous peoples. Many other chapters of Geo-Mexico include significant discussion of the characteristics of, and development issues facing, Mexico’s many indigenous peoples.
Cartogram of Mexico’s population distribution

 Maps  Comments Off on Cartogram of Mexico’s population distribution
Apr 112010
 

Cartograms are maps in which the sizes of areas (such as states or countries) have been distorted to reflect some numerical value applying to that area. They are a form of topological transformation. To help make the end-product recognizable, the positions of major places are kept as close to their conventional spatial arrangement as possible. Drawing such maps used to be a very time-consuming and trial-and-error process. Only in the last decade or so has it become possible to make such maps using sophisticated computer programs. The most famous cartograms produced to date have emerged from the work of a team at the University of Sheffield in the UK. Their main website includes some fascinating examples of world cartograms portraying everything from tornadoes to tractors and nurses to national savings.

The Sheffield team have also produced population cartograms for individual countries, which offer a unique visualization of population distribution.

text

Cartogram of Mexico's population. © Copyright 2009 SASI Group (University of Sheffield). Used under Creative Commons Licence.

The original cartogram on its original page (a somewhat larger image).

The cartogram offers a striking image of the dominance of Mexico’s three main cities—Mexico City, Guadalajara and Monterrey—and their surrounding areas in the nationwide distribution of population.

The home page of worldmapper.org

The 10 largest states in Mexico in terms of population

 Other, Teaching ideas  Comments Off on The 10 largest states in Mexico in terms of population
Apr 062010
 

This table shows the ten states in Mexico which have the largest populations. The total population was 112,322,757 in 2010, according to the preliminary results of the 2010 census. These figures may change slightly when the final results of the census are made available.

RankStatePopulation (2010 census)
1State of México15,174,272
2Federal District8,873,017
3Veracruz7,638,378
4Jalisco7,350,355
5Puebla5,779,007
6Guanajuato5,485,971
7Chiapas4,793,406
8Nuevo León4,643,321
9Michoacán4,348,485
10Oaxaca3,801,871

Q. Find these ten states on a map of Mexico [printable map of Mexico in pdf format]. Do the states with the most people also have the largest land areas?

Mar 112010
 

Some of Mexico’s key population indicators are listed below, with the latest estimates of the 2010 values for each indicator:

  • Total population –  108.4 million
  • Crude birth rate  – 17.8 / 1,000
  • Crude death rate – 5.0 / 1,000
  • Natural population growth rate – 1.28%/yr
  • Infant mortality rate – 14 / 1,000 live births
  • Total fertility rate – 2.1 children per woman of reproductive age
  • Life expectancy – 75 years (male  73 ; female 78)

Table 9.1 of Geo-Mexico: the geography and dynamics of modern Mexico provides values for each of these indicators for the period from 1900 to 2000 inclusive, together with estimates (projections) for the period from 2010 to 2050.

Click here for a post about Mexico’s population age-sex pyramids for 1990, 2010 and 2050.

Feb 222010
 

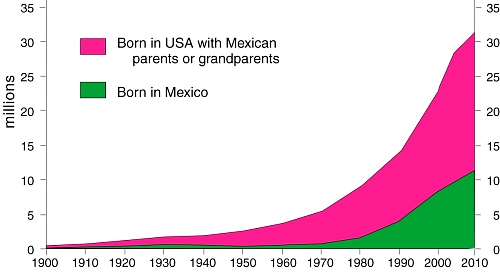
Mexicans have a long history of working and living in the USA. Migration is one of the most important linkages between North America’s two most populous countries. The Mexican diaspora in the USA is an integral part of both Mexican and US society. Each year roughly 250 million legal border crossings are made, about half by Mexicans. A much smaller number, perhaps a few hundred thousand, cross the border illegally despite US efforts to tighten border controls. The Mexican communities on either side of the border are very closely linked.

Mexicans in the USA
As of 2008 over 31 million Mexicans lived in the USA (see graph). This is more than one fifth of all Mexicans anywhere and a larger number than in any single Mexican state. Almost 19 million Mexican-Americans were born in the USA of Mexican parentage; these have always outnumbered migrants.

Roughly 10% of everyone born in Mexico now lives in the USA. This figure was only 5% as recently as 1990 and only 1.4% in 1970. Migrating Mexicans are as likely to move to the USA as within Mexico. Clearly, in recent decades, an increasing number of Mexicans have chosen to live in the USA.

[Extract from chapter 27 of Geo-Mexico: the geography and dynamics of modern Mexico]

Mexico’s population in 1990, 2010 and 2050

 Books and resources, Teaching ideas, Updates to Geo-Mexico  Comments Off on Mexico’s population in 1990, 2010 and 2050
Feb 082010
 

Want your very own Geo-Mexico bookmark?

This link – Population of Mexico in 1990, 2010 and 2050 – is to a pdf file of three age-sex pyramids showing the population of Mexico in the years 1990 and 2010, and the predicted population for the year 2050.

Print the file to make your own Geo-Mexico bookmark and get a fascinating insight into Mexico’s likely future population. Mexico’s population growth rate has fallen dramatically since 1990. More surprisingly, between now and 2050, the average age of people in Mexico will rise rapidly. Mexico is set to move from a predominately young population to a predominately old population in only a couple of generations.

What else can you say about Mexico’s population from a close analysis of the population pyramids? (Feel free to post your comments below)

Canadian Club of Ajijic listens to Geo-Mexico co-author

 Other  Comments Off on Canadian Club of Ajijic listens to Geo-Mexico co-author
Jan 152010
 

More than 300 people packed the grounds of La Nueva Posada hotel in Ajijic, Mexico, to hear Geo-Mexico co-author Tony Burton talk about the significance of 2010 in Mexico. Burton took an historical approach, exploring both the history of geography and the geography of history while comparing many aspects of Mexico in 1810 (Independence), 1910 (Revolution) and 2010. His entertaining and informative talk, which was largely based on material in Geo-Mexico, was well received.
At the end of his talk, Burton highlighted the fact that Mexico’s population projections for 2050 suggest that the country will have moved from a predominately young to an elderly population in only one or two generations.