The impacts of the US border wall with Mexico

 Books and resources, Teaching ideas  Comments Off on The impacts of the US border wall with Mexico
Jan 162021
 
Judy King cover

This Guardian article – ‘My neighbourhood is being destroyed to pacify his supporters’: the race to complete Trump’s wall – highlights the problems created (not solved) by US efforts to build a wall along its southern border.

Geo-Mexico is reader-supported. Purchases made via links on our site may, at no cost to you, earn us an affiliate commission. Learn more.

Judy King coverFor what it’s worth, here is my own take on the wall, written a few years ago as a short chapter for Judy King’s book, Echoes from the Wall: Real Stories of Mexican Migrants (Mexico Insights, 2019). The majority of King’s book is based on her one-on-one interviews with a varied and fascinating selection of Mexican migrants who at one time or another lived and/or worked in the US. King’s personal, in-depth approach was time consuming but was amply rewarded and she acquired some extraordinary individual accounts. The book also includes short “backgrounders” on the history of Mexican-US migration and the practicalities involved.

My chapter focused on the geography related to the wall building.

The Border Story: the effects of a barrier wall (written in 2018)

The U.S.-Mexico border is unique in terms of its geography. It is the longest land border in the world between a developed economy and an emerging economy. The continental U.S.-Mexico border (excluding offshore limits) is about 1990 miles (3200 km) long. At roughly the mid-point, the cities of El Paso and Ciudad Juárez face each other across the boundary line. East of these cities, the border follows the course of the Río Grande (Río Bravo as it is known to Mexicans) to the Gulf of Mexico; west of these cities, it crosses the Sonoran desert to reach the Pacific Ocean between San Diego and Tijuana.

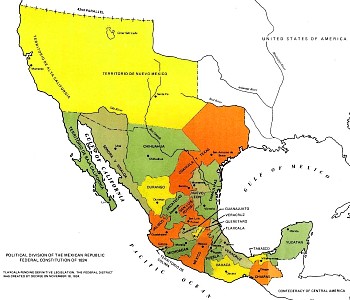
Map of Mexico, 1824

Map of Mexico, 1824

This boundary was established in the middle of the 19th century. After the Mexican‑American War (1846‑1848) the 1848 Treaty of Guadalupe Hidalgo ceded over half of Mexico’s territory to the USA. A few years later, under the 1853 Gadsden Purchase (Treaty of La Mesilla), northern portions of Sonora and Chihuahua were also transferred to the USA. This more or less established the current border between the two countries.

Minor disputes have occurred since due to the constantly migrating meanders of the Río Grande/Bravo. Flooding during the early 1860s moved the river channel south, shifting an area of about 2.6 square kilometers (1 square mile) from Ciudad Juárez in Mexico to El Paso in the U.S. Both countries claimed the area, giving rise to the El Chamizal dispute. This dispute went to international arbitration in 1911 and was only finally resolved in 1963 with the ratification of the Chamizal Treaty by President John F. Kennedy and his Mexican counterpart, Adolfo López Mateos.

A permanent memorial to Chamizal was established in El Paso in 1966 to commemorate the two nations’ laudable international cooperation, diplomacy and respect for cultural values in arriving at a mutually acceptable resolution to the conflict. A later dispute about changes in river meanders – the Ojinaga Cut – was amicably resolved in 1970.

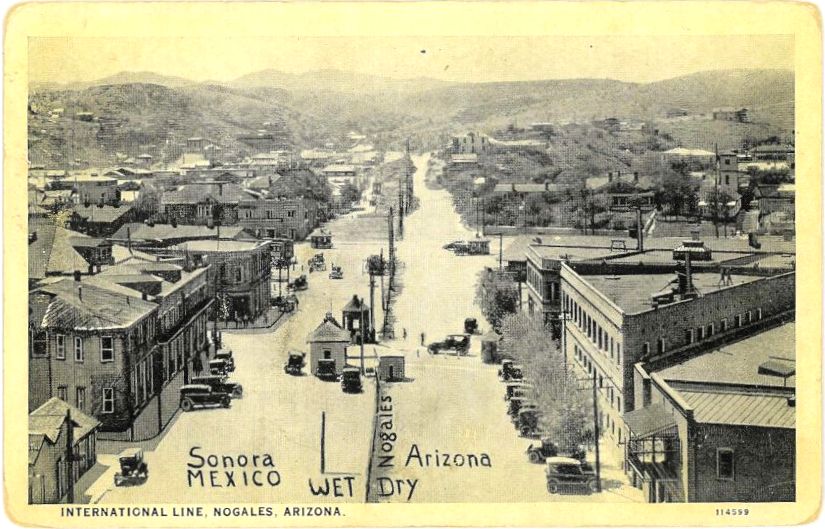
There are about fifty places where people can legally cross the U.S.-Mexico States border but only one where the cities on either side of the border have the same name: Nogales. Historically, straddling the international border was not a drawback to residents of the “Two Nogales” (Ambos Nogales).

Postcard of Ambos Nogales, ca 1915

Postcard of Ambos Nogales, ca 1915

A century ago, one street in Nogales – International Avenue – actually ran east‑west along the border, with one side of the street in the U.S. and the other in Mexico. Even before a boundary fence was erected down the middle, residents were apparently still required to cross at one of two entry points: either the Morley Avenue crossing or the Grand Avenue crossing. The 60-foot-wide avenue had been created in 1897 after all buildings close to the border were razed to the ground as a way of limiting customs fraud. A permanent border fence was built in 1918 following the Battle of Ambos Nogales (La batalla del 27 de agosto).

During the prohibition years (1919-34) in the U.S., Mexican cities close to the border benefited from an influx of free-spending visitors. These years were boom times for the bars, casinos, brothels and race tracks of cities such as Ciudad Juárez and Tijuana. These cities also did well during World War II, when many of the large number of U.S. military personnel stationed near the border were able to circumvent wartime rationing at home by hopping south.

Beginning in the mid-1990s, physical barriers (fences, walls) were erected along some sections of the border to try and stem the flow of migrants from Mexico. Other sectors are closely monitored via electronic sensors, drones, cameras and mobile and satellite surveillance systems. In total, about 30% of the border already has some form of barrier, physical or virtual.

Existing barriers have already made life very difficult in many places. For example, it used to be a ten minute walk for residents of Ejido Jacume in Baja California to cross the border into Jacumba Hot Springs, California, to go to school, work, shop or attend the health clinic. With the barrier, it is now a two hour drive via Tecate.

Most of the physical barriers already built are along the western half of the border (where California, Arizona and New Mexico meet Baja California, Sonora and Chihuahua), They aim to prevent undocumented crossings into the major cities, especially San Diego and El Paso. They have forced would-be migrants to take on crossing the border somewhere in the largely unpopulated Sonoran Desert west of Nogales. The arduousness of this trip has cost the lives of many, many migrants, with the number of deaths of border-crossers since 2004, in this section alone, averaging more than 200 a year.

One of the many ironies associated with demands to build more and higher barriers between the two countries, given their extremely close social and economic ties, is that there is a simultaneous demand (in other quarters) to ease the movement of people and goods across the border in order to boost tourism and facilitate trade. For instance, in December 2015, a 120-million-dollar pedestrian bridge, known as The Cross Border Xpress (CBX), opened to allow passengers living in California to walk across the border into Tijuana International Airport. This helped ease border congestion at the existing land crossings into Tijuana.

Similarly, U.S. and Mexican border officials have piloted joint customs inspection procedures to cut border-crossing times for freight by up to 80%. Trade between the two countries is worth 1.4 billion dollars a day. The first tests of the new joint system were at Laredo international airport in Texas (for vehicle, electronic and aerospace components being flown to eight cities in Mexico), the Mesa de Otay in Baja California (for Mexican farm products entering the U.S.) and San Jerónimo in Chihuahua (for computers and other electronic exports from Mexico). The project has been warmly welcomed by business representatives on both sides of the border.

Finding the right location to build any barrier/wall may prove harder than many would anticipate. While most existing sections of barriers along the western half of the border are located very close to the true boundary line, this is not possible east of El Paso where the boundary runs (theoretically) down the deepest channel of the Río Grande/Río Bravo. Here, a wall or barrier along the boundary is impracticable.

Several protected National Wildlife Refuge (NWR) areas sit on or astride the boundary. They include the Lower Rio Grande Valley NWR and the Santa Ana NWR in Texas, the the Tijuana Slough NWR in California, and the Cabeza Prieta NWR in Arizona (the 3rd largest national wildlife refuge in the lower 48 states) which is contiguous to the UNESCO-designated World Heritage site of El Pinacate y Gran Desierto de Altar Biosphere Reserve in Sonora. In west Texas, Big Bend National Park extends to the border where it meets the Cañon de Santa Elena National Park in Chihuahua.

Ecologists have grave concerns about animal migration corridors and the future of numerous trans-border species. Up to now, only rudimentary and superficial Environmental Stewardship Plans (ESPs) have been prepared for the border areas where barriers have been constructed. These ESPs almost invariably claim that any adverse impacts on plant and animal populations will be only short-term, even in the absence of any scientific studies assessing existing populations.

Barriers such as walls prevent some species from crossing the border and can separate existing cross-border populations into two distinct groups, reducing their viability and increasing the risks of in-breeding, reducing their resilience to changes in climate or food sources. One major study identified 93 currently endangered species likely to be affected by a wall, including jaguars, ocelots, Mexican gray wolves and Quino checkerspot butterflies. Black bears in Texas that currently migrate across the border annually will have their natural territory sliced in half, as will the pronghorn antelope herds further west. Several species, including the jaguar, arroyo toad, the cactus ferruginous pygmy owl (which flies close to the ground) and Peninsular bighorn sheep, have critical habitats either side of the border.

People, too, have cross-border territories. Spare a thought for Native American groups such as the Tohono O’odham people whose ancestral lands now lie on either side of the Arizona-Sonora border. Their divided territory originated in 1853 with the Gadsden Purchase. Most of the estimated 25,000 Tohono O’odham alive today reside in Arizona but about 1500 live in northern Sonora. For decades, the two groups of Tohono O’odham, never granted dual citizenship, kept in regular contact for work, religious ceremonies and festivals, crossing the border as needed without any problem. Stricter border controls have made this impossible today.

Repeated efforts to solve the “one people‑two country” problem by granting U.S. citizenship to all registered members of the Tohono O’odham, regardless of their residence, have so far not succeeded. Ironically, because of its relatively remote location, the Tohono O’odham Nation has often been called upon to provide emergency assistance to undocumented workers (and drug traffickers) attempting to cross the border who have underestimated the severe challenges of crossing this section of the harsh Sonora desert.

Land ownership along any wall-building line is another issue. Building it on federal land is relatively easy, especially if the U.S. administration continues to utilize mechanisms that ignore, or they claim trump, dozens of existing environmental and cultural laws. Costs and protests rise where the planned barrier is located on privately-owned land.

Some sections of barrier have already been built in the wrong place. In 2008, for instance, one Native American human rights delegation reported that the official International Boundary obelisks marking the Arizona/Sonora boundary had been moved about 20 meters south during barrier construction, a clear violation of international law. Costs escalate still further whenever the barrier needs to be relocated.

The effective implementation of many cross-border agreements will be adversely affected by a barrier. For instance, the U.S. Forest Service and Mexico’s National Forestry Commission have a co-operation agreement, the Bi‑national Convention on Forest Fires, for dealing with cross-border wildfires on the Arizona/Sonora border. It aims to increase public safety on both sides of the border, reduce habitat loss, and facilitate the fighting of wildfires. It allows for a united bi‑national command to be established and for firefighting brigades, together with supporting vehicles and aircraft, to cross the border by up to 16 km (10 miles) in either direction in order to battle ongoing wildfires, provided advance notice is given. With a wall, this is clearly impossible.

Quite apart from the cost implications and the potential adverse impacts for people, communities, trade and fauna in the border regions, building a wall is not the answer. Animals may not have a viable choice after a wall is built but if people still want to cross, and can’t do so by land, they will surely turn to the air, the oceans, or (as has already happened repeatedly with smugglers in both directions) underground tunnels.

In fact, despite fear-mongering news reports in the U.S. press, the flow of migrants over the past decade has actually reversed: the number of people now crossing the border from the U.S. to live in Mexico is higher than the number of Mexicans moving north. While some of the migrants moving south are Mexicans returning home, others are estadoudienses preferring to retire, live or work in Mexico.

Judy King’s Echoes from the Wall: Real Stories of Mexican Migrants (Mexico Insights, 2019) is available worldwide via Amazon. The case studies of individual migrants are excellent starting-points for geography classes about international migration in high schools and colleges.
The geography of the Spanish language: how important is Spanish around the world?

 Books and resources, Other  Comments Off on The geography of the Spanish language: how important is Spanish around the world?
Aug 242015
 

The Index of Human Development ranks Spanish as the second most important language on earth, behind English but ahead of Mandarin.

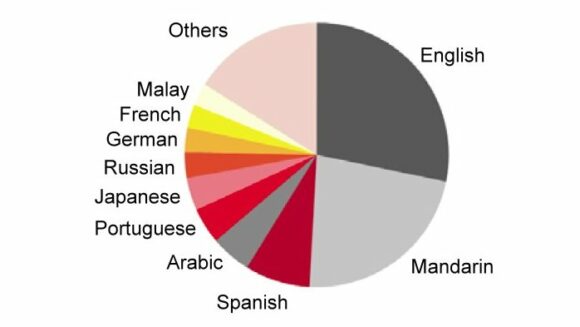
Spanish is the third most widely used language on the internet (graph), although less than 8% of total internet traffic takes place in Spanish. Spanish is the second most used language on Facebook, a long way behind English but well ahead of Portuguese.

Languages used on the Internet (2015). Source: Internet World Stats

Languages used on the Internet (2015). Source: Internet World Stats

According to El español, una lengua viva – Spanish, a living language, a report from the Instituto Cervantes in Spain (which promotes the Spanish language abroad via language classes and cultural events) there are about 559 million Spanish speakers worldwide. This figure includes 470 million native speakers and an additional 89 million who have some command of the language.

While Mexico remains the world’s largest Spanish-speaking country, with about 121 million Spanish speakers, second place belongs to the USA, followed by Colombia. The USA has an estimated 41 million native speakers of Spanish plus 11 million who are bilingual; Colombia has 48 million Spanish-speakers.

In terms of economic importance, the report’s authors calculate that Spanish speakers contribute 9.2% of the world’s GDP. About two-thirds of Spanish-linked GDP is generated in North America (USA, Canada and Mexico) and the European Union, while Latin America (excluding Mexico) accounts for 22%.

The main concentrations of Spanish speakers in the USA are in the states of New Mexico (47% of the population), California and Texas (both 38%), and Arizona (30%). 18% of New Yorkers speak Spanish and, somewhat surprisingly, more than 6% of Alaskans are also Spanish speakers. Interestingly, the US Census Office estimates that by 2050, the USA will have 138 million Spanish speakers and could then overtake Mexico as the largest Spanish-speaking nation in the world. This assumes that current predictions for Mexico’s population increase over the next 35 years hold true.

Want to learn more?

Related posts:

Feb 152014
 

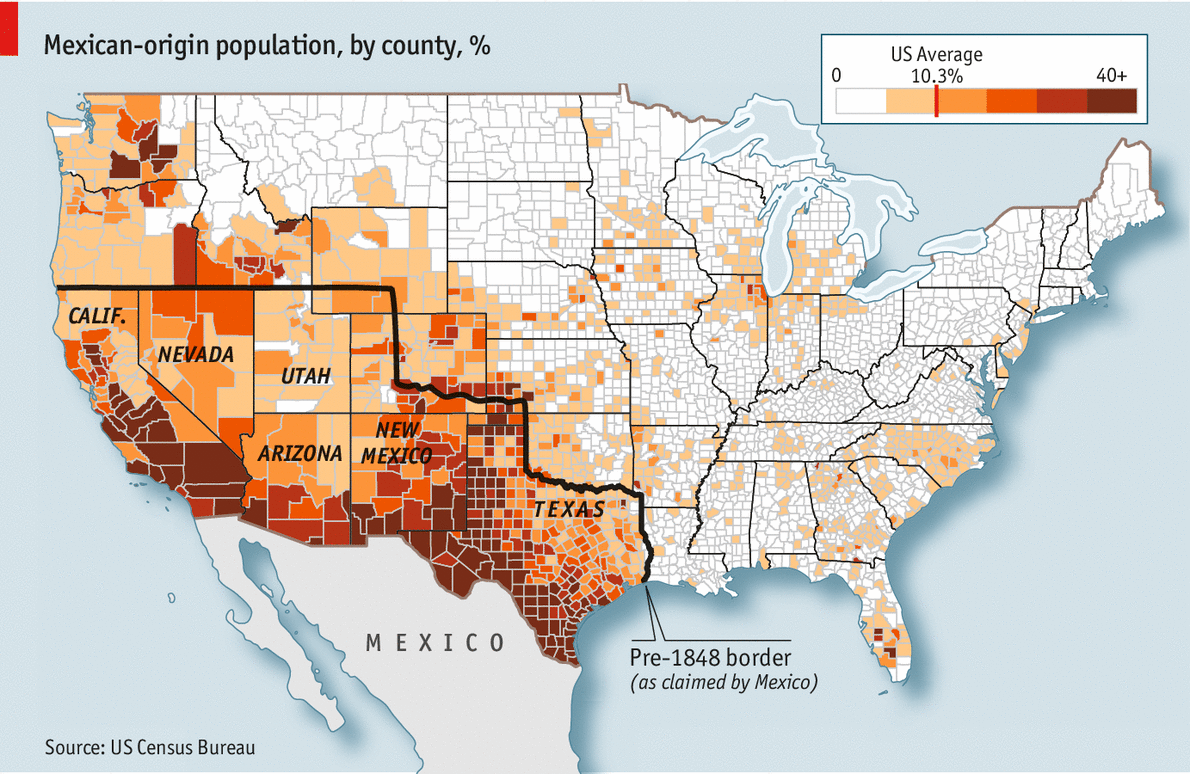
Kudos to The Economist for its short piece entitled “Old Mexico lives on” in which it points out that Mexicans and their descendents are gradually reoccupying the territory that the USA gained from Mexico in the nineteenth century. The evidence is provided by the map (below) showing “Mexican-origin population” by county for the USA. The definition is by ethnicity (origin), not citizenship.

Mexican-origin population living in USA. Source: Economist, 1 Feb 2014.

Mexican-origin population living in USA. Source: Economist, 1 Feb 2014. Click to enlarge.

In February 1848, Mexico was forced to cede more than half its territory to the USA. The area handed over included most of present-day Arizona, California, Nevada, New Mexico and Utah, plus parts of several other states. (Texas had declared its independence from Mexico in 1836).

Note the close correlation between areas that were part of Mexico prior to 1848 and those that now have the highest numbers of residents of Mexican-origin. As The Economist points out, “communities have proved more durable than borders”. Mexican migrants have been preferentially attracted to areas that were originally Hispanic, and where some residents can “trace their roots to long before the map was redrawn”. As The Economist concludes, “They didn’t jump the border—it jumped them.”

Related posts:

Where do most Hispanics in the USA live?

 Other  Comments Off on Where do most Hispanics in the USA live?
Sep 232013
 

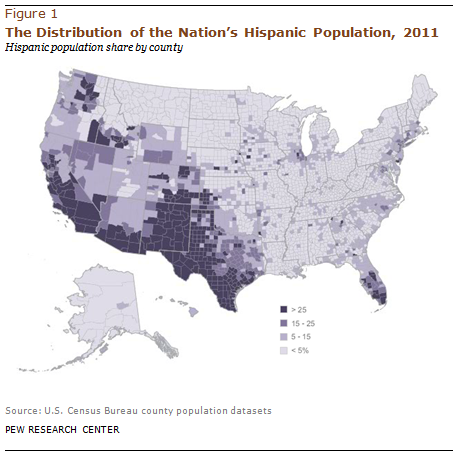
A recent study by Pew Research analyzes the geographical distribution of the over 53 million Hispanics who currently live in the USA. The “Hispanic” or “Latino” population is composed of many different segments. It includes families that have lived in the USA for numerous generations as well as recent immigrants from many countries. Mexicans are by far the largest Hispanic origin group. There are 34.7 million Mexicans in the USA accounting for 64% of all Hispanics. A future post will look at the geographic distribution of Mexicans in the USA. Several previous posts, including “Recent trends for Mexicans living in the USA”, have investigated the socio-economic characteristics of Mexicans living in the USA.

Though Hispanics are spreading throughout the country, they still tend to be concentrated in the west, particularly states that border Mexico [see map]. Almost half (46%) of Hispanics live in California (14.4 million) or Texas (9.8). Other states with relatively large Hispanic populations include Florida (3.5m), Illinois (2.1m) and Arizona (1.9m). Almost 47% of New Mexico’s population is Hispanic compared to 38% in both California and Texas.

Map of Hispanic population in USAFully 44% of Hispanics live in only 10 metropolitan areas. Almost half (46%) of the Greater Los Angeles population is Hispanic. The Los Angeles–Long Beach metro area has 5.8 million Hispanics and the neighboring Riverside–San Bernadino metro area has another 2.1 million, giving Greater Los Angeles 7.9 million Hispanics, 15% of the USA total. The New York–Northeastern New Jersey metropolitan area is next with 4.3 million Hispanics. Other metro areas with large Hispanic populations include Houston (2.1m), Chicago (2.0m), Dallas (1.8m), Miami (1.6m), San Francisco–San Jose (1.6), Phoenix (1.2m), San Antonio (1.1m) and San Diego (1.0m).

Over 80% of the Greater Los Angeles Hispanic population is Mexican. Mexicans also dominate the Hispanic populations in Houston (78%), Chicago (79%), Dallas (85%) as well as most other metro areas in the USA. In metro New York, Puerto Ricans are most numerous among Hispanics (28%) followed by Dominicans (21%) and Mexicans (12%). Puerto Ricans are also most numerous in Orlando (51%), Tampa–St Petersburg (34%), Philadelphia (56%), Boston (29%) and Hartford (69%). Cubans dominate the Hispanic population in Miami (55%), Fort Lauderdale (21%) and West Palm Beach (21%). In metro Washington DC, Salvadorians are most numerous among Hispanics (32%).

Roughly one third (36%) of all Hispanics in the USA are foreign-born; the rest were all born in the USA. Miami has the highest proportion of foreign-born Hispanics with 66%. No other metro area with over a million Hispanics has more than 43% foreign-born. On the other hand, only 17% of Hispanics in the San Antonio area are foreign-born with 83% born in the USA.

Source of data:

Related posts:

The impact of immigrants on U.S. public budgets

 Updates to Geo-Mexico  Comments Off on The impact of immigrants on U.S. public budgets
Sep 052013
 

As the US Congress debates new immigration reform legislation there is considerable confusion concerning the fiscal impact of immigrants. One side argues that immigrants pay relatively little in taxes and absorb costly benefits in terms of public health, education, welfare, etc. Others note that immigrants often pay significant amounts in taxes and get little back in terms of benefits. Obviously, it depends on the immigrant and perhaps on their legal status.

OECD-migrationIn June 2013, the OECD published “International Migration Outlook,” a study on the budgetary impacts of immigrants to OECD countries. (OECD countries Mexico and 29 other mostly rich and mainly European countries). The study compares native-born with foreign-born residents, some of whom may have already become citizens. The study suggests that immigrants may have a slightly positive impact on fiscal budgets. The average for all OECD countries was 0.3% of GDP; the comparable figure for the USA was 0.03%.

Immigrants tend to have lower incomes, pay a bit less in taxes, but receive less in benefits. They tend to be younger and thus receive less in public health benefits. If they have children, they receive considerable education benefits. Obviously these are gross generalizations as some immigrants are highly paid executives and scientists, who pay significant taxes, while others may work as domestics or laborers, paying far less in taxes. Given that many public costs, including defense and debt service, are very hard to allocate to migrants versus native-born, the study suggests that immigration appears to be neither a drain nor a gain on fiscal budgets.

A big issue in the USA is the specific impact of Mexican immigrants on the fiscal budget, particularly the impacts of undocumented immigrants. Many legal immigrants from Mexico are family members joining their relatives. They may or may not be employed and thus may not pay income taxes. On the other hand, virtually all illegal immigrants seek employment. Furthermore, many obtain formal sector jobs by using fake Social Security cards or “Individual Tax Identification Numbers.” Their employers deduct federal and state income tax from their paychecks and forward these funds to government tax agencies.

Undocumented immigrants rarely file tax returns and thus very rarely receive the tax refunds to which they might otherwise be entitled. All immigrants pay considerable amounts in gasoline and sales taxes as well as property taxes, either directly or indirectly as part of their rent. Given that most illegal immigrants are rather young, relatively healthy and without children, they may have only a small impact on public education and health expenses. Their children are often born in the US, are US citizens, and should not be considered immigrants. It appears that undocumented immigrants might be paying more into the public coffers than they receive in benefits. A closer look at the data may provide some answers.

A 2007 study by the US Congressional Budget Office (CBO) entitled “The Impact of Unauthorized Immigrants on the Budgets of State and Local Governments” directly addressed this issue. The study notes that at the Federal level roughly 50% of illegal immigrants pay income or payroll taxes, which include Medicare taxes. But they generally are excluded from such Federal benefits as Social Security pensions, Medicare and Medicaid (other than emergency services), Food Stamps, and Assistance to Needy Families. The data suggest that in general illegal immigrants usually pay more in federal taxes than they receive in benefits. On the other hand, a number of court cases mandate that state and local governments cannot withhold from illegal immigrants certain services such as education, selected health care, or law enforcement. Many illegal immigrant children do not speak English; therefore their education may be more costly.

In assessing the fiscal impact on state and local government budget, the CBO analyzed 29 reports published since 1990. The study noted that undertaking such an analysis is very challenging and involves many big assumptions. Still the CBO analysis concluded that the relatively small amount spent by state and local governments on services for illegal immigrants is not fully offset by the even smaller amount of tax revenues collected from them including federal revenues they may receive for this purpose.

In conclusion, available research suggests that the impact of immigrants on public budgets is not very clear. With respect to all immigrants, there appears to a slight positive fiscal impact according to a recent OECD study. The older CBO analysis indicates that undocumented immigrants appear to have a positive impact of the federal budget, but a negative fiscal impact for state and local governments. Of course, the impact varies enormously among migrants depending on their incomes, tax brackets, consumption patterns and needs.

Related posts:

Recent trends for Mexicans living in the USA

 Updates to Geo-Mexico  Comments Off on Recent trends for Mexicans living in the USA
Jul 152013
 

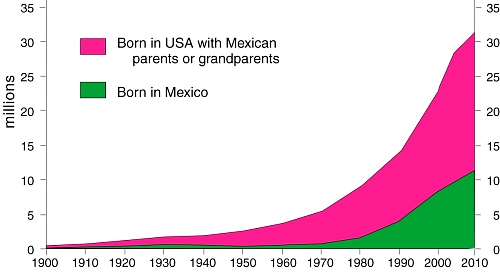
The population of Mexican origin in the USA now totals more than 33.7 million, including 11.2 million born in Mexico and 22.3 million who identify themselves as being of Mexican origin. Mexicans account for 64% of all Hispanics in the USA and 11% of the country’s total population.The changing profile of Mexicans living in the USA.

A Pew Research Hispanic Center analysis of US Census data shows that the portion of the US population that is of Mexican origin is undergoing a gradual transformation. The average age of residents of Mexican origin is becoming younger and average education levels are on the rise. In 1990, only 25% of the Mexican migrants had a high school diploma, compared to 41% today. Even so, among Hispanics, Mexicans have the lowest rate of university education and the highest percentage of people without any health insurance.

Currently, 71% of the Mexicans who live in the USA have lived in the country from more than 10 years, compared to around 50% in 1990. The proportion of migrants that is male fell slightly from 55% in 1990 to 53% in 2010.

The average household income of households with at least one member of Mexican origin was $38,884, compared to a USA-wide average of $50,502. About 49% of families of Mexican origin own their own homes, compared to a 64.6% rate for the USA as a whole.

In terms of jobs, 26.7% of people of Mexican origin living in the USA work in services, 21.1% in sales positions or offices, 18% in transportation, 17.8% in construction, and 16.4% in administration, business, science and the arts

Related posts:

Feb 222010
 

Mexicans have a long history of working and living in the USA. Migration is one of the most important linkages between North America’s two most populous countries. The Mexican diaspora in the USA is an integral part of both Mexican and US society. Each year roughly 250 million legal border crossings are made, about half by Mexicans. A much smaller number, perhaps a few hundred thousand, cross the border illegally despite US efforts to tighten border controls. The Mexican communities on either side of the border are very closely linked.

Mexicans in the USA
As of 2008 over 31 million Mexicans lived in the USA (see graph). This is more than one fifth of all Mexicans anywhere and a larger number than in any single Mexican state. Almost 19 million Mexican-Americans were born in the USA of Mexican parentage; these have always outnumbered migrants.

Roughly 10% of everyone born in Mexico now lives in the USA. This figure was only 5% as recently as 1990 and only 1.4% in 1970. Migrating Mexicans are as likely to move to the USA as within Mexico. Clearly, in recent decades, an increasing number of Mexicans have chosen to live in the USA.

[Extract from chapter 27 of Geo-Mexico: the geography and dynamics of modern Mexico]