hoy no circula | Geo-Mexico, the geography of Mexico

Nov 062013
 

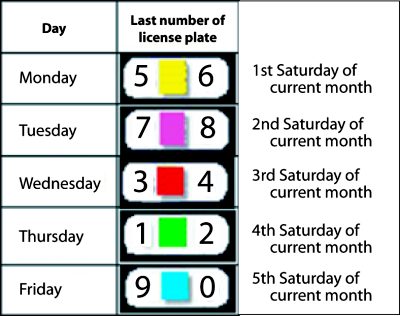
Mexico City and its surrounding areas have a strict “Hoy no circula” (“Today you can’t drive” or “Day without a Car”) program. The program is intended to reduce air pollution from vehicle emissions.

Day without a car table

The graphic shows the major rules for most vehicles. With few exceptions, these rules apply to all tourist vehicles as well as Mexican-plated vehicles.

Click here for a Wikipedia article with more details of the rules, including Saturday rules and exceptions

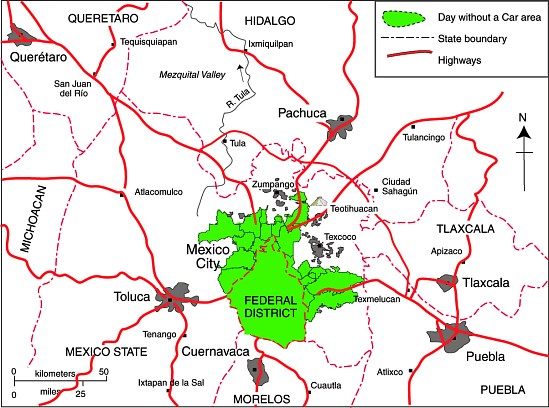
Area subject to “Day without a Car” rules, November-2013. All rights reserved.

As of November 2013, the “Hoy no circula” program applies to the Federal District and the following 18 adjoining municipalities in the State of Mexico (see map):

  • Atizapán de Zaragoza
  • Coacalco de Berriozabal
  • Cuautitlán
  • Cuautitlán Izcalli
  • Chalco
  • Chimalhuacan
  • Chicoloapan
  • Ecatepec de Morelos
  • Huixquilucan
  • Ixtapaluca
  • La Paz
  • Naucalpan de Juárez
  • Nezahualcóyotl
  • Nicolás Romero
  • Tecámac
  • Tlalnepantla de Baz
  • Tultitlán
  • Valle de Chalco Solidaridad

No responsibility or liability is assumed for any situation arising from the information contained within this post, which is believed to be accurate at the time of writing. For more details about the growth of Mexico City, and its urban issues and management strategies, consider buying a copy of Geo-Mexico: the geography and dynamics of modern Mexico, available from all good bookstores, as well as via amazon.com or this webpage.

The geography of Mexico City: index page

 Index page  Comments Off on The geography of Mexico City: index page
Sep 052016
 

This index page has links to our more important posts about Mexico City. Other index pages include:

Administrative

Mexico City background / physical geography / hazards

Water supply / drainage

Sewers / Drainage

Aztecs – Food supply

History / Urban growth / Urban morphology / Housing

Megalopolis?

Mexico City air quality in 1980 (Photo: Tony Burton)

Mexico City air quality in 1980 (Photo: Tony Burton)

Traffic, taxis and air pollution

Metro/subway system

Sustainable Transport / Cable Cars

Airport

Urban revitalization

Other

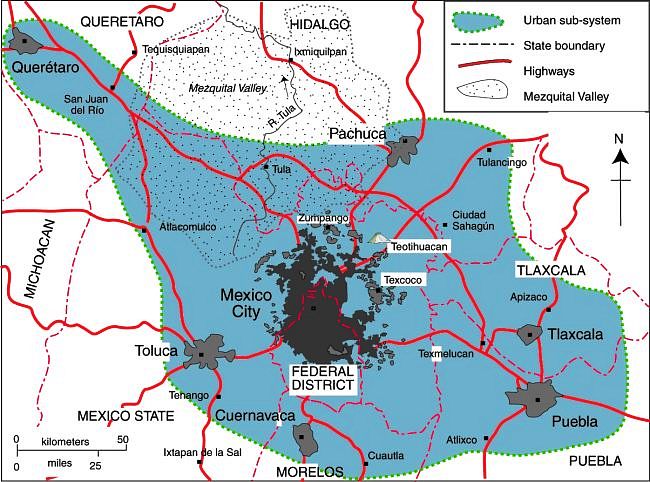
Map of Mexico City urban system:

Map of Mexico City urban system

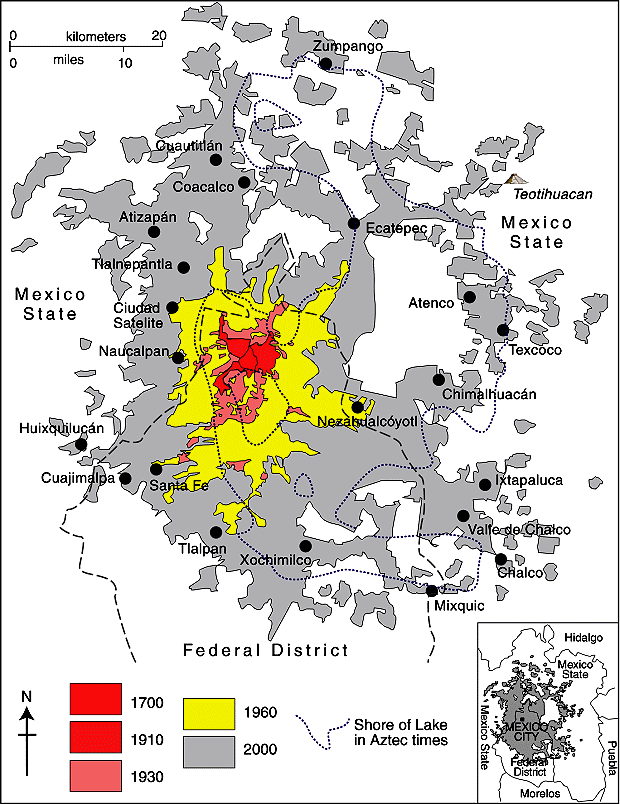
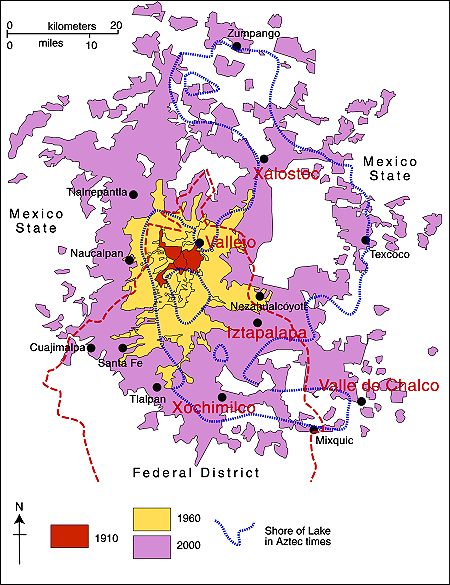
Map of Mexico City urban system. Click to enlarge. (Geo-Mexico Fig 23.1; all rights reserved).

Spatial growth of Mexico City Metropolitan Area:

Mexico City Metropolitan Area (Geo-Mexico Fig 22.2; all rights reserved)

Spatial growth of Mexico City Metropolitan Area (Geo-Mexico Fig 22.2; all rights reserved)

Locations in Valley of Mexico with high incidence of ground cracks:

Mexico City cracks map

Locations in Valley of Mexico with high incidence of ground cracks. Cartography: Tony Burton; all rights reserved.

General posts about Mexico’s urban geography

Monitoring air pollution in Guadalajara

 Books and resources, Teaching ideas  Comments Off on Monitoring air pollution in Guadalajara
Jun 162014
 

Air pollution in the city of Guadalajara, the state capital of Jalisco, has worsened over the past decade, though there are some recent signs of improvement :

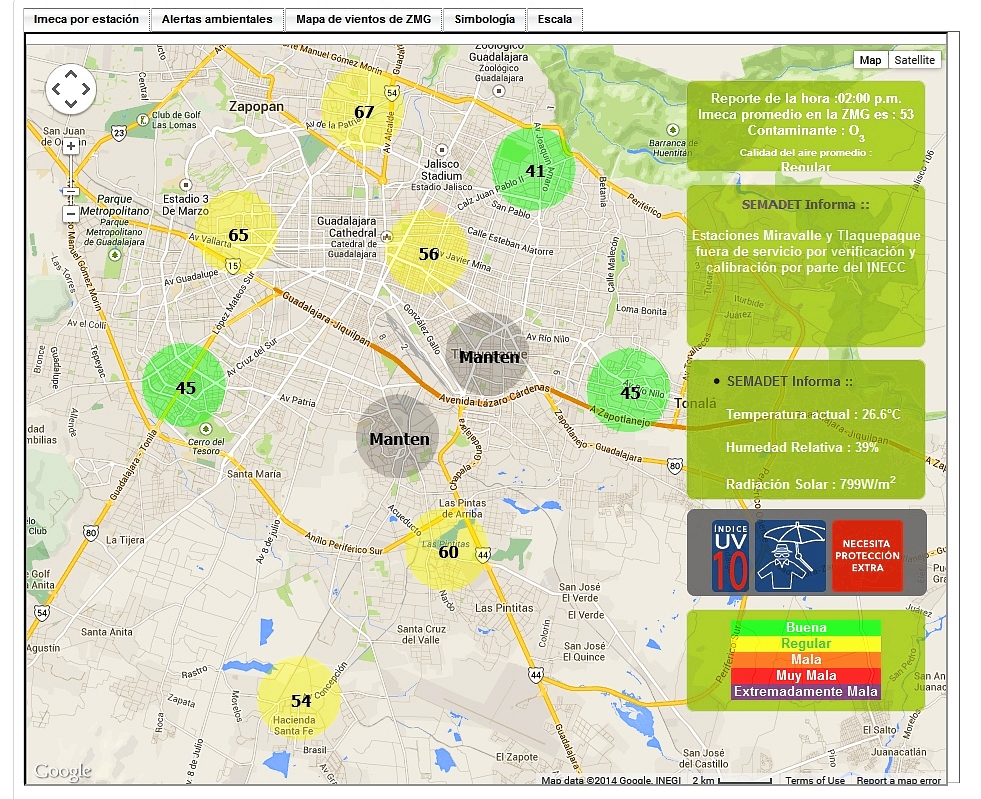
The Jalisco Environmental Agency now has a webpage where residents and travelers alike can now monitor Guadalajara’s air quality on an hourly basis. Readings for 10 stations are superimposed on a basemap on that page, together with links to graphs showing recent trends and other meteorological data. Tabs above the map also give a link to the current wind conditions across the city. Historical data (in Spanish) can also be accessed via the link to “Datos”.

Screenshot of Guadalajara air monitoring webpage

Screenshot of Guadalajara air monitoring webpage. Note: Two stations are shown as undergoing maintenance.

The map provides summary data in IMECAs, which stands for Índice Metropolitano de la Calidad del Aire (Metropolitan Index of Air Quality). IMECAs are a compound index combining measurements of concentrations of ozone (O3), sulphur dioxide (SO2), nitrogen dioxide (NO2), carbon monoxide (CO) and particles smaller than 10 micrometers (PM10).

In Guadalajara, formal smog alerts are issued if average readings rise above 150 IMECAs (“Very Bad”) for more than two consecutive hours. If readings rise above 200 IMECAs (“Extremely Bad”), then “serious alerts” impose restrictions on vehicle use and may lead to the suspension of school classes.

In Guadalajara, the worst air quality tends to be in the southern and eastern sections of the city. It also tends to occur in the months of April and May, immediately before the rainy season gets underway. The webpage system gives everyone an easy way to check these assertions!

In Guadalajara, mitigation efforts are centered mainly on reducing vehicle emissions (partly by stricter emissions testing and verification, and partly by improvements to the public transport network) since they are the main source of pollution. To date, there are no plans in Guadalajara to introduce a “Day without car” program similar to that in Mexico City:

Teaching idea

Use the Jalisco Environment Agency webpage to monitor Guadalajara’s air pollution and identify any patterns or trends related to air pollution in the city. Consider suggesting one or more hypotheses, such as “Air pollution gets worse in the afternoon”, or “The level of air pollution in eastern Guadalajara is worse than in western Guadalajara”, before testing your ideas using the online data.

Related posts:

Aug 052013
 

A recent study published by the Clean Air Institute analyzed air pollution in 22 Latin American cities:

  • Air Quality in Latin America: An Overview (May 2013; pdf file)

Six Mexican cities were included in the study: Mexico City, Guadalajara, Monterrey, Puebla, Ciudad Juárez and León. However, only limited data were available for Puebla, Cd. Juárez and León. One of the main conclusions of the study is that Mexico has about the worst urban air pollution in Latin America. It is believed to be responsible for about 15,000 deaths in Mexico each year.

The focus was on the following air pollutants:

  1. Particulate matter is divided into two measures; particles less 2.5 microns in diameter (PM2.5) and those less than 10 microns (PM10). PM2.5 pollution is extremely harmful because it penetrates deep into lungs causing inflammation and worsening heart and lung diseases. This can be fatal.
  2. Ozone is formed in the air when oxides of nitrogen and volatile organic compounds mix with intense sunlight. The very intense sunlight in Mexican cities makes them particularly prone to ozone pollution.
  3. Nitrogen dioxide (NO2) is caused by high temperature combustion of fossil fuels in vehicles, factories and power plants. It can aggravate lung diseases as well as contribute to ozone and fine particle pollution.
  4. Sulfur dioxide (SO2), which also comes from burning fossil fuels, contributes to heart and respiratory disease. Unfortunately, not all of the 22 cities had data on all four pollutants. Consequently comparisons among cities are a bit limited.

According to the study, Mexican cities had some of the worst urban particulate pollution in Latin America, significantly above WHO standards. Of the 16 cities with data, Monterrey had by far the worst PM10 pollution with 85.9 micrograms per cubic meter (ug/m3); considerably worse than the perennially dusty Lima with 62.2 ug/m3. Guadalajara came second with 70.1 ug/m3, Mexico City was 6th with 57.0 ug/m3, and León placed 11th with 39.0 ug/m3, even worse than Sao Paulo at 36.5 ug/m3. Though not in the study, Mexicali has worse PM10 pollution than Monterrey. Also Monterrey’s PM10 levels are much better than many major world cities including Cairo, Delhi, Kolkata, Beijing, Chengdu, Bangalore, Shanghai, Dacca, Jakarta, and Karachi.

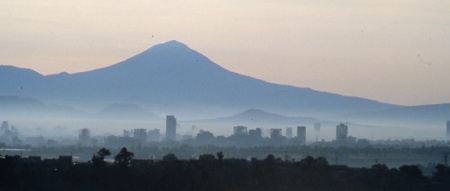
Mexico City air quality in 1980 (Photo: Tony Burton)

Mexico City air quality in 1980 (Photo: Tony Burton)

Mexico did a bit better with respect to the more serious PM2.5. Of the 11 cities with data, Bogota was worst with 35.1 ug/m3 followed by Lima at 31.5ug/m3 and San Salvador and Montevideo at 28.0 ug/m3. The two Mexican cities with data, Mexico City (26.2 ug/m3) and Monterrey (25.9 ug/m3) were 6th and 8th.

Mexican cities also have some of the highest levels of ozone pollution. Of the ten cities with data, five of the six worst were Mexican cities. Guadalajara had the highest ozone pollution with 69.3 25.9 ug/m3 followed closely by León 68.9 at ug/m3. Mexico City was 4th (59.4 ug/m3); Monterrey was 5th (55.2 ug/m3); and Cd. Juárez came 6th (46.3 ug/m3), just ahead of Quito (44.1). Much better ozone levels were recorded by Sao Paulo (36.0 ug/m3), Santiago (28.8 ug/m3) and Bogota (21.1 ug/m3).

Cities in Mexico also had high levels of nitrogen dioxide. The highest levels were in Montevideo (70.0 ug/m3), but Guadalajara (57.2ug/m3), Mexico City (54.2 ug/m3) and León (45.5 ug/m3) placed 2nd, 3rd and 4th worst among the 14 cities with data. Monterrey was much better with the third lowest nitrogen oxide level (29.0 ug/m3), trailing only Lima (12.8 ug/m3) and Quito (23.3 ug/m3).

Mexican cities were also among the worst in terms of sulfur dioxide pollution. Of the 13 cities with data, León had by far the highest level with (23.4 ug/m3), followed by Medellin (16.0 ug/m3). Mexico City was 3rd worst (15.3 ug/m3); Monterrey was 4th (13.1 ug/m3); and Guadalajara was 6th (8.6 ug/m3).

In summary, the study indicates that Mexico has about the worst urban air pollution in Latin America. Fortunately, Mexico City, which used to be considered one of the most polluted cities in the world, has significantly improved its air quality in the last few decades. (see Rhoda and Burton, Geo-Mexico: The geography and dynamics of modern Mexico, p 177)

On the other hand, other major cities in Mexico have not had the same experience. The data in this study appear to suggest that among Mexico’s three biggest cities, Guadalajara has the worst air pollution followed by Mexico City and then Monterrey. (This study found insufficient data for comparisons with Puebla, Cd. Juárez and León.)

Other posts on urban air pollution:

The geography of road transport in Mexico

 Excerpts from Geo-Mexico, Updates to Geo-Mexico  Comments Off on The geography of road transport in Mexico
Oct 202011
 

Mexico’s road network is heavily used, accounting for over 95% of all domestic travel.  On a per person basis, Mexicans travel an average of 4500 km (2800 mi) by road each year.

In this post, we try to answer several general questions relating to the geography of road transport in Mexico.

How many cars are there?

On average there are about seven people per car in Mexico, compared to about six in Argentina, ten in Chile and less than two in the USA and Canada. There are far more cars in urban areas with their many businesses, taxis and wealthy residents. In poor rural parts of southern Mexico, private car ownership is quite rare.

Is there an efficient bus system?

Mexico also has an inter-city bus system that is one of the finest in the world. The nation’s fleet of more than 70,000 inter-city buses enables passengers to amass almost half a trillion passenger-km per year.

Where are Mexico’s vehicles made?

Almost all the vehicles on Mexico’s roads were built in Mexico. Mexico’s automobile-manufacturing sector produces about 2.2 million vehicles a year but the majority of production (about 1.8 million vehicles each year) is for export markets. Mexico is the world’s 9th largest vehicle maker and 6th largest vehicle exporter. In recent years, the relaxation of strict import regulations has resulted in more vehicles being imported into Mexico; many of them are luxury models not currently made in Mexico.

The major international vehicle manufacturers with plants in Mexico include Volkswagen, Ford, Nissan, GM, Renault, Toyota and Mercedes-Benz. Mexican companies include Mastretta, which specializes in sports cars, and DINA, a manufacturer of trucks, buses and coaches.

For more information about vehicle manufacturing in Mexico:

Where are Mexico’s vehicles?

Mexico has about 20 million registered vehicles, about one for every five persons (2005). Which areas have the most and least vehicles? It turns out that the northernmost state, Baja California, has the most with 37 registered vehicles per 100 people. The southernmost states, Chiapas and Oaxaca, have about one sixth as many with 6.6 and 6.9 respectively. In fact there is a very strong statistical relationship between latitude and vehicles (see graph). How can this be?
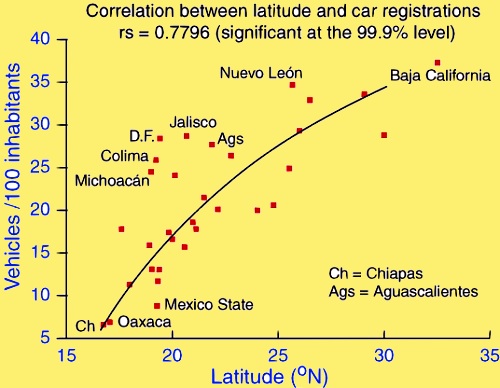
Scattergraph of latitude and vehicle registrationsWe are not suggesting a direct causal relationship. Many factors are interrelated. First, the states in the north tend to be wealthier; the Spearman rank correlation for GDP/person and latitude is 0.58. Vehicle ownership is closely related to GDP/person (rs = 0.59). Both these correlations are significant at the 99% level.

In addition, northern states are close to the USA, a vehicle-oriented society. However, there are some anomalies to the general pattern. The very wealthy Federal District has 50% more vehicles than would be expected from its latitude alone. States with many migrants, such as Jalisco and Michoacán, also have more vehicles than expected given their latitude. An added complication is that more than a million foreign-plated cars in Mexico (imported temporarily by returning migrants or foreigners) are not included in these figures.

How many road accidents are there in Mexico?

Mexico’s National Council for Accident Prevention estimates that there are 4 million highway accidents each year in Mexico. The latest figures (for 2010) show that there were 24,000 fatalities as a result of these accidents, with 40,000 survivors suffering some lasting incapacity. These figures include some of the 5,000 pedestrians struck by vehicles each year. Traffic accidents are currently the leading cause of death for those aged 5-35 in Mexico, and the second cause of permanent injury for all ages.

Why are there so many accidents?

Driver education plays a major role in road safety. Part of Mexico’s problem is the low budget it allocates each year for road safety—just US$0.40 compared to more than $3.00/person in the USA, more than $7.00/person in Canada and up to $40.00/person in some European countries.

It is no surprise that a high percentage of drivers involved in traffic accidents in Mexico have alcohol in their system. This is one of the reasons why accidents are statistically more frequent in the evenings from Thursday to Saturday. One study reported that as many as 1 in 3 of drivers in Guadalajara was under the influence of alcohol while driving, and 1 in 5 of Mexico City drivers.

Driving without insurance is common in Mexico; according to insurance companies, only 26.5% of Mexico’s 30.9 million vehicles have any insurance.

Related posts: