Dec 072015
 

The 2015 hurricane season in Mexico for Pacific coast storms started on 15 May and ended on 30 November. For Atlantic storms, the hurricane season extended from 1 June to 30 November. Hurricanes are also known as typhoons or tropical cyclones.

saffir-simpson-scale

This year, predictions for hurricane activity in the Atlantic were fairly close to reality, but the Pacific Coast forecast fell well short of predicting the number and severity of hurricane activity.

Atlantic and Caribbean hurricanes

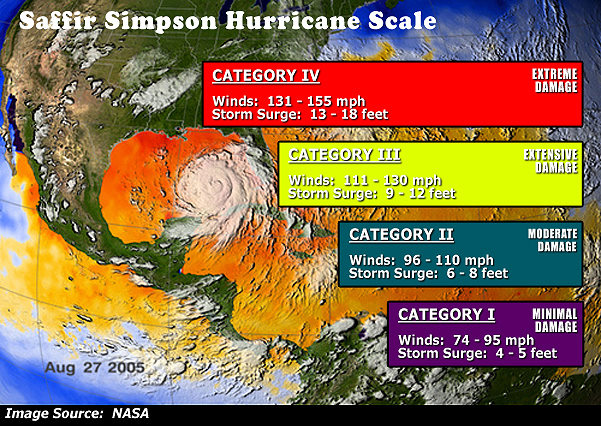
The early season (May) prediction for 2015 for hurricane activity in the Atlantic was that it would be below the 1981-2012 average, with 7 named storms forming in the Atlantic: 4 tropical storms, 2 moderate hurricanes (1 or 2 on the Saffir-Simpson scale), and 1 severe hurricane (3, 4 or 5 on the Saffir-Simpson scale).

In reality, the 2015 Atlantic season did turn out to be slightly less active than the long-term average, but still saw the Caribbean and Gulf coasts affected by 11 named storms: 7 tropical storms, 2 moderate hurricanes and 2 severe hurricanes.

Eastern Pacific hurricanes

For the Pacific coast, Mexico’s National Meteorological Service (Servicio Meteorológico Nacional, SMN) was anticipating 19 named storms in 2015: 8 tropical storms, 7 moderate hurricanes, and 4 severe hurricanes. The 2015 season actually turned out to be the second most active Pacific hurricane season ever, with a total of 26 named storms: 10 tropical storms, 5 moderate hurricanes, and 11 severe hurricanes.

The number of hurricanes (16) in the eastern Pacific tied the all-time record, and the number of severe hurricanes (11) broke all previous records. The activity included Hurricane Patricia, the most powerful hurricane ever. Fortunately for most of Mexico, this storm lost power very rapidly once it came onshore.

Nov 232015
 

As we discussed in this earlier post, historical analysis combined with greater climatological understanding shows that many of the worst droughts and floods in Mexico have been associated with either El Niño Southern Oscillation (ENSO) events or with the related Pacific-North American Oscillation. Perhaps 65% of the variability of Mexican climate results from changes in these large-scale circulations.

The World Meteorological Organization (WMO) says the 2015-2016 ENSO is expected to be one of the three most powerful ENSO events since 1950 with effects that will last for up to eight months.

What will this winter’s El Niño bring? 

  • slightly higher ocean water temperature off west coast; some fish species may migrate northwards
  • some winter rain in north-west
  • increased winter storms, and cooler temperatures, along east coast; risk of flooding, mudslides
  • reduced summer rainfall in Mexico’s central highlands; risk of drought and lower crop yields

This winter, according to the Center for Scientific Investigation and Higher Education of Ensenada (CICESE), the Baja California Peninsula is likely to receive more rain than usual during this year’s very strong ENSO (El Niño) event.

The distribution of fish species is likely to change as the ocean temperatures are higher than usual, resulting in the migration of some species, leaving fewer fish off the coast of Baja California, one of the world’s most important commercial and sports fishing zones. Sardine fishermen may have a difficult season, incurring greater costs as they try to locate viable schools of fish.

A NASA climatologist predicts that California (USA) will be on the receiving end of more winter storms (January-March), and heavier rain, than usual. This increases the risk of hazardous mudslides in some coastal communities. It could also mean more mosquitoes, and an increased chance of contracting dengue fever or chikungunya.

What is the longer term outlook?

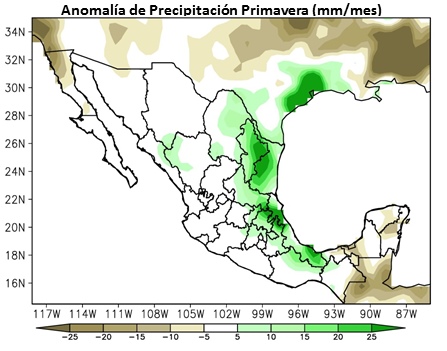
The first map shows likely precipitation anomalies for early next year (Spring). Areas shaded brown are areas expected to receive less rainfall than normal. Areas shaded light blue through green are predicted to get more rain than usual.

Spring precipitation anomalies

Spring precipitation anomalies in a strong El Niño year. Source: CNA

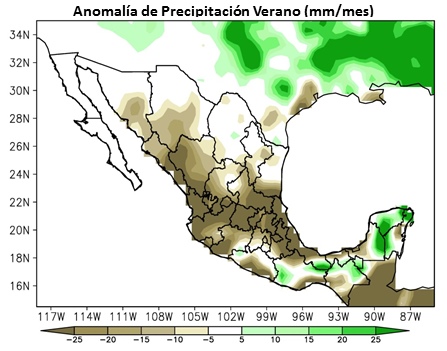
The second map shows summer precipitation anomalies. A significant reduction in rainfall is expected across most of central Mexico, though some areas in southern Mexico will likely get more rainfall than normal.

Summer precipitation anomalies in a strong El Niño year. Source: CNA

Summer precipitation anomalies in a strong El Niño year. Source: CNA

We end with one piece of good news for our more active readers. Previous El Niño events have brought great surfing to the west coast of Mexico, so make your travel and hotel plans as soon as possible.

Related posts:

Hurricane Patricia, a Category 5 hurricane, about to hit the Pacific coast

 Mexico's geography in the Press  Comments Off on Hurricane Patricia, a Category 5 hurricane, about to hit the Pacific coast
Oct 232015
 

Follow-up, 28 October 2015: In the event, Hurricane Patricia did not cause anywhere near the catastrophic damage that it might have. This was partly because it was narrower than most hurricanes of its size and happened to continue on a path that missed the major resorts of Puerto Vallarta and Manzanillo, and partly because it then rapidly lost strength as it smashed into the Western Sierra Madre (Sierra Madre Occidental), though it did bring torrential rain to many areas. This post-hurricane report in the Mexico Daily News summarizes the impacts.

Post-hurricane photos and video:

Original post:

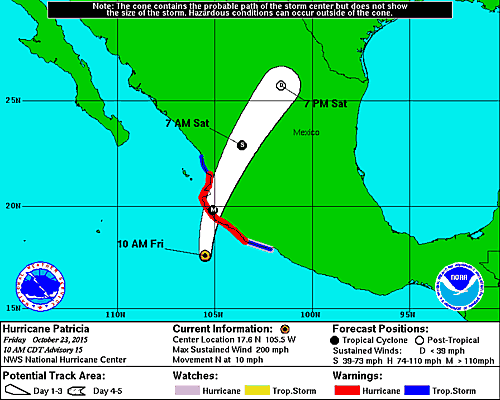
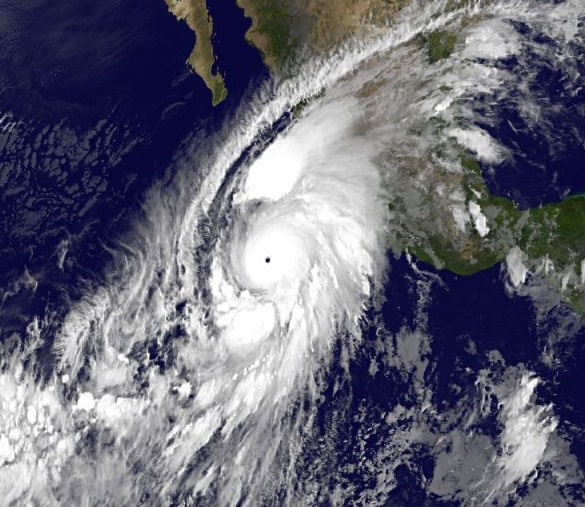
As of Friday morning (23 October), Hurricane Patricia is a Category 5 hurricane, the highest rating possible, and “now the strongest ever hurricane to hit the eastern north Pacific region”, according to World Meteorological Organization spokeswoman Clare Nullis, citing an update from the US National Hurricane Center (NHC).

Hurricane Patricia’s central pressure of 880mb is the lowest for any tropical cyclone globally for over 30 years.

The maximum sustained winds associated with Hurricane Patricia are up to 325 km/hr (200 mi/hr), “enough to get a plane in the air and keep it flying”.

hurricane-patricia-2

Hurricane Patricia is heading towards land at 16 km/hr (10 mi/hr), and is currently predicted to make landfall somewhere close to Manzanillo in the state of Colima, later today (Friday 23 October).

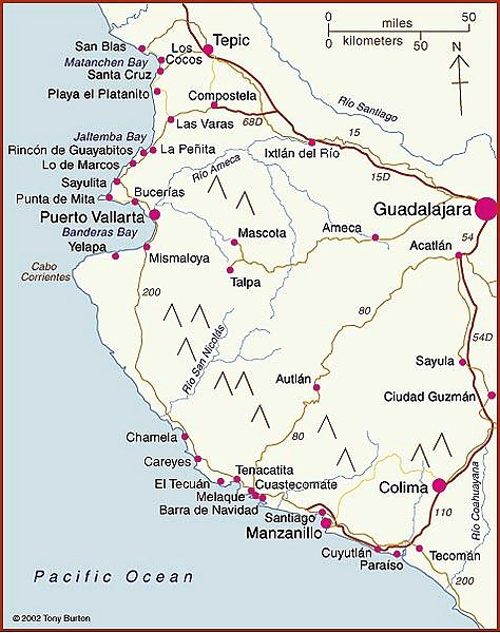
Map of Pacific Coast beaches. Copyright 2010 Tony Burton. All rights reserved.

Map of Pacific Coast beaches. Copyright 2010 Tony Burton. All rights reserved.

Hurricane warnings are in effect for several towns along the Pacific coast, including the major resort of Puerto Vallarta. Puerto Vallarta has established 18 shelter locations to house evacuees.

People living in the coastal areas of the states of Nayarit, Jalisco, Colima and Michoacán are all likely to experience severe impacts from this hurricane. The hurricane could cause a significant storm surge up to 2 meters high along much of the coast, and potentially up to 6 meters high in some bays such as Barra de Navidad-Melaque, and neighboring Cuestacomate.

hurricane-patricia

Officials are warning residents to prepare for torrential rain (in excess of 300 mm is expected in some areas), exceptionally-strong winds and power outages, and are readying emergency shelters. Air traffic is already being affected, with delays reported for various domestic flights.

Mexico’s national water commission, CONAGUA, reports that the government has 1,782 temporary shelters available in the states of Michoacán, Colima, and Jalisco with a combined capacity of more than 258,000 people. Around 50,000 people should have been evacuated before the hurricane hits land, according to Mexican Civil Protection agencies.

Once it makes landfall, the hurricane is expected to weaken quickly, though inland areas, such as Guadalajara and the Lake Chapala area, will receive heavy rain.

Related posts:

An evaluation of Mexico’s early warning system for hurricanes (tropical cyclones).

 Other  Comments Off on An evaluation of Mexico’s early warning system for hurricanes (tropical cyclones).
Aug 312015
 

This interesting graph comes from “El sistema de alerta temprana ante ciclones tropicales desde una perspectiva de riesgo” (“The early warning system for tropical cyclones from a risk perspective”) by Dr. Víctor Orlando Magaña Rueda and his fellow researchers Adalberto Tejeda Martínez and Gustavo Vázquez Cruz, published in: H2O Gestión del agua #1 (Sacmex, 2014).

It shows the economic losses (line graph) and loss of lives (bar graph) resulting from hydro-meteorological events between 1980 and 2013. Some major storm events are named on the graph. The two background colors divide the period into before and after the introduction, in 2000, of Mexico’s early warning system (Sistema de Alerta Temprana ante Ciclones Tropicales, Siat-CT).

Graph from

Graph from Magaña et al (2014)

Overall, the trends are for some reduction over time in loss of life, but a rapid escalation since 2004 in the economic costs associated with storms and other extreme weather events. This echoes the changes seen in impacts around the world for most hazard types in recent decades.

Given that lives are still being lost, however, the researchers suggest that it is time to re-evaluate Mexico’s early warning system for tropical cyclones. Storms such as Wilma and Stan in 2005, Alex in 2010 or Manuel and Ingrid in 2013, they say, show that the system has not been entirely successful in its principal objective of avoiding loss of life.

The increase in economic costs of hazard events is sometimes attributed to insurance payments but in Mexico’s case, and taking the example of Hurricanes Ingrid and Manuel, only about 20% of total losses were covered by insurance, according to the Mexican Insurers Association (Asociación Mexicana de Instituciones de Seguros). Mexico’s federal Finance Secretariat now assumes that hazard impacts will amount to 1% of GDP a year, a figure that reduces the nation’s economic growth rate by about 0.1% a year.

The authors argue that, in addition to an improved early warning system, other changes are needed in order to reduce vulnerability. Specifically, the system should be modified to:

  • target the most vulnerable sectors of the population so that alerts reach them in ample time
  • incorporate periodic reviews, and allow for modifications to be implemented
  • be fully integrated into all levels of government (national, state and local) and the programs of all government agencies

In addition, they suggest that the reliance on the early warning system on the Saffir-Simpson scale, first developed in the 1970s, as a measure of likely damage, should be reconsidered, given that some recent storms (e.g. Stan in 2005, and Manuel in 2013) have led to far greater damage than would have been expected from their position on that scale. The researchers point out that the current model does not do well in predicting local variations in impacts.

As a result, they propose that identifying categories of risk is at least as important as categories of storm intensity. For example, they suggest that the risks associated with both the intensity and accumulation of precipitation should be taken into account, combined with soil conditions and the water levels of streams and reservoirs. Studies of the spatial distribution of impacts after storms could help identify risk factors and suggest ways to improve future warnings.

Even with an efficient early warning system, other actions are still needed. Buildings could be subject to more stringent construction regulations, especially in those coastal areas that are most at risk, while better programs of beach restoration, environmental planning and hazard event response are also needed.

There is no such thing as a perfect prediction and early warning system, but hopefully Mexico will lead the way in Latin America in reducing human fatalities from hazard events.

Related posts:

Case study of Hurricane Alex (30 June–1 July 2010)

Mexico has highest rate of death from lightning strikes in the Americas

 Other  Comments Off on Mexico has highest rate of death from lightning strikes in the Americas
Aug 062015
 

Last year, three Mexico City climate researchers published a comprehensive study of the 7300+ deaths due to lightning in Mexico during the period 1979 to 2011.

In “Deaths by Lightning in Mexico (1979–2011): Threat or Vulnerability?“, G. B. Raga, M. G. de la Parra and Beata Kucienska examined the distribution of fatalities due to lighting, looking for links to population density, vulnerability and other factors.

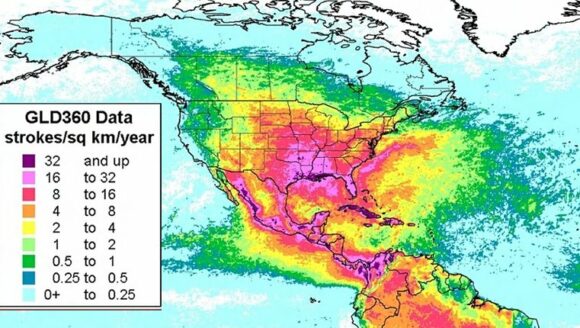
The number of deaths from lightning averaged 230 a year for the period studied. Given Mexico’s population, this means a rate of 2.72 fatalities from lightning for every million people. This is the highest rate in the Americas.

Fatalities were not distributed evenly. Seven of Mexico’s 32 states accounted for 60% of all lightning fatalities. Almost one-quarter of all deaths from lightning occurred in the State of México. Other states with high rates included Michoacán, Oaxaca and Guanajuato.

More than 45% of all deaths from lightning were young males under the age of 25 (with those aged 10 to 19 at particular risk). Overall, far fewer females died from lightning than males, though for females, too, the highest rates were for the under-25 age group.

Most deaths happened in the first half of the rainy season, between June and August, when thunderstorms are most likely.

Lightning incidence, North America, 2012-2014

Lightning incidence, North America, 2012-2014. Credit: Vaisala

What do all these numbers mean?

The incidence of lightning strikes in not equal across the country. For example, in the period 2012-2014 (see map) there were far more lightning events in in central and southern Mexico than in the northern part of the country and the Baja California Peninsula. This means that there is no clear connection between deaths by lightning and population density. However, neither is there a clear connection between deaths by lightning and the places where most lightning strikes occur.

The key factor is not just how likely a lightning strike is to occur in a particular place but also how vulnerable the local populace is. Some sectors of the population are much more vulnerable than others. Those working outdoors, for example, are at higher risk than those working indoors. This makes rural workers more vulnerable than urban workers. It also makes younger people more vulnerable than older people.

Education and awareness also play a part. Many countries have seen a dramatic fall in deaths from lightning as a direct result of launching campaigns to make people more aware and provide education about safety precautions. In the USA, fewer than 40 people now die each year from lightning, compared to about 400 in the 1930s, when the population was smaller.

For this reason, the study also concluded that the large number of deaths in Mexico is partly due to “the government’s failure to implement education and prevention strategies in communities living and working in vulnerable conditions”. Sadly, this means that there will probably be further tragic incidents similar to the one that took the lives of several members of the same family last month in the remote mountainous community of Mesa Cuata in Guanajuato.

Reference:

G. B. Raga, M. G. de la Parra, and Beata Kucienska, 2014: “Deaths by Lightning in Mexico (1979–2011): Threat or Vulnerability?”. Weather, Climate & Society, 6, 434–444.

Related posts:

Monitoring air pollution in Guadalajara

 Books and resources, Teaching ideas  Comments Off on Monitoring air pollution in Guadalajara
Jun 162014
 

Air pollution in the city of Guadalajara, the state capital of Jalisco, has worsened over the past decade, though there are some recent signs of improvement :

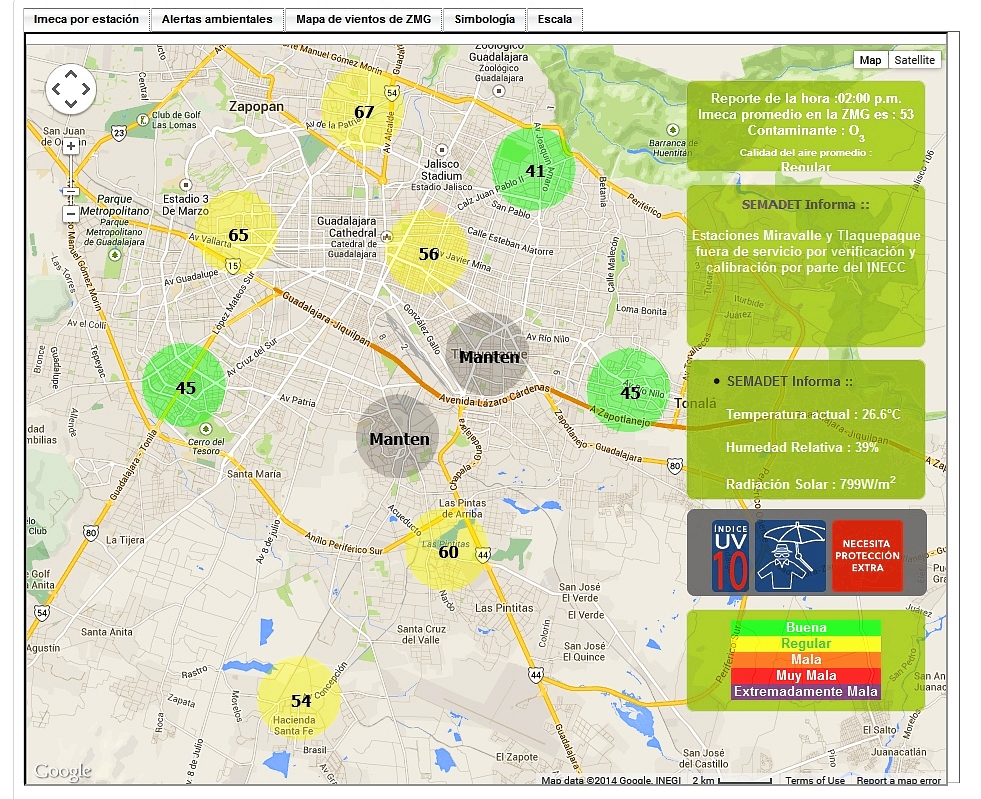
The Jalisco Environmental Agency now has a webpage where residents and travelers alike can now monitor Guadalajara’s air quality on an hourly basis. Readings for 10 stations are superimposed on a basemap on that page, together with links to graphs showing recent trends and other meteorological data. Tabs above the map also give a link to the current wind conditions across the city. Historical data (in Spanish) can also be accessed via the link to “Datos”.

Screenshot of Guadalajara air monitoring webpage

Screenshot of Guadalajara air monitoring webpage. Note: Two stations are shown as undergoing maintenance.

The map provides summary data in IMECAs, which stands for Índice Metropolitano de la Calidad del Aire (Metropolitan Index of Air Quality). IMECAs are a compound index combining measurements of concentrations of ozone (O3), sulphur dioxide (SO2), nitrogen dioxide (NO2), carbon monoxide (CO) and particles smaller than 10 micrometers (PM10).

In Guadalajara, formal smog alerts are issued if average readings rise above 150 IMECAs (“Very Bad”) for more than two consecutive hours. If readings rise above 200 IMECAs (“Extremely Bad”), then “serious alerts” impose restrictions on vehicle use and may lead to the suspension of school classes.

In Guadalajara, the worst air quality tends to be in the southern and eastern sections of the city. It also tends to occur in the months of April and May, immediately before the rainy season gets underway. The webpage system gives everyone an easy way to check these assertions!

In Guadalajara, mitigation efforts are centered mainly on reducing vehicle emissions (partly by stricter emissions testing and verification, and partly by improvements to the public transport network) since they are the main source of pollution. To date, there are no plans in Guadalajara to introduce a “Day without car” program similar to that in Mexico City:

Teaching idea

Use the Jalisco Environment Agency webpage to monitor Guadalajara’s air pollution and identify any patterns or trends related to air pollution in the city. Consider suggesting one or more hypotheses, such as “Air pollution gets worse in the afternoon”, or “The level of air pollution in eastern Guadalajara is worse than in western Guadalajara”, before testing your ideas using the online data.

Related posts:

The Teziutlán disaster of 5 October 1999, a case study of vulnerability

 Other  Comments Off on The Teziutlán disaster of 5 October 1999, a case study of vulnerability
Oct 042012
 

Today marks the 13th anniversary of a major disaster that struck Teziutlán (current population about 65,000), a small city in the Eastern Sierra Madre, in the northeast corner of the state of Puebla, close to the border with Veracruz. The city is noteworthy as the birthplace of two prominent twentieth-century politicians: Manuel Ávila Camacho (served as President, 1940–1946) and Vicente Lombardo Toledano, who founded the Confederación de Trabajadores de México (CTM), Mexico’s largest confederation of labor unions.

The town’s name means “place of the hailstones”. But in 1999, it was not hailstones but torrential rain that triggered the major disaster of 4/5 October, with parts of the city destroyed by a series of landslides and mudflows. More than 80 municipalities were affected to some degree by this tremendous storm. Hundreds of landslides occurred in Hidalgo, Veracruz and Puebla states, causing an estimated US$457 million worth of damage, and at least 260 deaths.

This post focuses only on the consequences for Teziutlán where several hundred homes were completely destroyed and almost a thousand homes suffered partial damage. More than 100 Teziutlán residents lost their life. The local infrastructure, roads, housing, schools and farming were all severely impacted.

The worst damage was in the La Aurrora district on the eastern side of the city, where a landslide on a 23-degree slope buried more than 130 people. In another district, La Gloria, in the western part of the city, several more slips, flows and slides damaged homes, but without any fatalities.

With the benefit of hindsight, this disaster offers a good case study of the factors which made the inhabitants of Teziutlán particularly vulnerable to such an event. The diagram suggests one general classification of the multitude of factors that can affect vulnerability. In the case of Teziutlán, the discussion that follows suggests that the physical factors were probably the most significant.

factors affecting vulnerability

Factors affecting vulnerability (Geo-Mexico, Figure 7.2) All rights reserved.

Physical factors

1. Relief and geology. The area ranges in elevation from 300-2,280 meters above sea level and is drained by the El Calvario, Xóloatl and Xoloco rivers. The city is located at the southern limit of the Eastern Sierra Madre (Sierra Madre Oriental), very close to where it is truncated by the geologically more recent Volcanic Axis. The local geology includes a series of loosely compacted, pumice-rich pyroclastic flows, most of which are thought to be associated with the Los Humeros caldera. These deposits are interlaced with palaeosoils rich in clay which are impermeable and restrict the infiltration of rainwater, and overlie older folded rocks. The combination of steep slopes and impermeable, unconsolidated layers increases the risk of landslides and other forms of mass movement.

2. Climate.  This mountainous region is one of the most humid and foggiest in Mexico, averaging 280 days of mist or fog each year. Teziutlán has an average precipitation of 1600 mm/yr, though totals of over 2000mm are not that uncommon. Most rain falls between July and October.On 4 October 1999, a moist tropical depression off the coast of Veracruz was prevented from moving by a cold front. This led to an increase in humidity followed  by torrential downpours (over 300 mm of rain) over Teziutlán and the surrounding area. The storm continued the next day when a further 360 mm of rain fell.  The rain that fell on just those two days was equivalent to about 40% of Teziutlán’s usual total for an entire year.

3. Earthquake A few days prior to the storm, on 30 September 1999, a 7.4-magnitude earthquake occurred off the coast of Puerto Escondido (Oaxaca). This earthquake did cause  minor cracks in some homes in Teziutlán, and it possibly played a (minor) contributory role in the severity of the storm’s impacts.

Environmental

Deforestation, as a consequence of unplanned urban growth, was also important. Natural and secondary woodlands were steadily being cleared for construction and agriculture. This had an adverse effect on infiltration rates and the capacity of the land to absorb rainwater. However, given the extreme magnitude of the rainfall event, it is unlikely that the area would have escaped unscathed, even if the natural forest had remained.

In the La Aurrora district, where a landslide/mudflow buried more than 130 people, the construction of  a cemetery on a hill above La Aurrora may have played a part, since it appears that a cemetery wall held rainwater back, allowing more of it to seep into the underlying slope, increasing its susceptibility to a serious slide.
La Aurrora, October 1999. Credit: Periódico Sierra Norte

La Aurrora, October 1999. Credit: Periódico Sierra Norte

Educational

The town had suffered severe mass movements during prior storms. For example, in 1955, the rains that accompanied Hurricane Janet provoked numerous mass movements resulting in the disruption of transport systems, including the main highway, but with no loss of life. However, in general, it is clear that these prior events did not increase Teziutlán’s preparedness for a similar event in the future. In particular, prior events did not lead to building regulations being enforced or prevent buildings from being erected in high-risk areas.

Social/Demographic

In the period following the last major event (in 1955), the population of Teziutlán had increased rapidly, leading to the equally rapid expansion of the urban area. This was uncontrolled and included construction on steep slopes with insufficient attention to stability or possible mass movement mitigation measures being taken. It is worth noting that the population has continued to increase rapidly since the disaster, too.

Economic

Home owners in Mexico do not generally carry insurance on their properties, and even when they do, it often specifically excludes major meteorological events. It is unlikely that any of the residents of Teziutlán were able to make insurance claims. Many of the those affected would not have had savings and would have been forced to rely on family, friends and emergency hand-outs to survive. As a 1999 BBC News article emphasizes, government help was slow to arrive.

Want to see more?

There are several Youtube videos with images of the disaster. Perhaps the most interesting is TEZIUTLAN 1999 – 10 años Después del desastre  because it includes some clips from an investigative 1995 TV program aired in 1995 (four years prior to the landslide) that highlighted the extreme risk of constructing unauthorized buildings on the steep slopes of the town along the main highway. This video includes many excellent photos [warning: some graphic images] of the landslide and its aftermath, with a commentary [in Spanish].

Other valuable Youtube resources include Teziutlan Desastre 1999 which has additional photos, plus some eyewitness memories of the event [in Spanish], and TEZIUTLAN historia y tragedia which has many photos of the disaster, accompanied by music only (no commentary) making it a good choice for English-speaking classes.

Sources:

Alcántara-Ayala, I.  Flowing Mountains in Mexico. Mountain Research and Development, Vol 24, No. 1, Feb. 2004: 10-13.

Flores Lorenzo, Pablo & Irasema Alcántara Ayala. Cartografía morfogenética e identificación de procesos de ladera en Teziutlán, Puebla. Boletín del Instituto de Geografía, UNAM. #49, 2002, pp. 7-26. [pdf file]
 

Severe hail storm hit central Mexico on 15 May 2011

 Mexico's geography in the Press  Comments Off on Severe hail storm hit central Mexico on 15 May 2011
Jul 072011
 

The severe hailstorm which struck parts of central Mexico on 15 May 2010 lasted up to 30 minutes in some places. It was a particularly intense storm, with golf ball-sized hailstones up to 5 cm in diameter.

The video below was uploaded to YouTube by . (The commentary is in Spanish).

The storm was caused by the southward movement of a strong cold front, which extended along the east coast of the USA and as far south as the Yucatán Peninsula. The cold front collided with hot air slowly circulating in an anticyclonic system that was stationary over central Mexico. The hot air was forced upwards, cooling to form heavy clouds, with moderate to heavy rainfall, and localized thunderstorms and hailstorms.

Despite the fact that Mexico’s National Meteorological Service had issued a weather forecast earlier that day correctly predicting the probability of severe hailstorms in much of central Mexico, damage from the hailstorms was considerable.

In the state of Puebla, 6,600 ha were affected, centered on the town of San Martín Texmelucan. This area included 500 ha of cornfields which were severely damaged. In addition, about 40,000 fruit trees—mainly apple and peach orchards—were badly hit; some of the 200 growers affected claimed that up to 70% of their trees had been damaged.

In Tlaxcala, more than 900 homes were damaged, as well as 1,500 vehicles and 400 ha of farmland. The worst-hit of the nine municipalities involved was Acuitlapilco, but costly damages were also reported from the municipalities of Totolac, Tlaxco, Panotla, Xaltocan, Hueyotlipan, Tecopilco, Atlangatepec and Muñoz de Domingo Arenas. Several emergency shelters were opened, though most of the people made homeless sought shelter with family or friends.

Climatic hazards, including hurricanes and hailstorms are analyzed in chapters 4 and 7 of Geo-Mexico: the geography and dynamics of modern Mexico. Buy your copy today, so you have a handy reference guide available whenever you need it.

The origins of the cabañuelas system of weather forecasting

 Other  Comments Off on The origins of the cabañuelas system of weather forecasting
Mar 072010
 

An earlier post described the weather forecasting system known as las cabañuelas.

In this post, we look at the possible origins of such an unusual and distinctive system.

Is the term cabañuelas derived from the Mayan language?

The historical origins of the word cabañuelas are unclear. Some sources claim that the system’s roots lie in the Old World, and go back well before the Spanish colonization of the New World. Writing in Mexico Desconocido, Homero Adame claims that the origins date back to the Zumac, or “Festival of Luck”, in the Babylonian calendar. The term cabañuelas may be connected to the Hebrew version, which was the “Festival of the Tabernacles”. Adame also points out that twelve days in the middle of winter were used in India to forecast the future weather conditions. He applies the lore of las cabañuelas to the weather experienced in the city of San Luis Potosí in 2001, finding that it does a fairly good (though not perfect) job of predicting the weather later in the year.

However, an alternative viewpoint is argued by Graciela Minaya, in an article originally published in 1945, in La Nación, a Mexico City daily. She views las cabañuelas as an example of the common heritage of the ancient indigenous peoples of Mexico, central America, and the larger Caribbean islands, that was passed down from one generation to the next. This would explain the variability in details from one country to another.

In her view, las cabañuelas were probably handed down from the Maya. The Maya calendar had 18 months, each of 20 days, followed by five additional “non-month” days. The Maya version of las cabañuelas used the first 18 days of the first month to predict the weather for the year (18 months). To complete the system, the 19th day of the first month predicted the weather for the summer solstice and the 20th the weather for the winter solstice.

The Maya version was known as Chac-chac. For those who are curious, the 18 months are: pop, uo, zip, zots, tzec, xul, yakin, mol, chen, yax, zac, ceh, mac, kankin, muan, pax, kayab, cumhú. The spare 5 days are known as uayeb. The days of each month went in the following order: ik, akbal, kan, chiechán, cimí, manik, lamat, muluc, oe, chuen, eb, bon, ix, men, cíb, cabán, eznab, cauac, ahua, imix. Minaya argued that the 16th day, cabán, gave rise to the word cabañuelas, presumably because it had some additional significance, perhaps in terms of some other calendric calculation, or time-marker.

The testimony of Román Pané, a monk of the order of St. Geronimo, who accompanied Columbus on his second voyage, lends credence to the idea that las cabañuelas originated in the New World. While in Haiti, Pané recorded the fact that “these Indians know by consulting their gods and observing the first days of the year which days will be good, which will be bad, which will be rainy and which dry.” (Loosely translated from what is the earliest purely ethnographic treatise on American Indians.) Pané, incidentally, is thought to have been the first person to take tobacco back to Spain.

How did the Maya come up with the system in the first place? They had already undertaken sophisticated astronomical observations and had developed advanced mathematical and calendric systems, even to the point of being able to predict the arrival of some comets. So, perhaps by long and patient observation of their weather patterns, they had also amassed evidence of cyclical weather phenomena.

Whatever their origin, las cabañuelas occur every January, giving everyone an opportunity to record the weather and see how well they work during the coming year. It is not at all unusual in early January, for example if the 8th of the month is cloudy and rainy, that someone will exclaim, “¡Ay! es que estamos en la cabañuela de agosto” (We are in the August cabañuela).

Should you hear this, you’ll know exactly what they are talking about! Both Chac, the Maya rain god, and Kukulcan, the Maya wind god, will be proud of you!

This is an edited version of an article originally published on MexConnect. Click here for the complete article

The climate of Mexico is discussed, with several maps,  in chapter 4 of Geo-Mexico: the geography and dynamics of modern Mexico. Climatic hazards, such as hurricanes, droughts and floods, are looked at in detail in chapters 4 and 7.

Mexico’s cultural geography and cultural landscapes are discussed in chapter 13.