The seven main canyons in the Copper Canyon region

 Other  Comments Off on The seven main canyons in the Copper Canyon region
Jul 302012
 

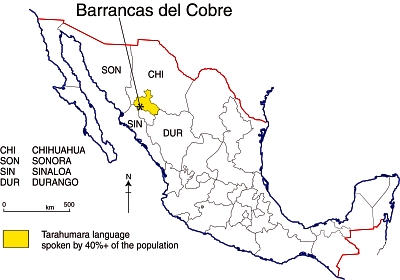
The Copper Canyon region in Mexico is the informal name for the area, in the south-west part of Chihuahua state, where several deep canyons bisect the Sierra Tarahumara. The 10,000 km2 area, part of the Western Sierra Madre, is home to about 50,000 Tarahumara Indians, one of the largest native Indian groups in North America. While generally referred to in English as the Tarahumara, the people’s own name for themselves is Raramuri“, literally “the light‑footed ones” or “footrunners”.

Location of Barrancas del Cobre (Copper Canyon region)

Location of Barrancas del Cobre (Copper Canyon region)

While the Tarahumara have so far succeeded in keeping many aspects of their distinctive culture relatively unadulterated, the pressures on them have increased considerably in recent years as improving highway links have made the region more accessible, not only to tourists, but also to developers looking to exploit the region’s forest and mineral resources.

Spanish-speakers usually refer to this region as the “Barrancas del Cobre” (Copper Canyons, plural). The table shows the seven main canyons, only one of which, strictly speaking, is the Copper Canyon. The precise number of canyons depends on whether they are defined by rivers or by local names since different stretches of canyon along a single river have sometimes been given different names.

Canyon Elevation at the rim (meters / feet a.s.l.) Elevation of stream in canyon floor (meters / feet) Depth (meters/feet)
Canyons south and east of railroad
Urique (south of Urique village) 2370 / 7775 500 / 1640 1870 / 6135
Sinforosa (Río Verde) 2530 / 8300 700 / 2300 1830 / 6000
Batopilas 2500 / 8200 700 / 2300 1800 / 5900
Urique (mid-point, aka Copper Canyon) 2300 /7545 1000 / 3280 1300 / 4265
Canyons north and west of railroad
Candameña (below Basaseachi Falls) 2540 / 8330 900 / 2950 1640 /5380
Chinipas 2000 / 6560 400 / 1310 1600 / 5250
Oteros 2220 / 7280 700 / 2300 1520 / 5980

The major canyon is the Urique Canyon. This is the one seen by most tourists because it is the closest to the railway line that traverses the region. Both the Urique River and the Batopilas River flow into the River Fuerte, which enters the Gulf of Mexico near Los Mochis.

Tarahumara place names

The Tarahumara have very few place-names. They do not usually have identifying names for specific mountains, streams, trails or landmarks , but do give names to every small settlement, even if it only consists of two or three homes.  These names serve to distinguish one family from another, but a single family may have several farms, each with a different name. The Tarahumara do have “a rather complete terminology for plants, animals, and birds.”  [Bennet & Zingg, 1935] The place-names for settlements are usually two-part names, consisting of a descriptive name plus a place suffix.

Examples include:

  • Aworítci, from aworíki, “cedar tree” (tci gives idea of a grove of trees).
  • Wisarótici, from wisaró, “poplar tree.”
  • Tcimétabo, from tcimáka, “leather money bag”, plus –tabo, place-ending.
  • Wagítali, from wagítci, “dead tree.”
  • Garitcí, from garíki, “house.”
  • Kusárare, from kusáka, “eagle.”

In future posts, we will delve further into the geography of the  Copper Canyon region and the lifestyle of the Tarahumara Indians.

Sources:

Bennett, W. and Zingg, R. (1935) The Tarahumara. Univ. of Chicago Press. Reprinted by Rio Grande Press, 1976. Classic anthropological work.

Gajdusek, D.C. (1953) “The Sierra Tarahumara” in Geographical Review, New York. 43: 15‑38

Schmidt, R.H. (1973) A Geographical Survey of Chihuahua, monograph #37 Texas Western Press.

Related posts:

The Guelaguetza, the major cultural festival of Oaxaca state

 Other  Comments Off on The Guelaguetza, the major cultural festival of Oaxaca state
Jul 282012
 

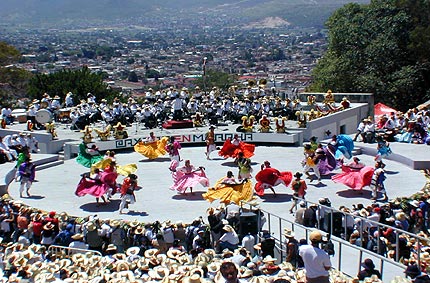
Oaxaca’s single biggest cultural event, held in the second half of July, has come to be known as the Guelaguetza, which is Zapotec for “offering” or “mutual help”. It celebrates the cultural and ethnic diversity of the state. This year’s edition (the 80th) of the Guelaguetza ends on Monday 30 July, so this is the final weekend.

A massive open-air amphitheater, seating 100,000 people, is a permanent fixture on the side of the Fortín hill which overlooks the north west quadrant of Oaxaca city. The original Aztec garrison (for the collection of tributes), known as Huaxyacac, was established by Ahuitzotl at the end of the fifteenth century on this very hill. Today, a massive statue of Benito Juárez (cast in Rome in 1891) stares out over the suburbs.

Guelaguetza

The Guelaguetza

The Guelaguetza may have its origins in Mixtec and Zapotec celebrations of their corn crop. Later, the festival was carried on by the Aztecs in honor of their corn god, Xilonen. Later still, in the eighteenth century, the Spanish Carmelite missionaries linked the festival to their own Christian rites for the Virgen del Carmen (16-24 July). The timing holds even more significance today since July 18 also marks the anniversary of the death of Juárez, a much-revered politician of humble, indigenous origin, who served five terms as president of Mexico in the nineteenth century.

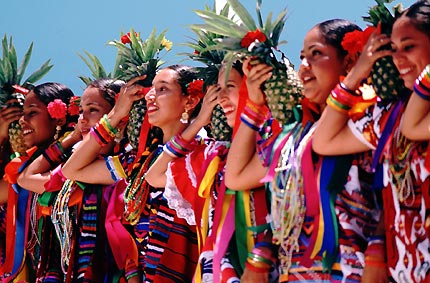
Guelaguetza

In the 1930s, the fiesta of the Guelaguetza took on its modern hybrid form, which includes a parade of stilt-walking “giants”. During the Guelaguetza, the Fortín hill is the scene for spectacularly colorful regional folkloric dances performed by several different ethnic groups (Mixtec, Zapotec, Trique, Popolac, Chootal, Chinantec, Mazatec, Mixe) from the seven main geographic regions of the state. The entire city comes alive with color. Color is everywhere from the beautifully hand-embroidered dresses and huipiles, to the food, to the paper streamers decorating the streets and to the mixture of merchandise sold on the sidewalks.

For travelers unable to visit in July, some central hotels, including the Camino Real, luxuriously housed in an architecturally-gorgeous former convent, and the Monte Alban opposite the cathedral, offer a weekly, scaled-down version of the Guelaguetza, year-round.

Want to read more?

Related posts:


Appropriate technology project supplies solar-powered stoves

 Other  Comments Off on Appropriate technology project supplies solar-powered stoves
Jul 262012
 

In a recent post, we mentioned a video on the Global Post website about transport developments in Mexico City. Global Post has published another short video in the same series, that is equally interesting and valuable as a teaching resource:

My first experience of a solar-powered stove was during an environmental education workshop in the state of Michoacán some 25 years ago. I was underwhelmed by its performance, but the more modern (and much more efficient) designs featured in this video definitely merit a much closer look.

The video focuses on the work of Gregor Schäpers, a self-taught solar engineer, and his company Trinysol, that makes solar-powered stoves and boilers. The company, located in the village of El Sauz in the state of Hidalgo, a short distance north-east of Mexico City, is a good example of the development of appropriate technology.

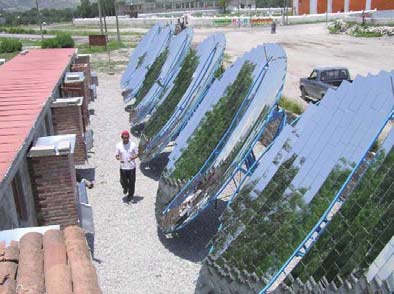
One of Trinysol’s first projects was working with a women’s cooperative in the village of  San Andrés, who produce a sweet  syrup from green agave plants. The process involves hours of cooking, and therefore requires a large input of energy. Prior to the installation of Scheffler reflectors and solar-powered hotplates, the women relied on gas.

Solar reflectors, San Andrés.

Schäpers has since set up hundreds of solar-powered boilers, and dozens of solar stoves in the region. Some are designed for individual families; others are suitable for small-scale industrial use, for example to provide energy for bakeries (panaderias) or tortilla-making plants (tortillerias).

According to the figures offered in the video, it costs about 4,000 dollars to build and install heating for a panadería, but can save the owners up to 5,000 dollars a year in energy costs. The investment is therefore fully recouped within a year. The system should last for 30 years, so a solar-powered system represents a significant improvement to the economics of many small businesses, giving them the opportunity to expand or allocate more of their scarce resources elsewhere.

Jul 232012
 

Grateful thanks to Annie Hansen for alerting us to the fact that 23 July was first proposed as “Día del Geógrafo de México” (“Mexican Geographers’ Day”) in a short paper published in 1999. Héctor Mendoza Vargas proposed that day because it marked the opening, in 1939, of the first National Congress of Geography ever held in Mexico. His suggestion was the winner in a competition to choose a suitable day on which to celebrate the work of geographers. Ever since then, 23 July has been a special day for all geographers in Mexico.

The first National Congress in 1939 ran from 23 July to 31 July, with sessions taking place in the Palace of Fine Arts (Palacio de Bellas Artes) in downtown Mexico City.

The full text of Mendoza Vargas’ short paper proposing 23 July as “Día del Geógrafo de México” can be seen here. It includes some interesting background history.

A Happy Geographers’ Day to all our readers!

Is Mexico experiencing a demographic dividend?

 Other  Comments Off on Is Mexico experiencing a demographic dividend?
Jul 232012
 

Mexico’s 2010 population of 112 million makes it the world’s 11th largest country in terms of population. The rate of population increase is now slowing down as fertility rates fall. The rate of increase, which was 2.63%/yr for the period 1970-1990, fell to 1.61%/yr for the period 1990-2010.

Even as the total population continues to grow over the next few decades, some very important changes are underway in Mexico’s population structure.

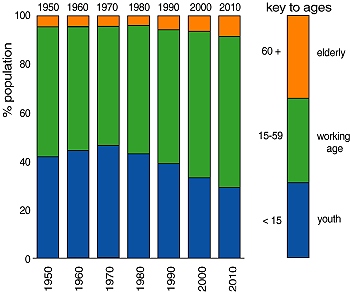
The graph divides Mexico’s population into three age categories: under 15 (youth), 15-59 (working age) and 60+ (elderly).

Mexico's population structure, 1970-2010

Mexico’s population structure, 1950-2010

The percentage of the total population of youthful age peaked in about 1970 at 46.2% and has since fallen to 29.3% in 2010. Over the same time period, the percentage of working age population has risen from 48.2% to 61.6%, while the percentage of elderly has gone from 5.6% to 9.1%.

Why is this important?

Perhaps the most obvious change is that government spending on schools and services for youth needs to shift towards spending on health care, pensions and services for the elderly. There are already some suburbs of the Mexico City Metropolitan Area that have experienced a dramatic shift in average age. Perhaps the most notable example is the Ciudad Satelite area, an area originally intended to be, and planned as, a genuine satellite settlement. A few decades later, the urban expansion of Mexico City had swallowed it up. An area which once had many young families now has very few children. The homeowners association of Ciudad Satelite estimates that 75% of the area’s 50,000 inhabitants is now elderly.

The major benefit of the changing population structure would appear to be that, in 2010, there are more wage-earners (and tax payers) for every person of non-working age (assumed for simplicity to be youth under 15, and the elderly aged 60+) than at any previous time. In other words, the total dependency rate is lower than ever before.

Economists argue that this “demographic dividend” should raise GDP, and could offer many significant advantages, such as enabling greater government expenditures on infrastructure or on social services. They point to several countries in East Asia as examples where economic growth spurts went hand-in-hand with a period of demographic dividend.

Despite the claims of economists, I’m not convinced that Mexico will prove to be an equally good example of the benefits of a demographic dividend. In Mexico’s case, the early phase of higher youthful population (and considerable economic growth) was accompanied by a high rate of emigration of working age Mexicans to the USA. Admittedly, emigration has now slowed, or stopped.

As Aaron Terrazas and his co-authors point out in Evolving Demographic and Human-Capital Trends in Mexico and Central America and Their Implications for Regional Migration [pdf file],

“But across Latin America, and in sharp contrast to East Asia, favorable demographic change has failed to translate into economic growth and prosperity. National income per capita has increased only modestly since the start of the demographic dividend, with Mexico outperforming its southern neighbors at comparable points in time. And emigration from the region has continued to grow despite the demographic transitions in Mexico and El Salvador, with the United States absorbing between one-fifth and one-quarter of the region’s annual population growth.”

Whether or not Mexico experiences a demographic dividend, it will not last for ever. In Mexico’s case, it looks set to last only about about 20 years. By 2050, according to current predictions, about 26.4% of the Mexico’s population will be youthful, and 27.7% elderly, while the percentage of working age will have fallen to 45.9%.

Related posts:


Mexican attitudes on the drug war, violence and crime

 Mexico's geography in the Press  Comments Off on Mexican attitudes on the drug war, violence and crime
Jul 162012
 

Mexican drug cartels and related violence have received enormous attention. For an overview, see Mexico’s drug cartels and their shifting areas of operation, a 2012 update. All Mexicans are aware of the issue and millions have been affected directly. What are their current views and attitudes? A face-to-face survey in April 2012 by the Pew Research Center of 1,200 Mexicans in Mexico sheds light on this issue.

Most Mexicans (80%) support President Calderon’s decision to use the military to fight drug traffickers. On the other hand, less than half (47%) think the campaign against drug traffickers is “making progress”. Fully 30% feel the government is losing ground. While they support use of the military, 74% indicate that human rights violations by the military and the police are a “very big problem”.

Mexicans are not sure which political party is better for dealing with Mexico’s drug problems. Just over a quarter (28%) think President Calderon’s National Action Party (PAN) (28%) would do a better job compared to 25% for the Institutional Revolutionary Party (PRI) and only 13% for the Party of the Democratic Revolution (PRD). Fully 23% said that none of the three major parties is capable of resolving the issue. A possible reason for this is that only 14% blame mostly Mexico for the problem, compared to 22% who mostly blame the USA and 61% who blame both countries.

In general, Mexicans want the USA to help solve the drug problem. Fully 75% favor the USA training Mexican police and military personnel and 61% also approve of the USA providing money and weapons to the country’s police and military. On the other hand only a third favor deploying USA troops within Mexico, while 59% oppose this.

Mexicans feel that their country is facing some serious problems. Three-quarters of Mexicans think cartel-related violence (75%) and human rights violations by police and military (74%) are “very big problems”. The related issues of crime (73%), corruption (69%) and illegal drugs (68%) were also identified as “very big problems” by most survey respondents. Apparently, Mexicans do not feel very safe. More than half (56%) said they were afraid to walk alone at night within a kilometer of their home, 61% for women and 51% for men. Unfortunately, Mexicans are not very optimistic that the country’s drug violence problems will go away any time soon. On the bright side, 51% of the surveyed Mexicans felt their economy would improve in the next year compared to only 16% who thought it would worsen.

Related posts:
Jul 122012
 

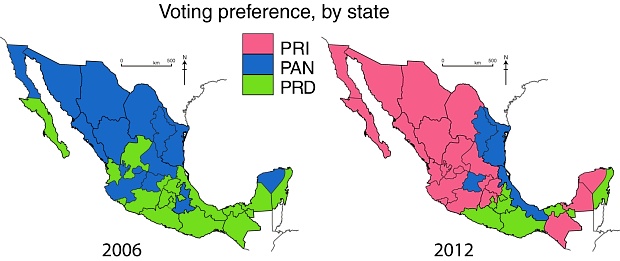
An earlier post discussed the north-south divide apparent in the 2006 presidential election. That year Felipe Calderón of PAN got the most votes in 14 of 17 northern states (blue on the map), while in 13 of 15 southern states Andrés López Obrador of PRD (green) got the most votes. Roberto Madrazo of PRI (pink) did not get the most votes in a single state.

Voting patterns in presidential elections, 2006 and 2012

Voting patterns in presidential elections, 2006 and 2012. All rights reserved.

The voting pattern changed considerably in the 2012 presidential election, but a north-south pattern still emerged. What was somewhat similar in both elections is that López Obrador of PRD retained much of his strength in southern Mexico. In both elections, PRD got most votes in seven southern states: Federal District, Morelos, Tlaxcala, Guerrero, Oaxaca, Tabasco and Quintana Roo. In 2012 PRD won in one other state, Puebla, which favored PAN in the 2006 election. Six southern states switched from PRD to PRI:  Michoacán, México, Hidalgo, Veracruz, Chiapas and Campeche. Puebla switched from PAN to PRD, while Yucatán went from PAN to PRI.

In the north, the pattern changed completely with the PRI replacing PAN as the highest presidential vote-getter. A total of 11 northern states switched from PAN to PRI: Baja California, Sonora, Chihuahua, Coahuila, Sinaloa, Durango, Aguascalientes, San Luis Potosí, Jalisco, Colima and Querétaro. In 10 of these states PAN came second while PRD took second place in Baja California. In 2012 PAN got most votes in only three states–Nuevo León, Tamaulipas and Guanajuato–compared to 16 in 2006.

PRD appears to have lost much of its relatively weak following in northern Mexico. The three northern states PRD won in 2006 all switched to PRI: Baja California Sur, Nayarit and Zacatecas. In 2012, PRD could only manage second place finishes in three states: Baja California, Nayarit and Zacatecas.

While the north-south pattern is still somewhat apparent, the main pattern of the 2012 presidential election is a strong victory for PRI candidate Enrique Pena Nieto. PRI was victorious in 22 of 32 states and came in second in the other ten.

However, PRI fell just short of controlling Mexico’s Congress so it will need support from some other parties to pass needed legislation and reforms. Together with minority coalition partner PVEM (Mexico’s Green Party), PRI won 240 of the 500 seats in the Chamber of Deputies and 62 of the 128 seats in the Senate. On the other hand, PRI has recently indicated support for many reforms similar to those previously proposed by PAN. This implies that needed reforms may have a decent chance of passing.

Further reading, with state by state analysis:

Related posts:

Have Mexicans given up on the dream of moving to the USA?

 Updates to Geo-Mexico  Comments Off on Have Mexicans given up on the dream of moving to the USA?
Jul 092012
 

A recent post noted that net migration from Mexico to the USA has dropped to essentially zero. Does this mean that Mexicans no longer have any interest in moving to the USA? The answer to this question is complicated. Obviously, many Mexicans living in Mexico would like to join their family members in the USA if it were legally possible. Others might feel that their career ambitions or the aspirations of their children might be better served by living in the USA. On the other hand, many Mexicans in the USA might feel that their lives would be better if they lived in Mexico.

A face-to-face survey in April 2012 by the Pew Research Center of 1,200 Mexicans in Mexico sheds light on this issue. According to the survey, 56% had a favorable view of the USA, compared to 52% in 2011. Only 34% had an unfavorable view of the USA, down from 41% in 2011. The views varied significantly by age and education. Sixty percent of 18 to 29-year-olds had a positive view compared to only half of those over age 50. Fully 66% of those with a post-secondary education had a favorable view compared to less than half (48%) of those with less education.

Over half (53%) think that Mexicans who move to the USA have a better life, up sharply from 44% in 2011. This suggests that there is still considerable interest in migration. Only 14% indicated they had a worse life, down from 22% a year earlier. However, 61% said they would not move to the USA if they had the means and opportunity. On the other hand, 37% said they would move to the USA and of these 19% indicated they would move even without legal documentation. Not surprisingly, younger Mexicans and those with more education were more interested in moving to the USA.

The survey data indicate that when/if US unemployment declines and there are again ample job opportunities in the USA, many Mexicans may migrate legally or illegally to fill those jobs. Of course, employment opportunities in Mexico will be a very important factor affecting decisions about migration. While the Mexican economy has recovered from the severe recession far better than the USA, still 62% of surveyed Mexicans described the economy as “bad”, down from 75% in 2010 and 68% in 2011. But Mexicans remain optimistic, 51% say the economy will improve in the next year compared to 32% who think it will remain the same, and only 16% who believe it will be worse. The Mexicans more willing to migrate, those with higher educations and incomes, are more optimistic about Mexico’s economic future. If the gap between US and Mexican economic opportunities continues to shrink in the decades ahead, we can expect Mexicans to become less interested in moving to the USA.

Related posts:

Mexico’s position among the world’s largest economies: 1900 to 2008

 Other  Comments Off on Mexico’s position among the world’s largest economies: 1900 to 2008
Jul 072012
 

Comparing the historical sizes of national economies is extremely challenging. Fortunately, Gapminder has attempted to do this by compiling GDP data for all countries in the world for the period since 1800. (For details, see here and here.) Gapminder’s approach relies on first obtaining for each country historical population size and Gross Domestic Product per capita (GDPpc) and then multiplying these to obtain the GDP. Gapminder relies on quantitative and qualitative data from hundreds of official and unofficial documents and a number of carefully documented assumptions.

Mexico’s total GDP has grown almost 60-fold since 1900 in inflation-adjusted constant 2005 dollars based on Purchasing Power Parity, which measures total goods and services produced by an economy independent of exchange rates. Growth started rather slowly, but accelerated very rapidly at mid-century. From 1940 to 1980, Mexico’s economy almost doubled each decade, moving up from $49 billion in 1940 to $637 billion in 1980, averaging about 6.6% per year. Of course, Mexico’s population was also growing rapidly during those four decades. Growth slowed to 2.0% per year in the 1980s but jumped up to 3.4% in the 1990s. From 2000 to 2008, growth slowed to 2.1% per year, partially as a result of the severe recession in the USA. Mexico’s economy is expected to grow significantly faster in this decade.

Growth of major world economies, 1900 to 2008 (Gapminder data)

(GDP in billions of constant 2005 US dollars based on Purchasing Power Parity)

Country19001930195019802008Growth/yr, 1900-2008
Brazil10381069371,8584.9%
Canada23731485771,2113.8%
China3214972169178,8623.1%
France1672672971,0951,8752.3%
Germany2554064161,7342,7012.2%
Indianana2085732,951na
Indonesia2655562288373.3%
Italy721492109151,6142.9%
Japan771652222,1603,9853.7%
MEXICO2336946371,3343.8%
Russianana375na2,089na
South Korea712161651,1774.9%
UK2403514901,0252,0042.0%
USA5061,1562,4146,33912,9603.1%

In 1900, Mexico’s total GDP of $23.3 billion was just ahead of Canada and over twice that of Brazil. However it was behind Indonesia and less than 5% of the USA’s world leading GDP. The Mexican economy was less than one tenth that of Germany and the UK, a seventh that of France and less than a third that of Japan and Italy. The table shows GDP levels for some of the world’s largest economies from 1900 to 2008.

The Mexican GDP expanded by 1.5% per year from 1900 to 1930 despite stagnation during the Mexican Revolution of 1910 to 1920. While this growth rate was better than UK, and tied with China, it was slower than the other countries in the table which expanded rapidly at the start of the 20thcentury. Brazil spurted ahead at 4.4% per year, edging past Mexico as Latin America’s largest economy. Canada expanded by 3.9% per year and doubled Mexico’s GDP. The USA grew by 2.8% per year becoming the first trillion dollar economy by 1923. France and Germany grew at about 1.6% per year, while Japan, Indonesia and Italy expanded by about 2.5% to 2.6%.

From 1930 to 1950, Mexico grew rapidly to $94 billion at a very impressive 4.9% per year, faster than all the other countries except Brazil at 5.3% per year. The USA (up 3.8% per year) and Canada (up 3.6%) also expanded rapidly, while the UK, Italy and Japan grew much slower, in the 1.5% to 1.7% range. The other countries struggled at rates around 0.5% or less. China’s GDP declined by a mind-boggling 4.1% per year during the 20 years from $497 billion down to $216 billion, more than a third less than what it had been in 1820! China’s economy seriously contracted over a 130 year period. The Great Depression hurt most economies; however World War II allies Japan (up 5.8% per year) and Germany (up 3.9%) grew relatively rapidly during the 1930s.

The 1940s and World War II had very dramatic impacts on the major economies. During the decade, Mexico’s GDP led the field with very impressive growth at 6.7% per year, closely followed by Brazil at 6.2%, USA at 5.2% and Canada at 5.0%. Wartime production was a major stimulus to these economies. On the negative side, several countries experienced dramatic war-related loses. China was at war throughout the decade and its economy declined by an incredible 7.0% per year during the 1940s, Germany was down by 3.5%, Japan by 2.6%, South Korea by 2.7% and Indonesia by 2.5%. Compounding these annual changes demonstrates their real significance. Mexico’s GDP almost doubled from $49 billion in 1940 to $94 billion in 1950, while China’s GDP dropped more than half from $447 billion in 1940 to $216 billion in 1950. By 1950, Mexico’s GDP was nearly half that of China and Japan, 1.7 times that of Indonesia and over six times that of South Korea. These four Asian countries would grow very rapidly during the “Asian Miracle” of the second half of the 20th century.

Mexico continued its dramatic growth expanding by 6.6% per year from 1950 to 1980. This was the “Mexican Miracle” which actually started in the 1940s. By 1980, Mexico’s GDP reached $637 billion, surpassing Canada and India; it was above one tenth of the USA’s GDP for the first time in over 100 years. All other economies also grew very rapidly during this thirty year boom period. Japan led the way with 7.9% per year, followed by Brazil at 7.5% per year. China finally broke from its 130 year slump growing at 4.9% per year; in 1956 it finally regained the GDP level it had in 1820. In 1980 Mexico’s GDP was about 70% that of China compared to only 7% in 1930 and 2% in 1820.

From 1980 to 2008, Mexico’s growth slowed a bit but still managed a very respectable increase of 2.7% per year which doubled its GDP from $637 billion to $1.334 trillion. This growth rate was better than that of Japan and all other large western economies (tied with Canada). But it significantly lagged behind four large Asian economies: China (up 8.4% per year), India (up 6.0%), South Korea (up 7.3%) and Indonesia (up 4.8%). China’s GDP increased almost ten-fold from 1980 to 2008. In 1980 India’s GDP was less than that of Mexico, but by 2008 it was over twice as large. Mexico’s GDP in 2008 of $1.3 trillion puts it in 11thplace, behind Italy and just ahead of Spain, Canada and South Korea.

Reviewing the entire 108-year period from 1900 to 2008 reveals the dramatically changes that can occur. Some Asian countries, especially China, really struggled for decades early in the century and then expanded extremely rapidly in recent decades. Compared to the other countries, Mexico did extremely well increasing at an average of 3.8% per year from $23 billion in 1900 to $1.3 trillion in 2008, a 57-fold increase. Brazil and Korea did considerably better, averaging 4.9% per year for 180-fold increases. Even the slowest growth country, the UK, grew by a respectable 2.0% per year for over an eight-fold increase since 1900. All major economies did well making the 20thcentury clearly the best century by far in terms of economic growth. The total GDP of 12 countries (Brazil, Canada, China, France, Germany, Indonesia, Italy, Japan, Mexico, South Korea, UK and USA)in the table with available data grew by 2.0% per year from 1900 to 1950 compared to a very impressive 3.8% per year from 1950 to 2008. The second half of the century was much better than the first; this indicates that economic growth is accelerating and accelerating fast. Will this continue in the decades ahead?


Jul 052012
 

By virtue of its geography, the Gulf coast state of Veracruz is one of the best places in the world to see the annual migration of birds of prey (raptors) from North America to Central and South America.

Between 4 and 6 million birds (eagles, hawks, vultures, falcons, and kites) make this trip each way each year to trade the harsh winter and scarce food in one hemisphere for better conditions in the other hemisphere. The migration south takes place September-November, and the return migration passes overhead in March-April.

Since most raptors are relatively large birds, and they are accompanied by other species such as storks, white pelicans and anhingas, this annual migration is one of the most awesome birding spectacles anywhere in the world. Each passing flock contains tens of thousands, in some cases hundreds of thousands, of individuals.

The raptors fly during daylight and rest overnight. Their New World songbird cousins, who also migrate in vast numbers, prefer to feed and rest during the day and then fly at night. Most songbirds take a direct migration route from the eastern USA to Central and South America, flying directly over the Gulf of Mexico in a “single, epic 18-hour flight”. Raptors, on the other hand, prefer a more leisurely approach, leap-frogging along the coastal plain.

Why do they fly through Veracruz?

The main reasons are:

1. Relief: Mexico’s mountain ranges, especially the Sierra Madre Oriental {Eastern Sierra Madre) and Volcanic Axis, funnel the birds towards the east coast, but the Gulf of Mexico provides a natural barrier preventing the birds from attempting routes further to the east. At its narrowest, this funnel is only 25 km (15 miles) wide.

2. Climate: The wide coastal plain warms up sufficiently to provide ascending thermal “bubbles” which help keep these large birds aloft and minimize  the energy expenditure required to soar and fly large distances. Raptors use the thermals to soar to about 1000 meters (3000 feet) above the ground, before gliding in their desired direction of travel gradually losing height until they pick up another thermal at a height of about 300 meters (1000 feet), repeating the process as often as needed. On a good day, they will cover more than 320 km (200 miles) in this fashion before resting for the night.

3. Biogeography: The varied landscape, vegetation and animal life in habitats ranging from tropical wetlands to temperature forests, offers plenty of potential food sources for the raptors.

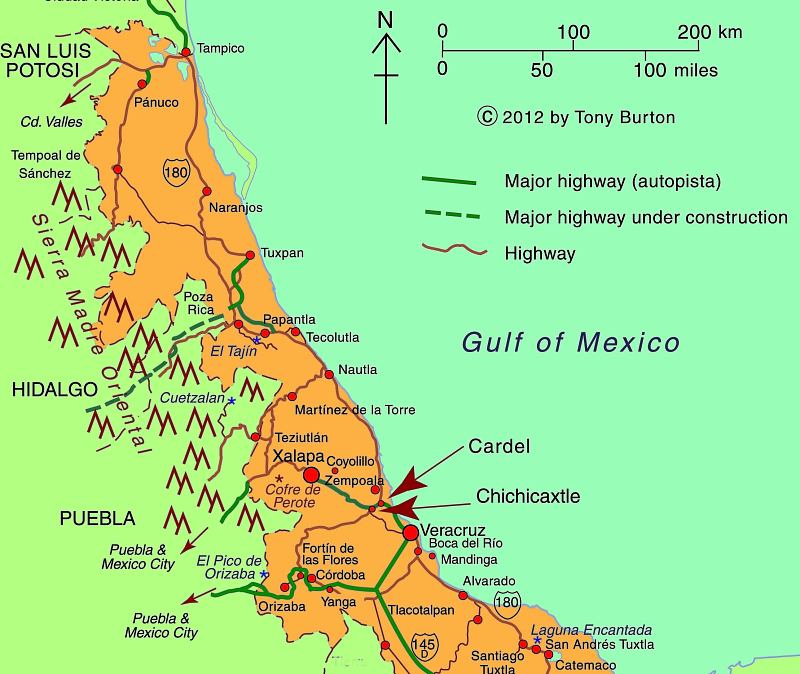
This massive migration has been studied since the early 1990s and scientists continue to tag birds today in order to update their estimates of bird populations and of the precise timing and routes involved. An official counts is held each year from 20 August to 20 November, organized by Pronatura Veracruz. The count is held in two locations: Cardel and Chichicaxtle (see map).

The counts have confirmed that Veracruz hosts the most concentrated raptor migration in the world.

One of the major long-term threats to this migration is habitat change in central Veracruz. Pronatura Veracruz sponsors an environmental education program known as “Rivers of Raptors” which tries to address this issue, helping local landowners appreciate the need for watershed protection and for an end to deforestation.

Pronatura’s work with raptors and the local communities is partially funded by ecotourism, and hawk-watching has become an important component of Mexico’s fledgling “ornithological tourism” market. Other key sites in Mexico for birding tourism include the tropical forests of the Yucatán Peninsula and Chiapas, and the San Blas wetlands in the western state of Nayarit.

Map of Central Veracruz

Map of Central Veracruz; all rights reserved. Click map to enlarge

In fact, Mexico is one of the world’s most important countries for birds, home to 1054 species of birds, 98 of them endemic, including 55 globally threatened species. Mexico has no fewer than 145 recognized “Important Bird Areas” (IBAs) of global significance, which between them cover 12% of the national land area (see summary map below).

Important Bird Areas in Mexico [Birdlife.org]

Important Bird Areas in Mexico [Birdlife.org]

Want to read more about the raptors?

Related posts:


Is Mexico the world’s 13th or 14th largest country?

 Other  Comments Off on Is Mexico the world’s 13th or 14th largest country?
Jul 022012
 

One would think that with satellite imagery there would be no question concerning the land area of countries. However, when talking about area there are some definitional issues. Are we talking about “land area” or “total area” which includes land area and inland water bodies such as lakes, reservoirs and rivers? This can be important when talking about the relative size of countries.

Without question Russia is the largest with nearly twice the area of the second place country. What are the second, third and fourth place countries? If we are talking about “land area”, excluding inland waters, then China is second (9.570 million square kilometers), the USA is third (9.162m sq km) and Canada is fourth (9.094m sq km). However, when inland waters are included to get “total area” then Canada is second (9.985m sq km), China is third (9.597m sq km) and the USA is fourth (9.526m sq km). Generally “total area” is the measure used to compare the geographic areas of countries (see table).

Total area of the world’s largest countries (millions of square kilometers)

RankCountryArea (millions of sq. km)RankCountryArea (millions of sq. km)
1Russia17.09811Congo2.345
2Canada9.98512Saudi Arabia2.150
3China9.59713Mexico1.964
4USA9.52614Indonesia1.911
5Brazil8.51515Sudan (post 2011)1.861
6Australia7.69216Libya1.759
7India3.16617Iran1.648
8Argentina2.78018Mongolia1.564
9Kazakhstan2.72519Peru1.285
10Algeria2.381

Generally we might expect a country’s geographic area rank to stay the same from year to year and even decade to decade. However, this is not the case. Prior to 1991 Mexico was considered the world’s 13th largest country. However with the dissolution of the Soviet Union in 2011, Kazakhstan became an independent country ranked 9th in total area. This pushed Mexico down to 14th.

When South Sudan split away from Sudan in mid 2011, the area of “new” Sudan was reduced by over 25%. This dropped Sudan from 10th to 15th on the list of the world’s largest countries. It also moved Mexico from 14th back up to 13th place on the list. Such political changes can have enormous impact on the size of countries. For example, prior to 1951 when Tibet was considered an independent country, the size of China was an eighth smaller than it is now. Mexico before 1846 was almost twice its current size and perhaps the fifth largest independent country behind only Russia, China, the USA and Brazil.

Another issue concerns whether Greenland (2.166m sq km)  is counted as a country. While Greenland is officially a dependency of Denmark it has been moving toward independence. In 1985 it left the European Economic Community (EEC) while Denmark remained in the EEC. Greenland has its own Parliament and Prime Minister; in June 2009 Greenland assumed self-determination with Greenlandic as its sole official language. If/when Greenland becomes officially an independent “country” it will be the world’s 12th largest, bumping Mexico back into 14th place. Until this happens, Mexico remains the world’s 13th largest country.

The changes in rank discussed above came about for political reasons. They did not involve any physical changes. With global warming and rising sea levels some countries will actually become geographically smaller. However these changes will not affect the area ranking of the 20 largest countries for at least the next hundred years.

Related posts: