The diffusion of the chikungunya virus across Mexico

 Other  Comments Off on The diffusion of the chikungunya virus across Mexico
Nov 162015
 

It is now just over a year since the first locally locally transmitted cases of chikungunya were reported in Mexico. (Local transmission means that mosquitoes in Mexico have been infected with chikungunya and are spreading it to people).

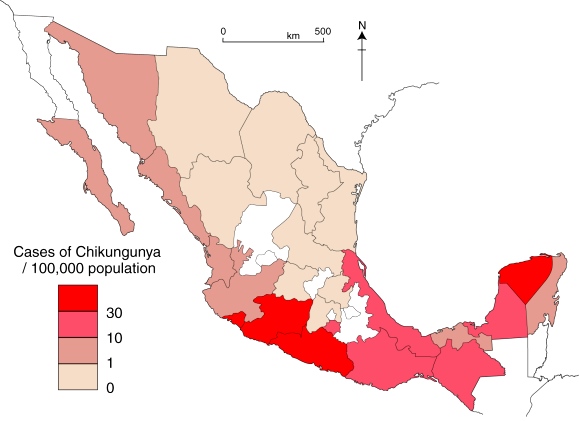
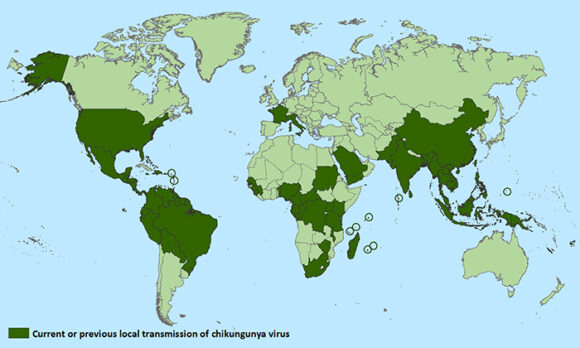
Distribution of Chicungunya, as of October 2015

Distribution of Chikungunya, as of October 2015 (WHO)

The virus, first isolated in Tanzania in 1952, began to spread rapidly after an outbreak that originated in Kenya in 2004. By 2006, the virus had reached India, and by 2007 northern Italy. Imported cases were identified in Taiwan, France and the USA in 2010. In these stages, chikungunya was spread to new areas primarily by travelers infected with the virus.

The first locally-transmitted cases in the Americas were on the Caribbean island of St. Martin in 2013.

The chikungunya virus was first recorded in Mexico in October 2014 and has since spread rapidly from Chiapas through much of the country (map).

Incidence of Chikungunya, 2015, up to 24 October

Incidence of Chikungunya, 2015, up to 24 October. Data: SINAVE/DGE. Cartography: Geo-Mexico

As of 24 October 2015, 9423 cases have been reported in Mexico in total. The states most affected (in terms of number of cases) are Guerrero (1620 cases since October 2014), Michoacán (1548), Veracruz (1203), Oaxaca (1151) and Yucatán (1131).

Two mosquito vectors (Aedes aegypti and Aedes albopictus) are involved in the spread of chikungunya. Aedes aegypti is exclusively tropical in distribution, but Aedes albopictus also thrives in temperate climes, giving chikungunya the potential to spread virtually throughout the Americas.

The number of cases spikes with the rainy season since mosquitoes breed in stagnant water. Curiously, about two-thirds of the cases in Mexico have been in females, and only one-third in males. Presumably, this is due to differences in work and/or living habits, with females having greater exposure than males to the mosquitoes involved.

There is no vaccine to prevent chikungunya or medicine to treat the viral infection.

The most common symptoms of chikungunya virus infection are fever and joint pain. Other symptoms may include headache, muscle pain, joint swelling, or rash. Joint pains can last months or even years. The disease is debilitating, but rarely fatal. Someone who has contracted chikungunya develops lifelong immunity (unlike dengue fever, where no such immunity exists).

Want to learn more?

Related posts

Good news: tax on sugary drinks in Mexico is decreasing consumption

 Mexico's geography in the Press  Comments Off on Good news: tax on sugary drinks in Mexico is decreasing consumption
Jun 252015
 

On 1 January 2014, the Mexican government implemented a 10% tax on refrescos (aka sodas, pop, carbonated drinks) and other sugar sweetened drinks, raising the price by 1 peso (about 7 cents US) per liter, in an attempt to help curb the nation’s obesity problem. The tax became law despite heavy lobbying against it by the beverage industry. An 8% tax was also added to unhealthy snacks like potato chips and cookies.

Now preliminary results of a study (not yet peer reviewed) by the Mexican National Institute of Public Health and the Carolina Population Center at the University of North Carolina, show purchases of sugary beverages dropped 6% on average across 2014, and by as much as 12% in the last part of the year. The study analyzed consumption in 53 Mexican cities, and adjusted for other factors like the small downward trend in consumption of carbonated drinks in recent years. The effect was greatest in lower income households where purchases were cut by 9% over the year and by 17% in the later months. Moreover, the researchers claim that Mexicans drank more water after the refresco tax came into effect.

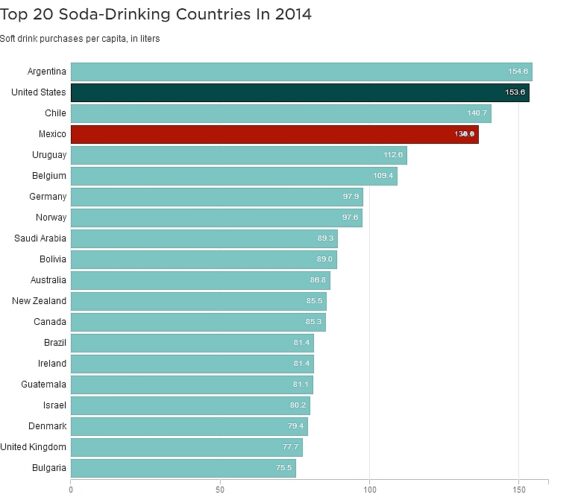
soft-drinks-2014Mexicans’ consumption of carbonated drinks per capita is the fourth highest in the world (behind Argentina, USA and Chile), with the average Mexican drinking the equivalent of 136 liters of Coca-Cola a year. Government revenues from the new tax totaled 18 billion pesos (US$1.3 billion) in 2014. The National Health Alliance, a Mexican public interest coalition, is now calling for the tax to increase to 20%, and for the abolition of tax on bottled water sold in containers of under 10 liters, to make it cheaper than sugary drinks. The Alliance is also pressuring the government to follow through on its promise to use the tax revenues raised to fund programs to prevent obesity and its associated diseases – for example, making free, clean drinking water available in schools that don’t currently have it.

In its March 2015 report on Carbonates in Mexico, Euromonitor International, reporting from an industry perspective, concludes:

(The tax) is one of the many new strategies that the Mexican government is implementing to fight the rising obesity and diabetes II rates after becoming the leading country for obese or overweight citizens globally in 2013…The most affected carbonated products are those sold in big sizes where consumers are more aware of the increased cost. Some leading brands have their stronger position among the biggest sizes of the market, and these brands have seen a greater impact in their volume sales. Amongst carbonates, Coca-Cola (de México SA de CV) holds a 68% total volume share, followed by its closest competitor Pepsi-Cola (Mexicana SA de CV), at 16% .

Carbonates is expected to keep on struggling with volume growth in Mexico due to consumers wanting healthier options, the increasing trend of having RTD teas and increasing trend of fruit-flavoured beverages instead of carbonates. Additionally, government actions have strongly impacted carbonates’ consumption.”

Related posts:

An update on the Human Development Index in Mexico

 Updates to Geo-Mexico  Comments Off on An update on the Human Development Index in Mexico
Mar 192015
 

The latest United National Development Program (UNDP) report about the Human Development Index (HDI) in Mexico gives scores and ranks for each state. The full report, in Spanish, entitled “Índice de Desarrollo Humano para las entidades federativas, México 2015: Avance continuo, diferencias persistentes“, is readily available online, and is based on data up to and including 2012.

The HDI is a compound index based on several aspects of three major criteria: health, education and income.

HDI improved between 2008 and 2012 in all states except Baja California Sur. The greatest percentage increases in HDI were in Puebla (where HDI rose 3.7%), Chiapas (3.6%) and Campeche (3.6%). HDI in Baja California Sur fell 0.8%, mainly due to a lower score for education.

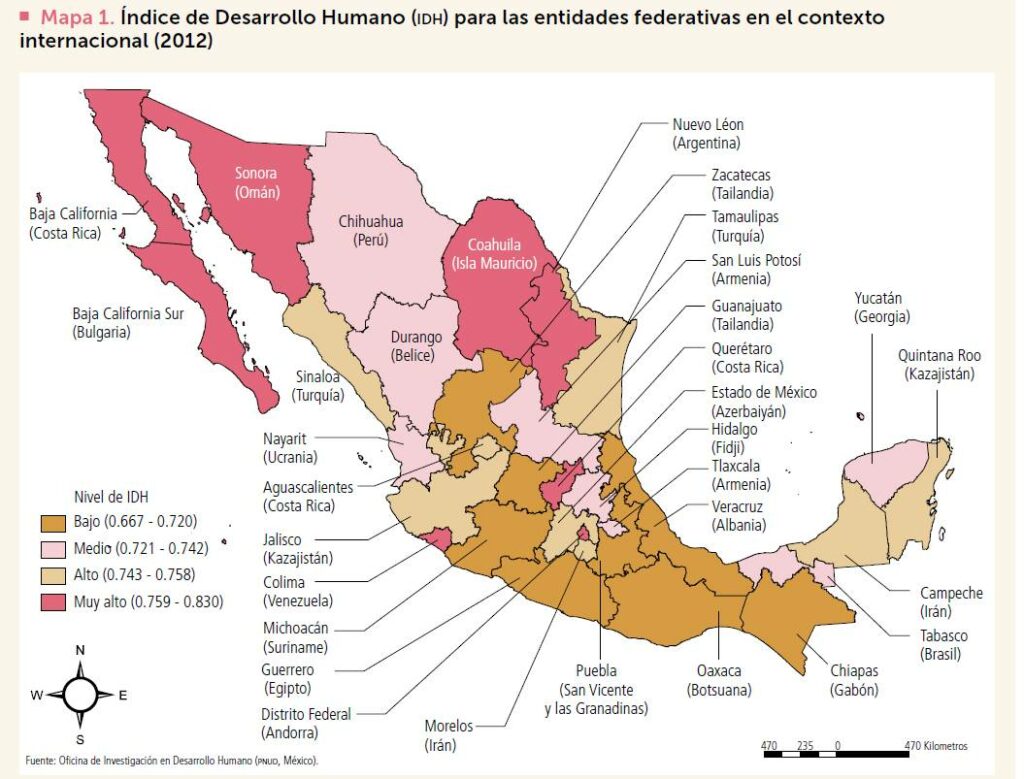
HDI in Mexico, with comparison countries for each state

HDI in Mexico, with comparison countries for each state. Click map to enlarge.

The pattern of HDI in Mexico, by state, is shown on the map. The highest HDI values in 2012 were for the Federal District with a score of 0.830, Nuevo León (0.790) and Sonora (0.779). At the other end of the spectrum, Chiapas had the lowest HDI (0.667), below Guerrero (0.679) and Oaxaca (0.681).

As noted previously on Geo-Mexico, the north-south divide in Mexico persists. In general, northern states, together with the Yucatán Peninsula states (Campeche, Yucatán and Quintana Roo) all have HDI values considered “medium” or higher, while southern Mexico (plus some other states, including Zacatecas, Guanajuato, Michoacán and Veracruz) all have “low” values.

The map includes international comparisons. For example, Oaxaca, one of most deprived states in Mexico, had a level of HDI in 2012 comparable to that of Botswana in Africa, even though that nation’s HDI is actually 38 positions below that of Mexico in the world rankings.

The report highlights the extent of disparities by calculating the number of years it will take each state, at the rates of change experienced from 2008 to 2012 to reach the HDI level of Mexico City. Interestingly, while it will apparently take Chihuahua 200 years to reach the HDI level of Mexico City, it will take Chiapas only 20 years to reach the same point.

The main conclusion that can be drawn is that the overall quality of life continues to improve in Mexico though not at equal rates throughout  the country. Disparities persist and current patterns of public spending have failed to make significant inroads into diminishing these disparities. The UN report considers it a priority to close the development gaps in Mexico, especially in the two southern states of Chiapas and Oaxaca.

Related posts:

The geography of dengue fever in Mexico

 Updates to Geo-Mexico  Comments Off on The geography of dengue fever in Mexico
Dec 112014
 

Preventing, diagnosing and treating dengue fever is a major public health issue in many parts of the world, including central America and Mexico. The disease is transmitted by mosquitoes. Infected patients develop a sudden high fever, usually accompanied by generalized body pain and a skin rash. The pain can be very severe, hence the disease’s common name of breakbone fever.

Several species of mosquito can transmit dengue, but female Aedes aegypti mosquitoes are the main transmitter of dengue in Mexico. These mosquitoes bite during the day, mostly in the period two hours either side of dawn and dusk. The mosquito bites an infected person and ingests blood with the dengue virus, which incubates in the mosquito for a period of 8 to 12 days. After that the mosquito can begin to transmit the virus by biting other people. From 5-7 days later any newly infected person is likely to have symptoms.

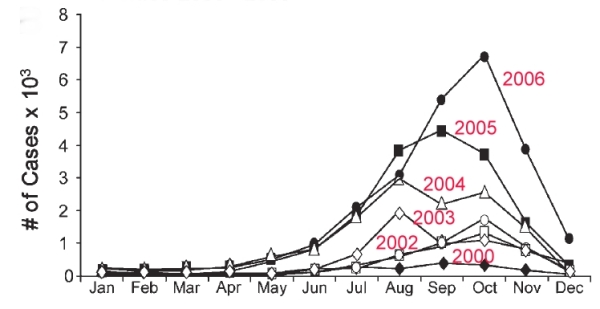
The graph below shows the monthly number of dengue cases in Mexico from 2000 to 2006. It is clear that most cases are reported between July and November, with very few cases occurring between December and May. This can be explained by Mexico’s climate. Almost of all of Mexico receives most of its rainfall between June and October. The mosquitoes that spread dengue need stagnant water to breed. There are far more small pools of water available for mosquito breeding in and immediately after the annual rainy season. Eliminating potential locations where water can collect and stagnate is an important element of dengue prevention programs.

Monthly incidence of dengue cases in Mexico, 2000-2006

Monthly incidence of dengue cases in Mexico, 2000-2006. Source: San Martín, Brathwaite et al (2014).

The graph also shows that the number of cases of dengue was increasing rapidly between 2000 and 2006. Indeed, numbers continued to rise until 2013 when more than 50,000 cases were reported for the year (an average of more than 4000/month). At first sight, this suggests that dengue prevention programs have not been very successful, but in fact the rise echoes what was happening worldwide. One possible, at least partial, explanation may be that changes in climate have allowed dengue mosquitoes to thrive in environments where they were previously scarce. People in such areas are unprepared for dengue; they may not have instituted prevention programs, and may have been slow to receive correct diagnosis. The migration of people affected by dengue from one region to another may also have helped the disease spread, provided there were host mosquitoes in the destination region.

The good news is that the number of dengue cases in Mexico in 2014 has fallen from its 2013 level by about 50%, so the dengue epidemic may finally be on the wane. As of 24 November 2014, 28,109 cases had been reported for the year, an average nationwide rate of 23.47 cases/100,000 people. Dengue is fatal in a relatively small number of cases, with 33 deaths reported in Mexico so far this year..

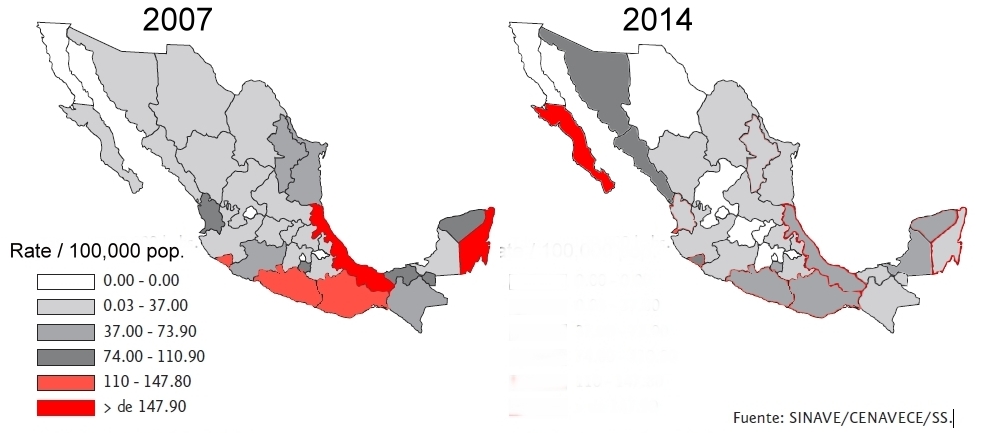
The total number of cases may finally be on the decline, but the figures for 2014, when looked at state by state, suggest that the spatial pattern of dengue cases in Mexico is changing. The two maps below compare the rate of cases per 100,000 people on a state-by-state basis for 2007 and 2014. (The color-coded key is identical for both maps).

Rates of dengue by state, 2007 and 2014

Rates of dengue by state, 2007 and 2014. Rates are cases / 100,000 population

In 2007, the highest rates of dengue were found in the states of Veracruz and Quintana Roo, with Oaxaca, Guerrero and Colima comprising the next category. (Those five states are the ones colored red on the 2007 map). At the other extreme, no cases were recorded in 2007 in the state of Baja California, or in several tiny states including Aguascalientes.

The pattern shown on the 2014 map is quite different. In general, rates of dengue at the state level have not increased in Mexico, but decreased. However, there is a clear shift in emphasis towards the north-west, where several states had much higher rates in 2014 than in 2007. The extreme example is Baja California Sur, where the rate for 2014 (up to 24 November) was a whopping 549.9 cases / 100,000 people, more than five times the rate registered in any other state. Equally apparent is the belt of low-rate states (from Chihuahua to the State of México) down the center of the country from the U.S. border to Mexico City. These states are at relatively high elevation where fewer mosquitoes are found.

The states of Baja California Sur, Veracruz, Sinaloa, Sonora and Guerrero account for 55% of the 28,109 confirmed cases of dengue fever reported in Mexico as of 24 November 2014.

Mexico’s Health Secretariat publishes maps of each state showing which municipalities have reported cases of dengue. These maps are updated weekly. The link is to a pdf document with maps for 2014 up to 24 November.

There is some good news. In 2015, Mexico will be the first nation in the world to get a new dengue vaccine, developed by French company Sanofi Pasteur. The company hopes to have manufactured more than 40 million doses by the first half of 2015, and has decided to introduce it first in Mexico, with the first vaccinations likely to be offered to the public late next year or early in 2016. In trials, the vaccine proved 60.8% efficient in preventing the disease.

Reference for graph:

José Luis San Martín, J.L., Brathwaite, O., Zambrano B, et al (2014): “The Epidemiology of Dengue in the Americas Over the Last Three Decades: A Worrisome Reality”; Am. J. Trop. Med. Hyg., 82(1), 2010, pp. 128–135

Related posts

Medical tourism and the medical equipment industry in Mexico

 Other  Comments Off on Medical tourism and the medical equipment industry in Mexico
Jun 212014
 

Mexico is both a growing market for medical tourism and a world leader for the manufacture of medical equipment.

Growing market for medical tourism

The global market for medical tourism in 2013 was estimated to be worth about $2.847 billion, with some 7 million patients seeking medical treatment outside their home country each year. According to Patients without Borders, a U.S. business that specializes in the field, Mexico is currently the second most popular destination for medical tourists, after Thailand. Nationwide, Mexico has more than 71,000 doctors working in hospitals and private clinics. Almost two-thirds of all doctors in Mexico are specialists, compared to an average of 57.7% for all OECD member nations.

Mexico’s Economy Secretariat estimates that, combined, the one million medical tourists in 2013 and the numerous affiliated services such as spas, massages and non-conventional therapies, contributed $4.2 billion to the national economy. This figure is growing at about 7% a year.

Patients without Borders claims that patients from the USA and Canada pay between 36 and 80% less for operations and medical treatments in Mexico than the cost in their home country. The most important states for medical tourism are Nuevo León, Baja California, Baja California Sur, Sonora, Tamaulipas, Chihuahua, Jalisco, Quintana Roo and Yucatán.

A plan to build a new “medical city” has been announced by health officials in Quintana Roo. It would be called “Jardines de la Sabiduría” (Gardens of Wisdom) and located on a 550-hectare lot between Cancún and Puerto Morelos. The new city would have four zones: residential, hospitals, recreation and cultural/educational, and would include at least four hospitals: for children, cancer care, dental work and orthopedic surgeries respectively. It remains to be seen if sufficient foreign investment can be found to bring this project to fruition.

World leader for medical equipment

Mexico is a major manufacturer of medical devices. Sales of Mexican-made medical equipment exceed $10.6 billion a year and are predicted to reach $14.9 billion by 2020. Manufacturing costs for medical devices in Mexico average 25% below those in the USA, the world’s largest market for such products.

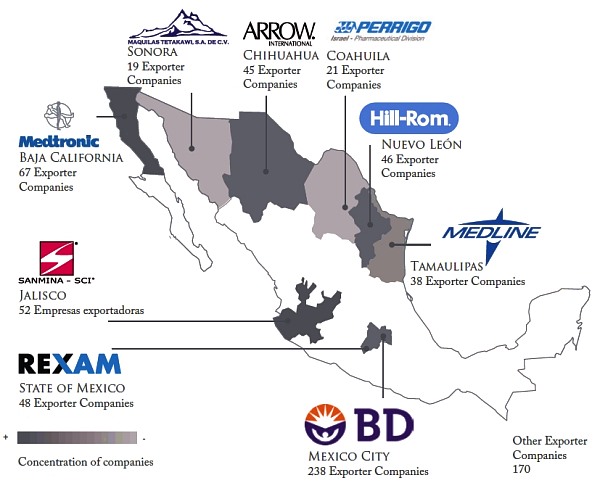
Major medical device manufacturing areas in Mexico

Major medical device manufacturing areas in Mexico. Credit: Economy Secretariat.

Mexico’s exports of medical equipment and supplies were worth $6.2 billion in 2011, making Mexico by far the largest exporter of medical devices in Latin America, and the 11th largest in the world. 92 % of medical devices manufactured in Mexico are exported to the USA, accounting for two-thirds of all U.S. imports of those products.

According to Pro-Mexico, Mexico is the world’s largest exporter of bore needles; the 4th largest exporter of medical, surgical, dental and veterinary furniture; the 5th largest exporter worldwide of medical,surgical, dental and veterinary instruments and apparatus; and the 7th largest exporter worldwide of ozone therapy, oxygen therapy, aerosol therapy apparatus, breathing apparatus and other respiratory therapy apparatus.

More than 2,000 separate businesses, and about 135,000 workers help invent, design and manufacture medical devices in Mexico. Medical device manufacturing is concentrated mainly in northern border states, especially Baja California, where the cluster of more than 60 specialist firms includes Smiths, Tyco Healthcare, Cardinal Health, Medtronic, Gambro, ICU Medical, CLP, Sunrise Medical and North Safety Products.

Data:

  • The Medical Device Industry, 2012 (Pro-Mexico; pdf file)

Related posts:

Dec 122013
 

Today is 12 December, the feast day of Our Lady of Guadalupe, the beloved indigenous patron saint of Mexico and much of the Americas. This seems like a good excuse, if ever one was needed, to revisit the “Gender Gap” in Mexico. The gender gap assesses the “gap” between females and males for a number of variables, but should not be taken as reflecting the quality of life of females in different countries.  For example, the gender gap between women in Japan and Japanese men is very large, even though Japanese women enjoy a relatively high quality of life.

In “The Global Gender Gap Report 2013″, the World Economic Forum (WEF), based in Geneva, Switzerland, placed Mexico 68th of the 136 nations included in the study. Between them, the 136 nations house 93% of the world population. Mexico has risen 16 places in the rankings since 2012, meaning that the gender gap in Mexico is narrowing, even if there is still a long way to go to reach gender equality. (It is worth noting that Mexico has been climbing steadily up the rankings for several years, from #98 in 2009, to #91 in 201, #89 in 2011 and #84 in 2012).

Of the 136 countries studied for the 2013 report, Iceland had the smallest gender gap, for the 5th year running, followed by Finland, Norway and Sweden.

Among Latin American nations, Nicaragua had the smallest gender gap (placing 10th in the world), with Cuba, which has the highest female participation in government, coming in 15th and Brazil remaining 62nd. Other notable placings were Germany 14th, and South Africa 17th.

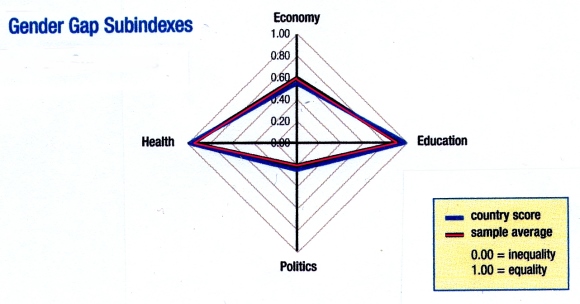
gender gap graph for Mexico

How Mexico (country score) compares to other countries (sample average). Source: Gender Gap Report 2013

The Gender Gap Index is a composite index comprised of a number of variables grouped into four key areas:

  • health and survival
  • educational attainment
  • political empowerment
  • economic participation

As noted in our summary of the 2012 Gender Gap Report, Mexico ranks #1 in the world, tying with several other countries, for the health and survival subindex. This means that Mexican females are unsurpassed with respect to sex ratio at birth (female/male) combined with female life expectancy (female/male).

For the other subindexes, in 2013 Mexico ranked #36 for political empowerment and #70 for educational attainment, but a lowly #111 for economic participation.

Geo-Mexico agrees wholeheartedly with Klaus Schwab, founder and executive chairman of the World Economic Forum, who called for renewed efforts to ensure gender equality, saying that, “Countries will need to start thinking of human capital very differently – including how they integrate women into leadership roles. This shift in mindset and practice is not a goal for the future, it is an imperative today.”

Related posts:

Mexico the fourth most obese country in the world

 Mexico's geography in the Press  Comments Off on Mexico the fourth most obese country in the world
Jun 062013
 

Earlier this week, the headline “Ocupa México primer lugar mundial en obesidad; supera a EU” (Mexico in first place for obesity; more obese than the USA)  grabbed my attention. The headline appeared in the Mexican magazine Proceso, normally a stickler for getting its facts straight.

Last time we checked (October 2012)–Obesity in Mexico compared to other countries: bigger is not better–Mexico was in fourth place in the obesity league table, behind Saudi Arabia, Egypt and the USA. [Note that our ranking excludes several very small countries with higher rates of obesity, such as Nauru (71.1%), Cook Islands (64.1%), Marshall Islands (46.5%), Kiribati (45.8%) and St.Kitts-Nevis (40.9%).]

The Proceso article was based on the latest United Nations Food and Agriculture Organization (FAO) report entitled “The State of Food and Agriculture: Food Systems for a Better Nutrition

On reading the report, it turned out that Proceso had made an unaccustomed error. Mexico is not the most obese country in the world, but remains in fourth place, behind Saudi Arabia, Egypt and South Africa. Mexico has overtaken the USA but has itself been overtaken by South Africa. Normally, any time Mexico beats the USA, whatever the sport or event, it calls for a good old-fashioned celebration with some shots of tequila, but on this occasion, it raises some serious concerns about Mexico’s nutrition and health care strategies.

Obesity in adults is defined by the World Health Organization (WHO) as a Body Mass Index (BMI) greater than or equal to 30, where BMI is defined as a person’s weight in kilograms divided by the square of his height in meters (kg/m2). Mexico’s rate (for adults), as quoted in the FAO report, had risen to 32.8% of the adult population, almost one in three. By way of comparison, the equivalent figures were 35.2% for Saudi Arabia and 34.6% for Egypt, while the USA rate fell slightly to 31.8%.

The FAO estimates that 12.5% of the world’s population (868 million people) are undernourished in terms of energy intake, yet these figures represent only a fraction of the global burden of malnutrition (over- and under-nutrition). An estimated 26% of the world’s children (under 5 years of age) are stunted, 2 billion people suffer from one or more micronutrient deficiencies and 1.4 billion people are overweight, of whom 500 million are obese.

Most countries are burdened by multiple types of malnutrition, which may coexist within the same country, household or individual.

The social cost of malnutrition, measured by the “disability-adjusted life years” (DALY) lost to child and maternal malnutrition and to overweight and obesity, is very high. Beyond the social cost, the cost to the global economy caused by malnutrition, as a result of lost productivity and direct health care costs, could account for as much as 5% of global gross domestic product (GDP), equivalent to US$3.5 trillion per year or US$500 per person.

The FAO stresses that, “The way we grow, raise, process, transport and distribute food influences what we eat,” and adds that improved food systems can make food more affordable, diverse and nutritious.

The report makes a number of recommendations, including using appropriate agricultural policies, investment and research to increase productivity; cutting food losses and waste, which currently amount to one third of the food produced for human consumption every year; and helping consumers make good dietary choices for better nutrition through education, information and other actions.

Among other recommendations is to make food systems more responsive to the needs of mothers and young children. FAO notes that malnutrition during the critical ‘first 1,000 days’ from conception can cause lasting damage to women’s health and life-long physical and cognitive impairment in children.

The agency cites several projects that have proved successful in raising nutrition levels such as the promotion of home gardens in West Africa; encouragement of mixed vegetable and animal farming systems together with income-generating activities in some Asian countries; and public-private partnerships to enrich products like yoghurt or cooking oil with nutrients.

Other figures for Mexico from the report:

  • 29.4% of children under five have anemia
  • 26.8% of children under five suffer from vitamin A deficiency
  •  8.5% of children under five have an iodine deficiency

Note: This post includes some paragraphs from the related FAO press release. Click here for the full text of the report (pdf file).

Related posts:

How does Mexico score on the Social Progress Index?

 Books and resources  Comments Off on How does Mexico score on the Social Progress Index?
May 302013
 

The Social Progress Index measures the extent to which countries provide for the social and environmental needs of their citizens. It is a compound index, based on  52 indicators in the areas of Basic Human Needs, Foundations of Wellbeing, and Opportunity that show relative performance in order to elevate the quality of discussion on national priorities and to guide social investment decisions.

Social progress is the capacity of a society to meet the basic human needs of its citizens, establish the building blocks that allow citizens and communities to enhance and sustain the quality of their lives, and create the conditions for all individuals to reach their full potential.

The model used to develop the index is based on asking three key questions that help define social progress:

  1. Does a country provide for its people’s most essential needs? (Basic Human Needs)
  2. Are the building blocks in place for individuals and communities to enhance and sustain wellbeing? (Foundations of Wellbeing)
  3. Is there opportunity for all individuals to reach their full potential? (Opportunity)

In this inaugural Social Progress Index, each of these dimensions is disaggregated into four components, each measured by between two and six specific indicators. Each indicator has been tested for internal validity and geographic availability:

Criteria used to compile Social Progress Index

Criteria used to compile Social Progress Index. Click image to enlarge.

For example the Personal Rights component of Opportunity is comprised of 5 separate variables:

  • Political Rights (Freedom House)
  • Freedom of Speech (CIRI Human Rights Data Project)
  • Freedom of Assembly/Association(CIRI Human Rights Data Project)
  • Private Property Rights (Heritage Foundation)
  • Women`s Property Rights (Economist Intelligence Unit)

How does Mexico score on the Social Progress Index?

Of issues covered by the Basic Human Needs Dimension, Mexico does best in areas including Nutrition and Basic Medical Care and has the greatest opportunity to improve human wellbeing by focusing more on Personal Safety. Of issues covered by the Foundations of Wellbeing Dimension, Mexico excels at providing building blocks for people’s lives such as Health and Wellness but would benefit from greater investment in Access to Information and Communications. Of issues covered by the Opportunity Dimension, Mexico outperforms in providing opportunities for people to improve their position in society and scores highly in Personal Rights yet falls short in Access to Higher Education.

This is how Mexico’s performance stacks up in comparison to the other 49 countries in the survey:

  • Social Progress Index: score 49.7 = rank 25th
  • Basic Human Needs: 49.3 (29th)
  • Foundations of Wellbeing: 50.8 (23rd)
  • Opportunity: 49.1 (25th)

This post is based on a press release from the Social Progress Imperative. For more information about the methodology behind the Social Progress Index, please refer to the inaugural report.

Related posts:
Oct 062012
 

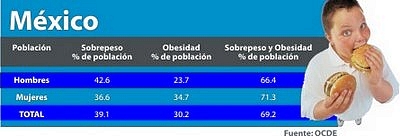
Considerable attention has been focused on Mexico’s obesity problem (see “Soft drinks, obesity, diabetes and public health in Mexico”). Obesity in adults is defined by the World Health Organization (WHO) as a Body Mass Index (BMI) greater than or equal to 30, where BMI is defined as a person’s weight in kilograms divided by the square of his height in meters (kg/m2).

Mexico’s very high adult obesity rate of 30% is increasing every year. It is related to many factors, including increased consumption of processed fat and sugary foods. The average daily calories consumed by Mexican adults increased from 3102 in 1988 to 3266 in 2007.

Rates of "overweight" and "obese" adults in Mexico

Rates of “overweight” and “obese” adults in Mexico

Addressing Mexico’s serious obesity problem will require significant effort and dramatic behavioral change, first and foremost by families, but also by schools, government, industry and civic organizations. Most agree that long term solutions for limiting or reducing obesity should focus primary on children and youth. Obviously physical exercise and diet are crucial parts of a solution. Fortunately Mexico is already making efforts to address its child obesity problem (see “Mexico takes on childhood obesity”).

Obesity is quite complicated and may involve numerous heretofore unknown factors. The data are sometimes confusing. For example, Italian adults, with an obesity rate of only 10%, consumed on average a whooping 3646 calories per day in 2007, 380 more than Mexicans, whose obesity rate is three times that of Italy. (The data in this and the next paragraph come from Table 1 of the Milken Institute’s “Waistlines of the World”, August 2012). French adults consume far more calories than Mexican adults, and more fat the US adults, but their obesity rate is much lower, at only 11%. Furthermore, the French consume 50% more alcohol than Americans and almost three times more than Mexicans and yet they are much thinner. Though adults in Norway consume more calories than Mexicans (3169 versus 3102) their obesity rate is only a third that of Mexico (10% versus 30%). Obviously calorie intake is not the only factor and may not be the most important factor.

Mexican Manuel Uribe, one of the world's most obese individuals, enjoys a snack

Mexican Manuel Uribe (1965-2014), one of the world’s most obese individuals, succeeded in lowering his weight from 560 kg (1233 lbs) to 394 kg (867 lbs).

Obesity is also related to amount of physical activity, but here again the data are confusing. New Zealand adults have a high obesity rate of 27% though they live in one of the physically most active countries, with 49% engaging in “moderate physical activity” defined as light-to moderate activity for at least 30 minutes five times per week. On the other hand, only 27% of the relatively thin Italian adults engage in “moderate physical activity”. Why are obesity rates for the more active New Zealanders so much higher than those for the less active Italians, especially since the latter consume 544 more calories per day (3646 versus 3129)? By way of comparison, only 21% of Mexican and 23% of US adults engage in “moderate physical activity”.

How does Mexico’s growing obesity problem compare that of other countries? Data compiled by the World Health Organization (used by Procon.org to compile “US and Global Obesity Levels: The Fat Chart)”) and the OECD in “Waistlines of the World provide a basis for comparing obesity rates in numerous countries (though see note [1] for reservations about using data from different years).

Country % obese Year of data
Saudi Arabia 35.6 2000
USA 33.8 2008
Egypt 30.3 2006
MEXICO 30.0 2006
Australia 26.4 2007
Canada 24.2 2008
U.K. 23.0 2009
Chile 21.9 2003
South Africa 21.6 1998
Germany 14.7 2009
Colombia 13.7 2007
France 11.2 2008
Brazil 11.1 2003
Italy 10.3 2009
China 5.7 2008
Japan 3.9 2009
South Korea 3.8 2009
Eritrea 3.3 2004
Indonesia 2.4 2001
India 1.9 2008

The data indicate that Mexico ranks 12th of 88 countries with an adult obesity rate of 30%, defined as body mass index (BMI) of over 30. While 12th of 88 does not sound so bad, the top six on the list are small island countries with obesity rates from 41% to 79% (Nauru, American Samoa, Tokelau, Tonga, Kiribati and French Polynesia). Also higher than Mexico are the relatively small countries of Panama and the United Arab Emirates. If these small countries are excluded then Mexico ranks 4th among major countries behind only Saudi Arabia, the USA and Egypt (see table).

Mexico trails several notable countries with high obesity rates between 20% and 30% such as Australia, Canada, UK, Chile and South Africa. (Given that obesity rates are increasing almost everywhere and South Africa’s data are from 1998, its current obesity rate is probably closer to 25% or more.)

The global data suggest that the obesity problem is most serious in Pacific Island nations, North America and the Middle East (including North Africa). It is also becoming a problem in several European and Latin American countries. It is less of a problem in Asia and Sub-Sahara Africa.

In conclusion, obesity is a very serious problem for Mexico today, and arguably one of the biggest problems facing humanity in the 21st century along with climate change and poverty.

Note [1]:

There are some significant differences between the WHO and OECD data sets. For example the WHO data for Mexico are from 2000 while the OECD data are from 2006. For our comparisons we use the most recent data available from the two data sets. Though obesity is an extremely important international problem, reliable data is not collected frequently in many countries. Obesity rates are based on measured height and weight, and are invariably higher than rates based on self reported height and weight. In our table, measured values are used for: the USA, Mexico, Australia, Canada, UK, Japan and South Korea; we are not sure about the rates for other countries.

Update

For an updated post on this topic, with more data, please see: Mexico the 4th most obese country in the world

May 102012
 

Linked to Mother’s Day [10 May in Mexico], Save the Children just published their 13th annual report on the“State of the World’s Mothers”.

The report investigates childhood malnutrition and relates it to the well-being of mothers. The focus is on the first 1,000 days from the time of conception to the child’s second birthday. Proper nutrition and health care during these 1,000 days are critically important to brain development and the welfare of the child throughout its lifetime.

Mother and child in a Mexican market

Mother and child in a Mexican market. Photo: Tony Burton.

For decades, development experts have recognized that health, education and economic opportunity of mothers are crucially important to the quality of life of their children. Mothers’ level of education is often the most important factor.

The impacts last for numerous generations. Not only do the children of more educated mothers do better, but their grandchildren and great grandchildren also do better. On the other hand, malnourishment during the first 1,000 days is linked to low education and economic opportunity for the child. It can result in daughters getting pregnant earlier and having less healthy children. This vicious circle can continue for generations.

How does Mexico stack up with other major countries around the world? The results for Mexico are a bit mixed. From 1990 to 2010 Mexico recorded an impressive decrease in malnutrition of 3.1% per year. (The measure of malnutrition used in this comparison was children too short for their age, “stunting”). Mexico has cut malnutrition almost in half (47%) since 1990. This decrease ranks it 11th among the 165 countries analyzed. Much of this progress is associated with Mexico’s Oportunidades Program. The ten countries that did better than Mexico include China (6.3%), Brazil (5.5%), and Vietnam (4.3%). Fifteen countries suffered increases in malnutrition during the 20 year period, including Somalia (6.3%/year), Afghanistan (1.6%/year) and Yemen (1.0%/year).

On the other hand, the study points out that, given its level of Gross Domestic Product (GDP) per capita, Mexico’s level of malnutrition is higher than it should be. Other under-performers include the USA, Singapore, India, Indonesia, Guatemala, Peru, South Africa and Venezuela. These countries tend to have very inequitable distributions of income. Surprisingly, Brazil, with one of the worst levels of income inequality, was among the group of countries with lower malnutrition than expected given their GDP per capita. Other over-performers include Chile, Ukraine, China and Vietnam. Obviously, in all countries malnutrition is much worse among the poor.

The study divides the 165 countries into the three Tiers used by the United Nations. The Tiers are labeled I-“more developed”, II – “less developed” and III – “least developed”. Tier I is limited to Japan and European countries. Mexico is one of 80 countries in Tier II (“less developed” countries).

The UN has a “Women’s Health Index” for Tier II, comprised of lifetime risk of maternal death, percent of women using modern contraception, percent of births attended skilled attendant, and female life expectancy at birth. Within this group, Mexico ranks 19th in “Mother’s (Health) Index” compared to Cuba (ranked 1st), Argentina (4th), Brazil (12th), China (14th), South Africa (33rd), Turkey (47th), Iran (50th), Philippines (52nd), Indonesia (59th), Saudi Arabia (63rd), Egypt (65th), Guatemala (68th), India (76th), Pakistan 78th) and Nigeria (80th).

The differences between ranks appear to overstate the real differences. For example, the scores on the individual variables for Mexico (19th) and Argentina (4th) are relatively close. The chance of maternal birth-related death is one in 500 for Mexico versus 600 in Argentina. In Mexico 95% of births are attended by a trained worker compared to 98% in Argentina. Two thirds (67%) of Mexican women use modern contraception methods compared to 64% in Argentina. Life expectancy for women is 80 years in both countries.

The UN “Children’s Health Index” for Tier II is comprised of under age five mortality rate, percent of children under 5 moderately or severely underweight for age, gross primary enrollment ratio, gross secondary enrollment ratio and percent of population with access to safe drinking water.

Mexico ranks 18th among Tier II countries in terms of “Children’s (Health) Index” compared to Cyprus (1st), South Korea (2nd), Brazil (7th), Argentina (8th), Turkey (10th), Egypt (21st), Iran (26th), China (34th), South Africa (56th), Guatemala (63rd), Philippines (64th), Indonesia (70th), Pakistan (76th), India (77th) and Nigeria (82th). Here again, the differences between ranks appear to overstate the real differences.

While Mexico has made impressive progress concerning mother’s and baby’s health, it still lags behind Argentina and Brazil not to mention virtually all European countries. The biggest concern is rural areas of Mexico, especially southern Mexico, which seriously trail urban Mexico in terms women’s and child’s health. For example, infant mortality rates are highest in Chiapas, Oaxaca and Guerrero, followed by Veracruz, Hidalgo and Puebla. On the bright side, rural areas are making great progress thanks to programs like Oportunidades.

Happy Mother’s Day!
 

Mexico takes on childhood obesity

 Mexico's geography in the Press  Comments Off on Mexico takes on childhood obesity
Mar 202011
 

As we noted in a previous post – Soft drinks, obesity, ,diabetes and public health in Mexico – Mexico has one of the highest obesity rates in the world, and public health officials are increasingly alarmed by the rapid rise in child and youth obesity. About one-third of children in Mexico are now classified as either overweight or obese.

A recent news article – Mexico puts its children on a diet – describes initial reactions to a new federal initiative which attempts to improve the diets of schoolchildren. School lunches are almost unheard of in Mexico, but almost all students have access to food during recess or on the way home, whether  organized by local parents, or from local stores or school vending machines.

The federal regulations to restrict the kinds of food available in schools met stiff opposition from some soft drinks and snack food manufacturers, who see youthful consumers as a guaranteed path to future success. Most fried foods have now been removed from schools, but the plethora of regulations still contains many anomalies.

The battle of student waistlines may have begun, but the war on childhood obesity is very far from over.

Maternal health in southern Mexico

 Mexico's geography in the Press  Comments Off on Maternal health in southern Mexico
Jul 282010
 

A short piece in The Economist entitled “Maternal Health in Mexico: A perilous journey” (26 June 2010) highlights some of the reasons why maternal mortality has remained stubbornly high in southern Mexico, despite a marked improvement in recent years. Since 1990, maternal mortality (death related to childbearing) has fallen by 36% in Mexico as a whole.

Maternal mortality remains alarmingly high

Carrying the future; maternal mortality remains alarmingly high. Photo: Tony Burton. All rights reserved. Click to enlarge.

Any average figure for the whole country disguises enormous regional differences. Rates for the richer inhabitants in the more developed regions in Mexico are comparable to rate in the USA or Canada. However, rates in the impoverished southern states such as Chiapas, Oaxaca and Guerrero are up to 70% higher than the national average.

In the words of the Research for Development blog “In 2005 the maternal mortality rate was 63.4 deaths per 100,000 live births. In the state of Guerrero the rate rose to 128 deaths per 100, 000 live births. Both figures are a long way from Mexico’s commitment under the Millennium Development Goals (MDGs) of 22.3.” Click here to see how well Mexico is doing in meeting other MDGs.

One study found that in the year 2000, only 44.8% of women in Chiapas gave birth with a doctor present; 49.4% did so with midwives, and the remaining 5.8% were attended by family members or give birth alone.

As The Economist article emphasizes, indigenous women are only one-third as likely to survive giving birth as non-indigenous women.

Why is this? What are the key factors preventing lower maternal mortality rates?

The Economist singles out:

  • means of transport – lack of a car means a total reliance on public transport. Public transport is poor in many remote areas
  • poor roads – many rural roads are unpaved, and the terrain in much of Mexico means than travel times are often much longer than might be expected
  • the expense of the hospital tests and medical supplies which can save a mother’s life
  • errors in delivery care or hospital procedures – according to The Economist, “40% of urban maternal deaths are caused by using the wrong medicine, by botched surgery or by other forms of malpractice.”
  • reluctance to see a male doctor (for social or cultural reasons)
  • language issues – many indigenous women do not speak Spanish at all well, if at all, and very few doctors have any knowledge of indigenous languages, so communication is often poor

What is needed to reduce maternal mortality rates? Understandably, The Economist focuses its attention on financial or economic solutions. More money is needed, it argues, for “midwifes and contraceptives.” It reports that increased funds are coming from a variety of sources, including the Spanish government, Carlos Slim (the Mexican entrepreneur who is the world’s richest man) and from the Bill and Melinda Gates Foundation. Between them, they have announced plans to spend 150 million dollars “on health care for the poor in Central America and southern Mexico”.

In addition, the article calls for investment in “infrastructure, health and education”, making the claim that investment in these areas would help the south catch up with the rest of the country.

We consider this analysis of possible remedies for the problem to be incomplete. The political will to continue making investments in health care installations and personnel over the long-term requires, in our opinion, a significant shift in attitudes among the wealthier and more influential sectors of Mexican society.

At present most members of the wealthy elite regard indigenous Mexicans as second class citizens.

At the time of the Chiapas uprising in 1994, for example, a subset of well-educated Mexicans called on the government to resolve the problems the nation faced in southern Mexico once and for all by using maximum force to re-establish complete military control over the area. Fortunately, the government of the day did not follow their advice but opted for alternative approaches such as dialogue.

Mexico’s indigenous peoples are rarely shown on TV or in advertisements. Instead, most firms prefer to picture blond, blue-eyed mestizos. Alongside increased financial investment in the south, a massive shift in public perception is required. For everyone’s sake, let us hope that this can be achieved with a minimum of turmoil.

Mexico’s government has to make tough choices about how far the national budget can stretch, and which things should be prioritized. Decisions are often based on political expediency as much as on the nation’s pressing development needs. Indigenous peoples are not well represented in federal government.

At present, the best-trained physicians and nurses aspire to work in the world class medical facilities in Mexico’s major cities. Health care workers in Mexico’s remote areas are often there only to fulfill the social service requirements for their professional qualification; they perform valuable work, but certainly have no long-term commitment to these regions. In the words of a MacArthur Foundation researcher (quoted in “Evaluation of The MacArthur Foundation’s Work in Mexico to Reduce Maternal Mortality, 2002-2008”) , qualified doctors (residents) “see their work as a big favor they do for the community, rather than understanding that indigenous populations in our country also have a right to health.”

We believe that a change in how society perceives indigenous peoples is a fundamental prerequisite for genuine long-term change, particularly in states such as Chiapas and Oaxaca.

Mexico’s indigenous populations, and the disparities in wealth and opportunity they face, are analyzed in chapters 10 and 29 of Geo-Mexico: the geography and dynamics of modern Mexico. Ask your local or university library to buy a copy today!!

Apr 052010
 

The soft drinks industry in Mexico is big business. Nationwide, there are about 250 bottling plants. Between them they produce some 300 million cases of soft drinks a year, worth about 15.5 billion dollars. The soft drinks industry may bring economic benefits to industrialists, but is is also related to public health issues. Public health experts link the rising consumption of soft drinks and processed foods in Mexico with the rapidly rising rates of obesity, especially childhood obesity, and of diabetes.

Possibly the world's largest Coca-Cola bottle, Monterrey, Mexico. Photo: Tony Burton. All rights reserved

Despite health concerns, the consumption of soft drinks in Mexico continues to rise. The per person consumption of soft drinks in Mexico has reached 160 liters a year. This means Mexico has overtaken the USA to become the world’s leading consumer of soft drinks on a per person basis, according the the Health Commission of Mexico’s Chamber of Deputies. In terms of total volume of sales, Mexico is second to the USA.

The Commission alleges that Mexico has become a “paradise” for food and drink processing firms offering products with little or no nutritive value. Alarmingly, the highest rates of increase in soft drinks consumption are in the poorer parts of the country.

A National Nutrition Survey in 1999 of 23,000 households revealed startling increases in the number of people in Mexico classified as either overweight or obese. These two categories of over-nutrition are measured by calculating the body mass index, a measure of weight adjusted for height. The percentage of women considered obese rose 160% between 1988 and 1999. In 1999 59% of women and 55% of men were either overweight or obese; by 2008 the figures were 64% and 60% respectively. Only the USA has higher rates of obesity. Even more alarmingly, the rate of childhood obesity in Mexico is also increasing rapidly. A 2002 study found that 30% of elementary school children in Mexico City and 45% of adolescents were either overweight or obese.

The increase in over-nutrition has led to rapid rises in diet-related chronic diseases such as diabetes and cardiovascular disease. The overall effects of diseases on a country’s population can be assessed by working out the disability-adjusted life years (DALY), the years of expected life lost through disease or premature death. In Mexico, the DALY lost to diseases normally thought to be more typical of the developed world such as diabetes, heart attacks and strokes is estimated to be three times greater than the DALY stemming from childhood and maternal under-nutrition.

Mexico has the highest rate of diabetes in the world, more than 11%.9 The total number of patients diagnosed with diabetes has risen seven fold since 1990. Diabetes is now the leading cause of death and costs the country more than $300 million annually, one-third of the public health care budget.

This post includes an edited excerpt from chapter 28 of of Geo-Mexico: the geography and dynamics of modern Mexico. Buy your copy today!