How does Mexico score on the Social Progress Index?

 Books and resources  Comments Off on How does Mexico score on the Social Progress Index?
May 302013
 

The Social Progress Index measures the extent to which countries provide for the social and environmental needs of their citizens. It is a compound index, based on  52 indicators in the areas of Basic Human Needs, Foundations of Wellbeing, and Opportunity that show relative performance in order to elevate the quality of discussion on national priorities and to guide social investment decisions.

Social progress is the capacity of a society to meet the basic human needs of its citizens, establish the building blocks that allow citizens and communities to enhance and sustain the quality of their lives, and create the conditions for all individuals to reach their full potential.

The model used to develop the index is based on asking three key questions that help define social progress:

  1. Does a country provide for its people’s most essential needs? (Basic Human Needs)
  2. Are the building blocks in place for individuals and communities to enhance and sustain wellbeing? (Foundations of Wellbeing)
  3. Is there opportunity for all individuals to reach their full potential? (Opportunity)

In this inaugural Social Progress Index, each of these dimensions is disaggregated into four components, each measured by between two and six specific indicators. Each indicator has been tested for internal validity and geographic availability:

Criteria used to compile Social Progress Index

Criteria used to compile Social Progress Index. Click image to enlarge.

For example the Personal Rights component of Opportunity is comprised of 5 separate variables:

  • Political Rights (Freedom House)
  • Freedom of Speech (CIRI Human Rights Data Project)
  • Freedom of Assembly/Association(CIRI Human Rights Data Project)
  • Private Property Rights (Heritage Foundation)
  • Women`s Property Rights (Economist Intelligence Unit)

How does Mexico score on the Social Progress Index?

Of issues covered by the Basic Human Needs Dimension, Mexico does best in areas including Nutrition and Basic Medical Care and has the greatest opportunity to improve human wellbeing by focusing more on Personal Safety. Of issues covered by the Foundations of Wellbeing Dimension, Mexico excels at providing building blocks for people’s lives such as Health and Wellness but would benefit from greater investment in Access to Information and Communications. Of issues covered by the Opportunity Dimension, Mexico outperforms in providing opportunities for people to improve their position in society and scores highly in Personal Rights yet falls short in Access to Higher Education.

This is how Mexico’s performance stacks up in comparison to the other 49 countries in the survey:

  • Social Progress Index: score 49.7 = rank 25th
  • Basic Human Needs: 49.3 (29th)
  • Foundations of Wellbeing: 50.8 (23rd)
  • Opportunity: 49.1 (25th)

This post is based on a press release from the Social Progress Imperative. For more information about the methodology behind the Social Progress Index, please refer to the inaugural report.

Related posts:
May 272013
 

Kudos to the Earth Island Institute for responding to the many criticisms we and others made of a blog article (“Water Pollution Plagues Mexico’s Scenic Pacific Coast”) by pulling it from their website. The following post has been edited to reflect that fact.

Water quality is a serious concern in many parts of Mexico and Geo-Mexico regularly includes short articles about the main issues as well as case studies related to water pollution (see “Related posts” below).

Ron Granich, a regular Geo-Mexico reader who lives in Pátzcuaro (Michoacán) and recognizes our keen interest in Mexico’s water quality kindly drew our attention to a recent article published on the website of the Earth Island Journal. Sadly, the blog article left much to be desired. The article was subtitled, “Tourists largely unaware that industrial pollution from rivers upstream is making them sick”, and attempted to argue that the pollution of Mexico’s Santiago River is a direct cause of the poor water quality of beach towns such as Sayulita.

The slight problem with this thesis is that the Santiago River flows nowhere near Sayulita and has no connection to the miniscule Sayulita River, far to its south (see map). There is no question that the Santiago is polluted. It collects serious pollutants from the major industrial area of El Salto (a short distance southeast of Guadalajara) and from Guadalajara, and from many smaller settlements along the way. More contaminants are added near its mouth, where the swampy delta has been transformed into productive fields, including tobacco plantations.

Main rivers of Western Mexico.

Map of the main rivers of Western Mexico. Credit: Tony Burton / Geo-Mexico; all rights reserved.

Pollution of the River Santiago is particularly evident at the Juanacatlán Falls near El Salto:

After the Juanacatlán Falls, the Santiago flows in a deep, steep-sided canyon for most of its course (which explains why no fewer than three major dams for hydro-electric power have been built along this stretch, including the one at La Yesca) before meandering across its delta to flow into the Pacific Ocean a short distance north of San Blas.

The Santiago River has no conceivable influence on the pollution levels in the rivers near Sayulita and San Francisco or indeed on beaches in their vicinity. This is not to say that those beaches are clean. The beaches of the Nayarit Riviera may indeed have high levels of Enterococcus spp, as we reported recently when looking at the murky world of water statistics in Mexico.

Note on clean water standards in Mexico and the USA:

It is sometimes argued that Mexico and the USA have different standards for what represents “clean water”. For marine (beach) environments, the U.S. limit is 35 Enterococci per 100 ml. of water, and is based on calculating a geometric mean of counts performed over a five week period. This method greatly reduces the impact of peak Enterococci counts. However, the Mexican limit of 100 Enterococci/100 ml. is based on a single sample maximum value. As explained in this US EPA technical document, Water Quality Standards for Coastal Recreation Waters: Using Single Sample Maximum Values in State Water Quality Standards, the two limits are approximately equivalent in terms of water quality. In other words, a geometric mean of 35 Enterococci/100 ml. means that the water is about as clean as a single maximum value of 100 Enterococci/100 ml.

Water quality IS a major concern in much of Mexico, and we applaud the Earth Island Institute for seeking to draw attention to the issues involved, and for their recent action in removing the original article, which helps to ensure that discussions of these issues are based on facts and not on misconceptions.

As always, we welcome discussion about this (and all our posts) via the comments feature. If the comments feature is not visible, simply click the title of the relevant post, and scroll down.

Related posts:

Tultepec: the fireworks capital of Mexico

 Other  Comments Off on Tultepec: the fireworks capital of Mexico
May 252013
 

No Mexican festival is complete without a dazzling display of fireworks. Gunpowder was unknown in Mexico prior to the arrival of the Spaniards, but its use in fireworks quickly caught on. Firework production is usually a small-scale family affair, and there are workshops specializing in fireworks throughout the country. The undisputed  capital of fireworks is Tultepec, a settlement with 130,000 inhabitants on the northern edge of Mexico City. Generations of expertise have led to Tultepec becoming the source for about half of all the fireworks manufactured in Mexico.

  • Tultepec: Mexico’s Skyrocket Central from The Southwest Center, by Dan Duncan (26-min video)

To celebrate its skilled pyrotechnic craftsmen, Tultepec hosts a 9-day National Pyrotechnic Festival in March each year. The festival, first held in 1989, includes competitions for the best castillos (castles) and toros (bulls) or toritos (little bulls). Castillos can be several stories high, with an intricate interconnected network of sections representing saints, animals, flowers, birds and other designs. Toritos, first recorded in the nineteenth century, are bull-shaped frames placed over the heads of willing volunteers. As the firecrackers explode, the toritos are carried through the streets or dance in imitation of a bull fight as young bystanders pretend to be matadors. About 250 toritos ran the streets of Tultepec in 2013.

The manufacturing of fireworks is tightly controlled by the military, but accidents are all too common and often serious, sometimes fatal. About 2,000 people work directly in the industry, in some 300 small workshops. The creativity of these coheteros (fireworks makers) knows few limits. For example, mid-way through this video, look for the small, firework-propelled vehicle that goes alternately forwards, then backwards, entirely on its own once its fuse has been ignited.

Want to read more?

  • Mexico’s Fireworks Capital by Matthew Power

How well do you know Mexico? The geography of Mexico: Quiz 3

 Quiz  Comments Off on How well do you know Mexico? The geography of Mexico: Quiz 3
May 232013
 

Welcome to our third quiz about the geography of Mexico.

Previous quizzes:

How many of the following can you answer correctly?

If you answer a question incorrectly, you can have more attempts at each question before the answer is revealed.

Good Luck!

Geography of Mexico Quiz 3

try this
Start
Congratulations - you have completed Geography of Mexico Quiz 3. You scored %%SCORE%% out of %%TOTAL%%. Your performance has been rated as %%RATING%%
Your answers are highlighted below.
 Tagged with:

How can Mexico City find sufficient water?

 Updates to Geo-Mexico  Comments Off on How can Mexico City find sufficient water?
May 202013
 

What happens if or when Mexico City needs more water than it is using at present? There are several options, depending on whether authorities choose to modify demand, supply, or both in order to improve the future situation.

In terms of managing (reducing) demand, conservation measures are one possibility. Changing consumer habits may require not only educational programs, but also usage tariffs that reflect the true costs of supply, and that encourage consumers to install water-saving devices and introduce water-saving practices in their daily lives. Demand would also be reduced if less water was lost through leakage. As mentioned in a previous post, in 2009, the National Water Commission (Conagua) estimated that a staggering 40% of potable water nationwide was being lost through leaks in city and municipal systems, with a further 20% not properly accounted for due to billing errors and clandestine connections.

Managing demand may be easier to achieve than managing supply, given that recent efforts to increase supply have met with concerted opposition from environmentalists and the people living in the areas from which water would be transferred to the city. In the last half of the twentieth century, while one political party (PRI) held power, it was possible for politicians to largely ignore the conflicts resulting from inter-basin transfers, arguing that their “solutions” served a national need. Now that local, state and federal politics are more contested, that approach is potential political suicide.

From a political perspective, the most acceptable source of additional water for Mexico City would probably be the recently identified deep aquifer described in Mexico’s major cities confront serious water supply issues. However, that discovery requires further research before its maximum sustainable yield can be determined or it can be brought into service.

Less politically acceptable are the various proposals to bring water from elsewhere to satisfy the thirst of Mexico City. One of the most frequently voiced suggestions is to add a fourth phase to the Cutzamala scheme (see Where does Mexico City get its water from?) to increase the amount of water it supplies by more than 25% to 24 m³/s. In addition, the plan would provide treatment for 42 m3/s of wastewater. This fourth phase, known as the Temascaltepec project (see map), would require the construction of a 120-meter-high, 740-meter-long dam on the Temascaltepec River to create a reservoir with a capacity of 65 million m³.

Map of the Cutzamala project

Map of the Cutzamala project. Click to enlarge.

Aqueducts and a 19-km-long tunnel would carry the water to the Valle de Bravo reservoir. The estimated cost would be $500 million. The Temascaltepec project is opposed by environmentalists and locals and is not likely to get under way any time soon. The residents of the villages near the proposed dam site are afraid that the project would cause their local springs to dry up and would adversely impact their farming of maize, sugar cane, banana, tomato, melon and peas.

To the south of Mexico City, an entirely different proposal is to bring water from the Amacuzac, Tecolutla and Atoyac Rivers, by damming the Amacuzac River, creating a 67 km2 reservoir (between the states of Morelos, Guerrero and Puebla) capable of storing 4,000 million cubic meters. Supplying Mexico City would require a 160 km long aqueduct, and would involve pumping water to a height of 1825 meters, requiring up to 5% of Mexico’s annual national electricity production. On the plus side, this could reduce the future abstraction of groundwater by as much as 50 m³/s.

Related posts:

May 172013
 

Each year the United National Development Program (UNDP) publishes Human Development Index (HDI) scores and ranks for all countries with available data. The 2013 report, which is based on 2012 data, was just published. (Summary HDI 2013 Report: Rise of the South: Human Progress in a Diverse World)

The index takes account of three key development indicators:

  • Life expectancy at birth,
  • Literacy and school enrollment,
  • Gross National Income (GNI) per person (on a Purchasing Power Parity basis, which uses the total amount of goods and services produced in an economy, independent of exchange rates).

The HDI theoretically varies from 1.0 for the highest and 0.0 for the lowest. In the 2013 report, Norway is highest with a score of 0.955 while Congo and Niger are tied at rank 186 for lowest with scores of 0.304.

hdi-report-2013The latest report identifies Mexico along with 17 other countries that have made outstanding progress since 1990. This group of 18 includes none of the traditional industrialized countries. Those at the top of the progress list include South Korea, Chile, Mexico and Malaysia followed by such major countries as Brazil, Turkey, Thailand, China, Indonesia, India and Bangladesh. The HDI scores of all the world’s countries have improved significantly in the last 30 years; but the scores of non-western countries have increased spectacularly over this period.

While HDI scores receive considerable attention, the UNDP’s Inequality-Adjusted HDI or IHDI is a better overall measure because it is far less skewed by the extremely wealthy whose very high incomes push up the GNI per person values but do not adequately represent the development of the society as a whole. For example, the USA ranks third in HDI with a score of 0.937, due in part to the extreme wealth of its highest 1%. On the IHDI scale, the USA scores only 0.821 and ranks 16th.

Mexico’s HDI score is 0.775, but its IHDI score is of 0.593 is much lower because of the great inequality between the rich and poor in Mexico. In terms of IHDI, Mexico ranks 55th. This places Mexico well behind Chile (41st, 0.664), Argentina (43rd, 0.653) and Russia. (2012 data are not available for Russia, but 2011 data places it well ahead of Mexico.) On the other hand, Mexico’s IHDI score is ahead of Peru (62nd, 0.561), Turkey (63rd, 0.560), China (67th, 0.543), Brazil (70th, 0.531), Indonesia (79th, 0.514) and Egypt (0.503). Major countries that seriously trail this group include: India (91st, 0.392), Bangladesh (95th, 0.374), Pakistan (98th, 0.356), Kenya (102nd, 0.344), Nigeria (119th, 0.276) and Ethiopia (121st, 0.269).

The main conclusion is that the overall quality of life continues to improve rapidly in Mexico as well as in many other so-called developing countries. Current trends suggest these improvements will continue in the years ahead. The Congo, ranked 134, is last with a score of 0.172. IHDI scores are not available for many countries because they lack appropriate income distribution data.

Related posts:

Review of Geo-Mexico by Felisa Churpa Rosa Rogers (The People’s Guide to Mexico)

 Reviews of Geo-Mexico  Comments Off on Review of Geo-Mexico by Felisa Churpa Rosa Rogers (The People’s Guide to Mexico)
May 152013
 

Our grateful thanks to Felisa Churpa Rosa Rogers for the following review which appeared in The People’s Guide to Mexico, March 2011:

Growing up in a parochial school system, I was under the impression that the subject geography was limited to identifying countries by their shapes. Richard Rhoda and Tony Burton’s Geo-Mexico: The Geography and Dynamics of Modern Mexico drove the last nail in the coffin of my childhood misconception. Although it has its share of maps, the volume illustrates both the richness of geography as a field of study and the spectrum of cultural, economic, and environmental anomalies that make Mexico so eternally fascinating.

Due to its format and content, Geo-Mexico: The Geography and Dynamics of Modern Mexico is essentially a text book, albeit a rather excellent one. Don’t let that deter you. Although packed with interesting statistics, this book has more to offer: the authors are unafraid to make concrete assertions without miring their observations in academic qualifiers. Burton and Rhoda state facts in a fresh style, provide compelling statistics, and clearly explain all terms and concepts.

Every time a boring-sounding chapter title had me contemplating skipping ahead, I’d find a gem that kept me reading. For example, the chapter “Transportation: The Movement of People and Goods” drew me in with a tidbit about the transportation of silver bullion from Zacatecas in the 16th Century. I was glad I persevered because I stumbled across a fascinating segment on the cultural exchange between the Philippines and Mexico, which began in 1565 when Spain established an import route from The Philippines that crossed Mexico, shipping in at Acapulco and out again at Veracruz.

“..Spanish galleons carried Mexican silver to Manila and returned with spices, silk, porcelain, lacquer ware and other exotic goods from the Orient. ..Many Mexicans settled in Manila and a sizable Filipino community was established in Acapulco. Scores of Nahuatl words entered Tagalog, the main Filipino language. The Filipino currency is still called the peso. In the return direction, Filipinos taught Mexicans the distillation process which enabled the production of tequila.”

If history isn’t your game, Rhoda and Burton provide hard data on immigration, crime, population growth, the effects of NAFTA, ecosystems, and tourism’s impact on the environment. Because I write about Mexico, I will treasure Geo-Mexico: The Geography and Dynamics of Modern Mexico as a resource, but I highly recommend this volume to educators, students, and anyone with more than a passing interest in the culture, history, terrain, economy, politics, or development of the country.

[The People’s Guide to Mexico, March 2011]

May 132013
 

Mexican rivers are not well suited for navigation and thus have had only a minor influence on Mexico’s historical development. Their most important use has been as sources of irrigation water and hydroelectric power. Mexico’s annual flow of river water (roughly 410 km3) is about 25% more than the St. Lawrence River, but 25% less than the Mississippi River. Most of this flow is in southern Mexico which gets by far the most rainfall. Mexico’s dams have an installed capacity of about 11 gigawatts of electricity, roughly one fifth of the country’s total generating capacity; they don’t operate at full capacity, so they only generate about one eighth of total electricity. Only about a fifth of the total river water is consumed for other productive purposes. This proportion is far higher for rivers in drier northern Mexico where river flow is significantly smaller during the dry winter months.

Fig 6-3 of Geo-Mexico: Rivers of Mexico

Fig 6-3 of Geo-Mexico: Rivers of Mexico; all rights reserved

The two longest rivers in Mexico, the Rio Bravo (Rio Grande north of the border) and Colorado, start in the US state of Colorado (see map). The Río Bravo is about 3000 km (1900 mi) long and forms the border between Mexico and the USA for about 2000 km (1250 mi). Occasionally floods shift its location resulting in border disputes. Though it drains about a quarter of Mexico’s total area, its drainage basin is arid and its total flow is less than 2% of Mexico’s total. The Colorado River, which is almost entirely in the USA, formed a vast delta in the otherwise arid Sonoran desert in northern Mexico. The amount of water reaching Mexico has declined dramatically as a result of the Hoover and Glen Canyon dams and other diversions in the USA (see here, here and here). As a result delta wetlands have been reduced to about 5% of their original extent, and the potential water supply for the rapidly-growing urban centers of Mexicali, Tijuana, Tecate and Rosarito has been compromised.

Interestingly, the Mexican river with the greatest flow, the Grijalva–Usumacinta, does not start in Mexico either (see map). The river has a double name because it is actually a double river, with two branches of similar length which both start in Guatemala. Each branch flows about 750 km (465 mi) through Chiapas before they unite in Tabasco about 25 km from the Gulf of Mexico. Each of the two branches has a flow of about 14% of Mexico’s total. The flow of the combined Grijalva–Usumacinta River is about twice that of the Missouri River in the USA.

There are several other important Mexican rivers. The Lerma River starts in the State of Mexico and flows westward into Lake Chapala and continues to the Pacific Ocean with the name Santiago. The Lerma–Santiago River system is about 1280 km (800 mi) long, the longest river entirely in Mexico. It drains about 6% of Mexico. The Lerma–Santiago, which flows through several states, is one of the economically most important rivers in Mexico because it feeds some of the country’s prime agricultural areas as well as the two largest metropolitan areas: Mexico City and Guadalajara. However, its flow is quite small, only about 2% of the national total.

The flow of the Balsas River, south of the Lerma–Santiago, is about three times that of the Lerma–Santiago. Though it offers some white-water rafting and irrigation opportunities, it is not as important economically. There are numerous rather long rivers that also flow west to the Pacific from the Western Sierra Madre in northwestern Mexico, but these have relatively little water. There are also several rather long rivers in the north such as the Nazas that flow into landlocked basins and either die or feed small drying lakes.

Three major rivers flow into the Gulf of Mexico through the state of Veracruz. The Rivers Papaloapan and Coatzacoalcos start in Oaxaca and flow through southern Veracruz. Their combined flow is nearly 20% of the national total. The Pánuco–Tamesi–Moctezuma River system starts in the State of Mexico and carries nearly 5% to the Gulf of Mexico at Tampico.

Related posts:

Hurricane names and forecast for 2013

 Mexico's geography in the Press  Comments Off on Hurricane names and forecast for 2013
May 112013
 

The 2013 hurricane season in Mexico is underway. The “official” hurricane season is from 15 May to 30 November each year for Pacific coast storms, and from 1 June to 30 November for Atlantic storms, though most hurricane activity is concentrated in the months from July to September. Hurricanes are also known as typhoons or tropical cyclones.

The table shows the World Meteorological Organization’s official list of 2012 hurricane names. Note that male and female names alternate. Names are often reused in future years, with the exception of the names of any particularly violent storms, which are officially “retired” from the list for a long time.

2013 Hurricane Names for the Atlantic, Gulf of Mexico and Caribbean
AndreaGabrielleLorenzoRebekah
BarryHumbertoMelissaSebastien
ChantalIngridNestorTanya
DorianJerryOlgaVan
ErinKarenPabloWendy
Ferdinand

2013 Hurricane Names for the Eastern Pacific
AlvinGilManuelTico
BarbaraHenrietteNardaVelma
CosmeIvoOctaveWallis
DalilaJuliettePriscillaXina
ErickKikoRaymondYork
FlossieLorenaSoniaZelda

In their early season forecast for this year, Philip Klotzbach and William Gray, researchers at Colorado State University,  expect hurricane activity in the Atlantic to be significantly higher than the 1981-2010 average. They write that, “The tropical Atlantic has anomalously warmed over the past several months, and it appears that the chances of an El Niño event this summer and fall are unlikely”. (A strong el Niño is likely to minimize Atlantic hurricane activity). They predict that in the 2013 season 18 named storms will form in the Atlantic: 9 tropical storms, 5 moderate hurricanes (1 or 2 on the Saffir-Simpson scale), and 4 severe hurricanes (3, 4 or 5 on the Saffir-Simpson scale). These forecasts will be updated on 3 June and 2 August.

saffir-simpson-scale

For the Pacific coast, Mexico’s National Meteorological Service (Servicio Metrológico Nacional, SMN) is expecting 14 named storms: 6 tropical storms, 4 moderate hurricanes (1 or 2 on the Saffir-Simpson scale), and 4 severe hurricanes (3, 4 or 5 on the Saffir-Simpson scale). The SNM publishes regular updates on hurricane activity (in Spanish) on its webpage and via its Twitter account: @huracanconagua.

How accurate was the forecast in 2012?

The late season (3 August) prediction for 2012 (last year) was for 14 named storms in the Atlantic: 8 tropical storms, 4 moderate hurricanes and 2 severe hurricanes. In reality, the 2012 Atlantic season had 19 named storms: 9 tropical storms, 8 moderate hurricanes and 2 severe hurricanes.

Related posts:

Where does Mexico City get its water?

 Other, Updates to Geo-Mexico  Comments Off on Where does Mexico City get its water?
May 092013
 

Mexico City is one of the world’s largest cities, and the metropolitan area of Greater Mexico City (map) extends well beyond the borders of the Federal District (Mexico City proper) into neighboring states, especially the State of Mexico.  The total population of Greater Mexico City is about 22 million, all of whom need safe access to water.

An old joke relates how engineers initially rejoiced at successfully draining the former lake on which Mexico City was built (something the Aztecs had tried, but failed to achieve), only to discover that the city now lacked any reliable source of fresh water for its inhabitants (something the Aztecs had successfully managed by building a system of aqueducts). Water has been a major issue for Mexico City ever since it was founded almost 700 years ago.

The Mexico City Metropolitan Area’s water supply is currently calculated to be around 82 m³/s. (The precise figure is unclear because many wells are reportedly unregistered). The main sources of water (and their approximate contributions to total water supply) are:

  • Abstraction of groundwater (73%)
  • Cutzamala system (18%)
  • Lerma system (6%)
  • Rivers and springs (3%)

In several previous posts we have looked at several issues arising from groundwater abstraction:

In this post we focus on the Cutzamala system (see graphic), one of Mexico’s most ambitious engineering feats of its time.

Cutzamala scheme

Cutzamala scheme (click to enlarge). Source: IMTA (1987)

The Cutzamala system supplies potable water to 11 boroughs (delegaciones) of the Federal District and 11 municipalities in the State of Mexico. The Cutzamala system is one of the largest water supply systems in the world, in terms of both the total quantity of water supplied (about 485 million cubic meters/yr) and in terms of the 1100 meters (3600 feet) difference in elevation that has to be overcome. The system cost about $1.3 billion, and was undertaken in three successive phases of construction, completed in 1982 (Villa Victoria dam), 1985 (incorporation of the Valle de Bravo and El Bosque dams, originally built in the 1940s and 1950s) and 1993 respectively.

As Cecillia Tortajada points out in Who Has Access to Water? Case Study of Mexico City Metropolitan Area, the investment of $1.3 billion was, at the time (1996), “higher than the national investment in the entire public sector in Mexico… in the areas of education ($700 million), health and social security ($400 million), agriculture, livestock and rural development ($105 million), tourism ($50 million), and marine sector ($60 million).”

The system includes 7 dams and reservoirs for storage, 6 major pumping stations (P.P. on the graphic) and a water purification plant. The volumes stored in the system are dependent on previous years’ rainfall. Water is transferred to the Valley of Mexico from more than 150 km away via reservoirs, pumping stations, open channels, tunnels, pipelines and aqueducts.

The Cutzamala system incorporates the Valle de Bravo and El Bosque dams, built originally as part of the “Miguel Alemán” project that generated hydro-electric power from the headwaters of the Cutzamala River (hence the name for the whole system). The reservoir at Valle de Bravo is an important resource for tourism and watersports. The hydro-electric power scheme is no longer functioning. The Cutzamala system has the capacity to supply up to 19 m³/s of water to the Valley of Mexico. In practice, it supplies almost 20% of the Valley of Mexico’s total water supply (usually quoted as being 82 m³/s).

The pumping required to lift water 1100 meters from the lowest storage point to the system’s highest point (from where gravity flow takes over) consumes a significant amount of energy, variously estimated at between 1.3 and 1.8 terawatt hours a year, equivalent to about 0.6% of Mexico’s total energy consumption, and representing a cost of about 65 million dollars/yr. This amount of electricity is claimed to be roughly equivalent to the annual energy consumption of the metropolitan area of Puebla (population 2.7 million).

The total operational costs for running the Cutzamala System are estimated at $130 million/yr. [all figures in US dollars]. Even operating at full capacity (19 m³/s or 600 million m³/yr), the approximate average cost of water would be $0.214/m³. The true costs are higher given that these calculations do not include the costs of treatment or distribution within the metropolitan area. The price charged to consumers averages about $0.20/m³.

The completion of the Cutzamala system involved resettling some villages. The plans included the construction of some 200 “social” projects to improve living conditions for the people most affected, including local potable water distribution systems, schools and roads. However, more than a decade after completion, there were still some unresolved conflicts concerning people forced to move, with many of them still claiming that they had received insufficient compensation.

Maintaining the Cutzamala system has been an on-going challenge. Most maintenance is scheduled for the Easter holiday period, when factories and offices close down and many Mexico City residents head for the beach, reducing demand for water. Since 1993, a parallel system of canals and pipelines has been built alongside the original system, allowing for sections of the old system to be shut down for maintenance, obviating the need to close the entire system whenever work is carried out.

Main sources:

Related posts:

Swim at your peril through the murky data for Mexico’s beaches

 Other  Comments Off on Swim at your peril through the murky data for Mexico’s beaches
May 062013
 

In the past few months, it has become harder than ever to assess the cleanliness of Mexico’s beaches. Alejandro Calvillo, director of the consumer rights organization “El Poder del Consumidor” recently published an alarming blog post alleging that Mexican authorities have gone to considerable lengths in recent months to mask the true state of Mexico’s contaminated beaches. (Playas contaminadas en México, un secreto de Estado)

Drain on Mocambo Beach, Veracruz. Credit: La Voz del Sureste.

Drain on Mocambo Beach, Veracruz. Credit: La Voz del Sureste.

Calvillo explains that for several years, government agencies published regular monthly statistics relating to the cleanliness of all the country’s major swimming beaches. While some people queried the veracity of some figures, at least the data was publicly available, and provided some starting point for analysis and discussion. Indeed, this data allowed us to write in Geo-Mexico (p 46) that,

“Coastal waters are also regularly monitored for contamination. The percentage of Mexico’s resort beaches that met national water quality norms rose from 93.7% in 2003 (when 226 beaches in 35 destinations were tested) to 98.4% in 2007 (276 beaches in 46 destinations). Seawater at all coastal resorts is now well within the national standard except for Ixtapa-Zihuatanejo on the Guerrero coast.”

However, soon after the new administration (of president Enrique Peña Nieto) took office, Calvillo claims that a decision was made to cease releasing regular monthly data for beach contamination and to remove the historical time series of beach cleanliness data from government internet sites (such as those of the Health Secretariat and Environment Secretariat). Fortunately, Calvillo’s claims are not the whole truth. Data are still being published for many beaches, via an interactive webpage titled Playas Limpias (Clean Beaches) hosted by the Health Secretariat. However, it does appear to be true that the historical series of pre-2013 data have vanished, and that no data is available, even in 2013, for several beaches that were previously regularly monitored.

There is no doubt that in recent years hundreds of Mexican beaches have on occasion had excessive levels of Enterrococos faecalis, the main bacteriological indicator. (About a decade ago, counts of Enterococcus spp. replaced fecal coliform counts as the best way to assess the water quality at public salt water beaches.) The major source of contamination, despite years of campaigning by environmental groups, comes from hotels, towns and cities that continue to dispose of their effluent directly into the sea, often in close proximity to popular swimming beaches (see photo). Progress has been made in some states, including Jalisco, Nayarit and Veracruz, but there is still a long way to go.

water quality on beaches

Water quality on Mexican beaches, 2011. Source: Atlas Digital del Agua México 2012;
(green=good; yellow=moderate; red=poor)

Calvillo writes that official reports in 2011 (see map) listed 99 beaches where Enterococus levels had been found in excess of 200 Enterococci/100 ml of water on at least one occasion. Values over 200 Enterococci/100 ml are considered to pose a “health risk”, according to Mexican norms. Of these 99 beaches, 70 were on the Pacific coast. The worst beaches included 1 in Baja California Sur (La Paz), 4 in Nayarit (including Sayulita, Rincón de Guayabitos), 3 in Jalisco (including Playa del Cuale in Puerto Vallarta), 10 in Michoacán (including Caleta de Campos, Chuquapan and Playa Nexpa) and 3 in Guerrero. In the worst locations, the Enterococci count was over 20,000/100 ml.

Of the 29 beaches with excessive values on the Gulf of Mexico and on the Caribbean coast, the most polluted were on the Gulf of Mexico, including locations in Tamaulipas, Veracruz and Campeche.

In summer 2012, the 22 beaches that posed a health risk according to the data included Regatas (Veracruz), Rincón de Guayabitos (Nayarit) and Playa Carabali (aka Playa Hornos) in Acapulco (Guerrero).

Despite having made less data available for 2013, in the days leading up to the 2013 Easter vacation period, federal and state government officials repeatedly stressed that all beaches were clean and ready to receive the anticipated hordes of holidaymakers. It is difficult to assess the accuracy of these claims in the absence of more data. Were the beaches really clean, or were tourists in some destinations risking potentially serious gastrointestinal and other diseases every time they went swimming?

Adding another layer of complexity to interpreting the statistics is the fact that several states have massaged the data tables by selectively changing the names of some beaches, and omitting others. For example, Calvillo points out that in 2011 the state government of Veracruz renamed four beaches that had previously experienced high pollution levels so that their historical records would be hard to find:

  • Costa de Oro I became Gaviota II
  • Iguana Norte was renamed Tortuga II
  • Iguana Sur became Pelícano II
  • Penacho del Indio was renamed Pelícano I.

In 2012 Veracruz removed two beaches from its list completely: Iguana Centro and Acuario, which it deemed “no longer of interest to tourists,” perhaps because its 2009 count was a record-breaking 159,490 Enteroccocus/100 ml.

Veracruz is not the only state to have “tweaked” its data. Jalisco decided (in 2009) not to monitor either Conchas Chinas or Boca de Tomatlán, both of which had registered high levels of contamination in previous years. In the state of Guerrero, the main beach in Zihuatanejo (historically one of the most polluted beaches) has not been monitored since 2011 because of “technical problems”. [Note: Measurements began again here in 2013, at about the time this post was first published.]

The moral of this post? The absence of data for any particular beach should not be taken as indicating that it is not contaminated. On the contrary, the absence of data might perhaps better be interpreted as a sure sign that the beach HAS or MIGHT HAVE a problem!

Related posts:

Cinco de Mayo – The Battle of Puebla, 1862

 Other  Comments Off on Cinco de Mayo – The Battle of Puebla, 1862
May 052013
 

Note: This is a copy of an article by an unknown author (publication date also unknown) as found originally at http://webspace.webring.com/people/hi/ilg21/puebla.htm and cached on waybackmachine.com:

Author’s Note: This article was drawn from a set of notes created during a trip to Mexico City, most of which were destroyed in a subsequent flood. Details on the Republican forces – and the Mexican’s movements during the battle – are drawn from Mexican books which are presumably accurate, but for which I cannot vouch. (This type of legendary event is prone to some distortion.) Information regarding the French forces is much easier to find. This article should be taken as a best effort to document the battle, according to what sources I could find. Comments and suggestions are welcome.

Painting of Battle of PueblaThe most celebrated battle of the French invasion of Mexico occurred at the town of Puebla, on the road to Mexico City from the landing sites at Vera Cruz. The French, in the Convention of La Soledad, had agreed to withdraw to the coast before resuming hostilities, having moved their men inland under the Convention’s protection to avoid the diseases of the coastal areas. When negotiations between Mexico and France broke down, the French, with Mexican permission, left some sick soldiers in the healthier highlands, on the condition that no fit soldiers remained. When the Mexicans saw Frenchmen walking and carrying their small arms, after all the fit soldiers had ostensibly gone, they protested to the French commander, Lorencz. Lorencz overreacted, deciding that the complaint indicated the impending murder of his sick troops, despite the fact that the Mexicans were satisfied as to the status of the suspects.

Consequently, the French did not complete their retreat to the coast, instead occupying Orizaba. This denied the Mexicans the ability to defend the passes between Orizaba and Vera Cruz. Zaragoza, the Mexican commander, fell back on his second line of defense, the steep pass of Aculzingo. Here, on April 28, the French and Mexicans fought a sharp engagement in which the Mexicans were easily beaten.

Zaragosa retreated to the fortified town of Puebla, which had been both defended and taken during the Wars of Reform (1857-1860), and was protected by five forts arranged on the hills outside the town. He had some 12,000 effectives in the Army of the East, not all of whom were deployed in the town. Lorencz’s Conservative Mexican advisers had fought at Puebla during the recent conflict, and advised him to attack it from the east, instead of the north, which was the French line of approach. Lorencz ignored the advice, advancing straight on the city. (He had heard that the population was friendly to the French, and was only kept in line by the Republican garrison. Thus, he thought a show of strength would cause the population to rise up, and the Republicans to crumble. This was to be proven badly wrong.) He established himself in the town of Amozoc on May 4.

Map of Battle of Puebla
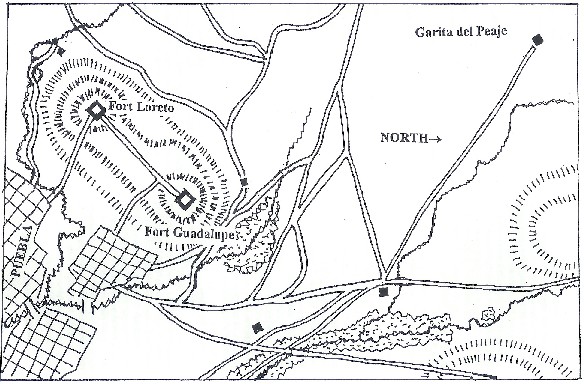
(The map here represents a 5′ x 9′ wargames table at approximately 1″ = 25 yards. Note that the arrow labelled “North” is actually pointing east!)

The French formed up at the Garita de Peaje early the next morning, after a brief skirmish with the Mexican cavalry and a reconnaissance of the area. The troops were drawn up in three columns: the first to attack Fort Guadalupe directly, was supported by the fire of the three batteries of French artillery, and contained the two battalions of the 2nd Zouaves. The second column, to the right of the first, contained only the Naval Infantry battalion. It was to act as a flank guard against mexican attacks from that quarter. The third column, consisting of only the 1st battalion of the 3rd Marine Fusiliers, was deployed to the left of the first column and assigned the role of supporting the attack on Guadalupe. The two battalions of the 99th Line infantry, the 2nd battalion of the Marine Fusiliers, the 1st Chasseurs a Pied, and the Chasseurs de Vincennes were held in reserve under the command of Colonel L’Heriller. The single squadron of Chasseurs d’Afrique was assigned to guard the flanks of the advance against the Mexican cavalry. A small party of engineers was assigned to each column.

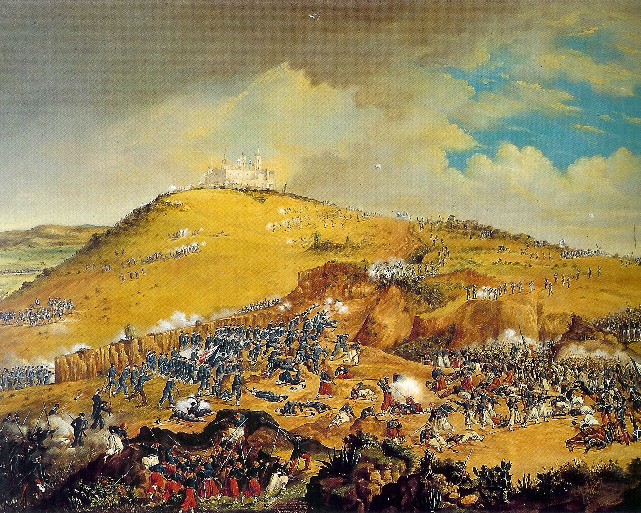
To the north of Puebla, the forts of Loreto and Guadalupe crowned the tops of two heights, connected by a fortified road running just over the peak of the hill. Zaragoza drew up his army to the east of Fort Guadalupe (the easternmost of the two), facing north, so that he could maneuver to face an attack from north or east as necessary. He sent out a skirmisher screen, with his cavalry deployed all the way to his right (60 troopers were initially detached to observe the French), and the Zappadores were deployed on the slope between his left flank and the fort. The end of his infantry line (Diaz’ brigade)was deployed in a brickworks (“La Ladrillera”).

At 11:00 AM, the French bombarded Fort Guadalupe from a distance of about 2,500 yards, causing some damage and casualties. Lorencz advanced his batteries a few hundred yards and resumed the bombardment, this time to no effect. After an hour and a half of bombardment, with half his shells gone, he ordered his troops forward in an assault on the fort.

They were fired on by artillery from both forts, and came under a good deal of musketry; during the French approach, Zaragosa had countermarched the brigades of Lamadrid and Berriozabal and half of the cavalry under Alvarez to protected positions between the forts. The French advanced three times, each assault coming closer than the last. The reserves were slowly committed, until the entire French force was engaged. For the second assault, a double attack was made, not just on Fort Guadalupe, but also towards the town, on the east. This diversionary attack resulted in fierce hand-to-hand combat involving the Zappadores and some other Republican troops, and the Chasseurs de Vincennes, the squadron of Chasseurs d’Afrique, and the 1st battalion of the 99th Line. The Chasseurs a Pied and the zouaves made a final push on Fort Guadalupe, one soldier scaling the walls to plant the Tricolor there, but the man was killed and the flag torn down. The third assault found the French artillery out of ammunition, so the attacks were unsupported. At one point the Morelia battalion in Fort Guadalupe broke and fled, but Arriate rallied the men and they returned to their positions before the fort, defended only by the gunners, could be captured.

After the final assault was repulsed, Zaragoza ordered his cavalry on the right, under Felix Diaz, to charge the French; this worked admirably, accompanied by a simultaneous cavalry movement on the left. At the same time, the troops concealed along the road between the forts wheeled out toward the retreating French, pivoting on their right flank. The Chasseurs a Pied formed square to cover their army’s withdrawal from the Mexican cavalry.

At 3:00 PM it began to rain, the afternoon thunderstorm having been a daily occurrence for a week and more. The ground in front of the forts became very slippery, and at 4:00 PM Lorencz withdrew to positions further back from the town, to await the Mexican counter-attack. His casualties were 462 killed and 8 captured. The Mexicans lost 83 killed and 131 wounded, with 12 captured or missing.

Zaragoza, knowing both the political effects of the French repulse and the improbability of defeating the French in the open field, held his ground. After two days of waiting, Lorencz withdrew to Orizaba. News of the battle was received in France as a challenge to the national honor, and an additional 29,000 men (and a new overall commander – Forey) were sent to Mexico. The French later returned to besiege and take the town, but the victory in 1862 became the holiday we know – Cinco de Mayo – a symbol of the victory of the people over the agents of foreign imperialism.

Orders of Battle

French

  • Major-General de Lorencz
  • 1st Chasseurs a Pied – 1 battalion (720)
  • Chasseurs de Vincennes – 1 battalion (700)*
  • 99th Line Infantry – 2 battalions (1544)
  • 2nd Zouaves – 2 battalions (1143)
  • 2nd Squadron, 2nd Chasseurs d’Afrique (173)
  • 2nd Marine (Colonial) Infantry Regt. – 2 battalions (1280)
  • Naval Infantry – 1 battalion (480)
  • 1st Battery, 9th Artillery Regt. (six 12#)
  • 2nd Battery, Marine Artillery (six 4#)
  • Marine Mountain Howitzer Battery (six 4#)

* This unit was a volunteer (foot) chasseur unit, mostly made up of veterans recently discharged from disbanded Chasseur a Pied battalions. It would be exactly like the regular chasseurs, and probably wore a similar uniform.

Notes: Numbers in parenthesis were French strengths at landing in Vera Cruz. Note that a portion of the French would have succumbed to illness (only 6,000 out of around 7,000 took the field). The strengths given here may thus be slightly high. French artillery was rifled muzzle-loaders. The French infantry all carried the Minie rifle, and the Chasseurs d’Afrique were equipped with the 1842 percussion musket (dragoon pattern). French infantry was generally quite good, especially the zouaves. Note that the Naval Infantry are in fact sailors, dressed much as they were during the defense of Paris in the Franco-Prussian War (although they may have worn the tropical white uniforms instead of blue). The Marine Infantry are not sailors, but marines, dressed in a fashion similar to the line infantry, but with dark blue (some sources say light blue-grey) trousers with a red stripe down the leg.

Republican Mexican

Army of the East: General Zaragoza

  • Commander of the Interior Lines: General Miguel Negrete (in charge of forts Guadalupe and Loreto)
  • Fort Loreto: General Rojo
    “Reforma” battalion from Brigade of Morelia (600)
  • Fort Guadalupe: General Arriata
    One battalion from Brigade of Morelia (600)
  • Reserve: Colonel Juan N. Mendez (300)
    60th Battalion Nacional of Puebla, plus companies of Tetela, Xochapulco, Zacapoaxtla, and Apulco

Field Army

  • Infantry Brigade: General Felipe Berriozabal (1082)
  • 1st Battalion of Toluca
  • 3rd Battalion of Toluca
  • Fijo de Vera Cruz Battalion
  • Infantry Brigade: Colonel Francisco LaMadrid (1020)
  • Rifles of San Luis (initially deployed in front of the Mexican position as a skirmish line)
  • Zapadores Battalion (Colonel Miguel Balcazar)
  • Reforma Battalion of San Luis Potosí
  • Infantry Brigade: General Porfirio Diaz (1000)
  • Guerrero Battalion (Lt. Colonel Mariano Jimenez)
  • Rifle Battalion
  • Cavalry: General Antonio Alvarez (610)
  • Provisional Regiment (under Alvarez’ command)
  • Regt. Carabineros a Caballo, 2 squadrons (?)
  • Regt. Lancers of Toluca, 2 squadrons
  • Provisional Regiment: Lieutenant Felix Diaz (Porfirio’s brother)
  • Trujano Squadron (Major Casimiro Ramirez)
  • Regt. Lancers of Toluca, 1 squadron
  • Regt. Lancers of Oaxaca, 2 squadrons (?)

“?” indicates uncertainty about how many squadrons were present

  • Artillery

18 guns in three batteries, all smoothbore muzzle-loaders, probably 12#. One battery (“Vera Cruz”) is in Fort Guadalupe; one battery is in Fort Loreto, and one is deployed with P. Diaz’ brigade.

Notes: The Mexican infantry were equipped with smoothbore percussion muskets. The Zapadores battalion was one of the elite formations of the Republican army, designated an “engineer unit (and thus probably with black facings instead of thye infantry’s red or the rifles’ green), but fighting (I believe) as infantry in this battle. This army was made up of veterans from the Wars of Reform, and would possibly retain the older grey uniforms of that force. It should be noted that Mexican cavalry almost always carried the lance, despite designations, and would have smoothbore percussion carbines if any firearms were carried at all.

Notes on the Map: The rivers shown on the map are fordable at all points, although paintings of the period show them as flowing through ravines. The hills are gentle slopes, which the Mexicans advanced across in line formation at the end of the battle. The woods would be very light scrub brush, this basically being arid farmland. Two black rectangles toward the bottom of the map represent “La Ladrillera”, a brickworks, just south of Fort Guadalupe, and the “Garita de Amozoc”, a train station, further east. The town of Puebla, while walled, was open in the areas shown on this map, if period paintings can be believed.