Many Mexican Bracero workers still trying to claim their pay

 Excerpts from Geo-Mexico, Updates to Geo-Mexico  Comments Off on Many Mexican Bracero workers still trying to claim their pay
Nov 302013
 

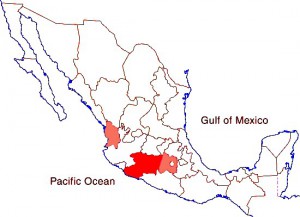
In response to severe labor needs during the second world war, the governments of Mexico and the USA initiated the Bracero guest worker program in 1942. The program enabled Mexico to contribute to the war effort by sending temporary agricultural workers to the USA. Mexicans were granted renewable six month visas to work on selected farms. Most migrants under the Bracero program came from the same three states, Michoacán, Jalisco and Guanajuato. They worked mostly in California and other states along the Mexican border.

Los BracerosAs a result of the Bracero program, some farmers in the USA became very dependent on relatively cheap Mexican labor. The program was considered a great success by farmers. Unfortunately mistreatment of Bracero laborers was widespread. In protest, the Mexican Government threatened to stop the flow of migrants. During the war many Mexicans who were not recruited under the Bracero program entered the USA illegally looking for work. Tolerance for unauthorized migration developed on both sides of the border. With a large dependency in the USA on Mexican farm workers and a large supply in Mexico, there was virtually no way to put a halt to this migration stream.

Labor unions, churches and Latino groups in the USA opposed the Bracero program on the grounds that it held down farm wages and impeded the upward mobility of US Hispanics. They convinced the US Congress to halt the Bracero program in 1964. Between 1942 and 1964 an estimated 4.5 million Mexican Bracero workers entered the USA. At its height in the late 1950s more than 500,000 workers migrated each year. Most were temporary migrants who returned to Mexico within a year, often settling in larger cities, exacerbating the flow of migrants from rural areas to the growing cities. The Bracero program set the stage for the continued high volume of Mexican labor migration to the USA.

In an effort to ensure that the Bracero workers were only temporary migrants to the USA, the US government withheld 10% of all their earnings. The US government then remitted this amount to the Mexican government for payment to the workers on their return home. More than 70 years after the Bracero program started, many braceros are still trying to claim money that they earned legitimately years ago and that is still owed to them by the Mexican government.

The struggles of temporary bracero workers who were never repaid the 10% that had been withheld, are detailed in a short October 2013 article entitled “Bracero Guestworkers, Unpaid”, written by Adam Goodman and Verónica Zapata Rivera (history doctorate students at, respectively, the University of Pennsylvania and Mexico’s National Autonomous University).

The article also describes some of the other injustices faced by Bracero workers, including forced whole-body fumigation with DDT as they crossed the US border.

For more information about the Bracero program, see The Bracero Archive

Related posts:

Remittances to Mexico from USA decline slightly in 2013

 Updates to Geo-Mexico  Comments Off on Remittances to Mexico from USA decline slightly in 2013
Nov 232013
 

Using recent World Bank data, the Pew Research Center conducted an in-depth analysis of remittances sent from the USA to Latin American countries.

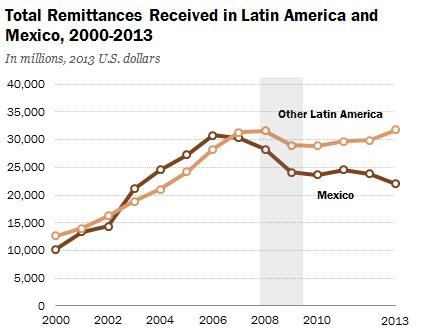
Remittances to Mexico peaked at over $30 billion in 2006, but as a result of the Great Recession, have declined by roughly 29% to an estimated $22 billion in 2013. (The analysis is based on constant 2013 US dollars).

Figure 1 of Pew Report

Figure 1 of Pew Report. Shaded area is period of recession.

On the other hand, remittances to all other Latin American countries reached almost $31 billion in 2008, declined slightly but were up to almost $32 billion in 2013 (see graph).

Note that the data are for remittances sent through formal channels such as banks and formal money transfer businesses. The average cost of sending these formal remittances is significant, an estimated 7.3% in late 2013. If all informal remittances were included, the remittances to Mexico would be an estimated 50% higher, or over $30 billion.

The study focuses particular attention on Mexico because it receives more than 40% of all remittances from the USA to Latin America. Mexico ranks 4th worldwide in total remittances, behind India ($71 billion), China ($60 billion) and the Philippines ($26 billion). These three other countries get remittances from many countries throughout the developed world while 98% of Mexico’s remittances come from the USA. The remaining 2% come mostly from Spain and Canada. No other country in Latin America receives more than 90% of their remittances from the USA. Spain is a bigger source of remittances than the USA for Argentina, Bolivia, Paraguay and Uruguay. This is a bit surprising given the horrible current economic situation in Spain. Many Spaniards are now migrating to Mexico in search of work.

The USA is by far the largest source of all worldwide remittances with $123 billion, followed by Saudi Arabia $28 billion and Canada $24 billion. However, on a per capita basis or percentage of GDP basis, Saudi Arabia, Canada and many other countries send significantly more in remittances than the USA.

The main reason why remittances to Mexico declined after 2006 is that the Great Recession very seriously hurt the construction industry, a main source of jobs for Mexican immigrants. Related to this, the overall loss of jobs in the USA meant that many immigrants returned to Mexico. In recent years it appears that more have returned to Mexico than have migrated to the USA. Thus the number of Mexican-born residents in the USA is declining very slightly for the first time since the Great Depression in the 1930s.

While remittances are extremely important to specific Mexican households, particularly rural households in western Mexico, remittances are not as important to the overall Mexican economy as they are to some other countries. Remittances account for about 2% of the overall Mexican GDP compared to 17% in El Salvador, 16% in Honduras and 10% in both Guatemala and Nicaragua.

The average amount of remittances sent by Mexican immigrants is rather low compared to immigrants from other countries. On average immigrants from Mexico over age 18 sent $2,115 in remittances per year, compared to $5,558 for immigrants from Guatemala, $5,231 for Honduras, $3,076 for Dominican Republic and $2,939 for El Salvador. We do not know if immigrants from these other countries had higher paying jobs than those from Mexico.

Source:

D’Vera Cohn, Ana Gonzalez-Barrera and Danielle Cuddington, “Remittances to Latin America Recover – but Not to Mexico”, Pew Research Center, November 15, 2013.

For more detail about remittances in Mexico, see:


How does Mexico’s unemployment rate compare to that of other countries?

 Other  Comments Off on How does Mexico’s unemployment rate compare to that of other countries?
Nov 212013
 

In a recent post, we looked at The pattern of unemployment in Mexico in 2013 and saw how states in northern Mexico have significantly higher unemployment rates than most of southern Mexico. In this post we consider international comparisons. How does the rate of unemployment in Mexico compare to the rates in other countries?

The OECD (Organisation for Economic Co-operation and Development) publishes harmonised unemployment rates for its 31 member countries. The OECD calculates Mexico’s harmonised unemployment rate for the third quarter of 2013 at 4.9%. This is quite encouraging, since the average for OECD countries is 7.9%. (Note that these figures do not include “underemployment”.) Mexico’s unemployment rate is more favorable than that of its NAFTA partners, Canada (currently 7.1%) and the USA (7.6%).

The OECD members with the highest unemployment rates are Greece (27.4%), Spain (26.6%),, Portugal (16.4%), the Slovak Republic (14.0%) and Ireland (13.8%).

Among OECD members, only South Korea (3.1%)  Japan (4.0%) and Austria (4.1%) have a lower harmonised unemployment rate than Mexico.


The pattern of unemployment in Mexico in 2013

 Updates to Geo-Mexico  Comments Off on The pattern of unemployment in Mexico in 2013
Nov 182013
 

The accuracy of Mexico’s unemployment statistics is frequently questioned in the media but INEGI, Mexico’s National Geography, Statistics and Information Institute, uses internationally accepted methods to compute various different unemployment indices. As in most countries, INEGI surveys are based on samples in urban areas, involving 80,000 interviews in more than 30 towns and cities.

The International Labour Organization defines “unemployed workers” as those members of the workforce currently not working but willing and able to work, who have actively sought work in the past four weeks. Note that the mere act of looking at newspaper or online ads is not considered sufficient evidence of “actively seeking work”.

Mexico’s economically active population in the third quarter of 2013 was 52.3 million people, a very slight (0.01%) increase on the comparable figure for 2012.  The figure represents 59% of the total population aged 14 and over.

INEGI statistics show that the under-employed population was 8.5% of all those with jobs. The unemployed population was 2.7 million, 5.2% of the workforce.

Mexico’s workforce is not gender-independent. 77 out of every 100 men are economically active, compared to only 43 of every 100 women. The workforce can be subdivided between primary occupations (6.8 million, 13.8% of the total workforce); secondary occupations (11.9 million, 24%) and the tertiary or services sector (30.6 million, 61.6% of  workforce), with the remaining 0.6% undeclared.

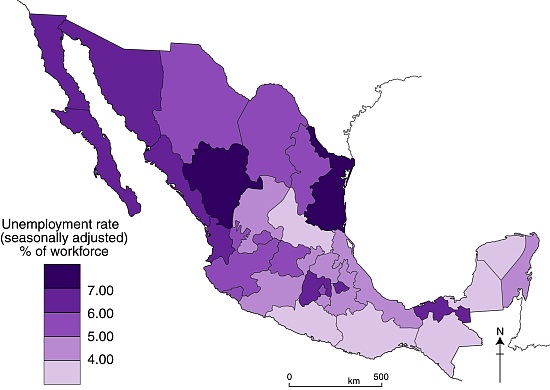
Map of unemployment rates

Unemployment in Mexico, third quarter of 2013. Cartography: Tony Burton; all rights reserved

Out-migration from several southern and western states has significantly reduced unemployment. Several southern states are among those with the lowest unemployment rates in the entire country.

The highest rates of unemployment are mainly in northern Mexico, parts of which have seen on-going violence in the war against drugs. Workers flocked to these areas during the boom times of Mexico’s maquiladora program when firms were encouraged to set up “in-bond” factories in these states, enjoying the freedom to import components and export finished products. However, the slow recovery of the US economy has reduced demand for consumer products and many maquiladora factories have reduced their workforce, leading to intense competition for available jobs and a higher rate of unemployment.

What other factors influence unemployment and help explain the patterns shown by the map?

This post describes the spatial pattern of unemployment in the third quarter of 2013. By way of comparison with 2010, see

Mexico’s economy and workforce are analyzed in chapters 14 to 20 of Geo-Mexico: the geography and dynamics of modern Mexico. Ask your library to buy a copy of this handy reference guide to all aspects of Mexico’s geography today! Better yet, order your own copy…

Nov 162013
 

In an alliance with the Sonoran Institute, the National Geographic Center for Sustainable Destinations helped the region’s communities create the first transborder Geotourism MapGuide, covering northern Sonora and southern Arizona. The mapguide was published in 2007:

The maps  have vignettes of information about history, culture, geology and many other aspects of the region, making it a useful guide for geo-tourists. While some might argue about the choice of locations and attractions described on the maps, this is a useful addition to the background reading for anyone thinking of traveling to this region with some time on their hands to explore.

Surprisingly, the map has only a very brief and somewhat dismissive mention of the El Pinacate and Gran Desierto de  Altar Biosphere Reserve:

“Stand at the rim of this mile-wide volcanic crater and you may feel as if you’re on the moon. This land of ancient lava, sand, and cinder cones is sacred to the O’Odham people. Today, those on the Sonora side of the border call themselves “Pápago.”

Related posts:

Nov 142013
 

About 160 kilometers (100 miles) north of Guadalajara as the crow flies is a wild and inhospitable arm of the Western Sierra Madre called the Sierra of Bolaños, a rugged northern extension of Jalisco most easily reached by light aircraft. The one way trip by road requires driving more than 320 kilometers (200 miles) from Guadalajara, half the distance being inside the adjacent state of Zacatecas. The Bolaños region has for centuries been an important silver mining area, and British capital and engineers left an indelible mark on the towns there.

Bolaños, the setting.

Bolaños, the setting. Credit: Tony Burton; all rights reserved

The once-grand colonial mining town of Bolaños fits snugly between the river and the rocky cliffs into which the first mine shafts were sunk. Its numerous old stone buildings, often with ornately carved doorways and windows, make it a fascinating place to wander around. With judicious restoration, Bolaños could undoubtedly find its way onto anyone’s list of Mexico’s top mining towns to visit. The town’s hanging bridge (puente colgante) links Bolaños, on the edge of mestizo territory, with the Huichol Indian villages in the mountains on the far side of the river. Huichol artwork, including colorful beadwork, is on sale in several stores in the town and it is common to see traditionally-dressed Huichol Indians in the streets.
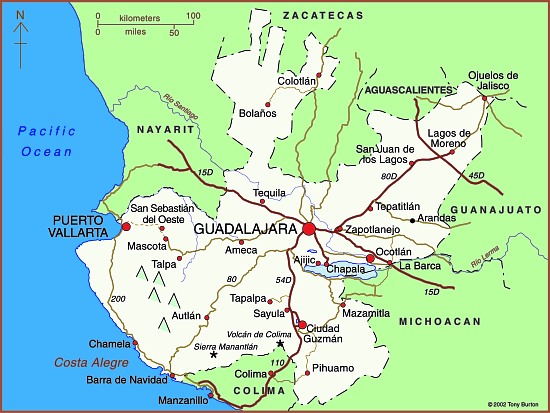
Map of Jalisco state

Map of Jalisco. Copyright 2010 Tony Burton. All rights reserved.

Mineral riches

Relatively little is known of the pre-Columbian history of the Sierra of Bolaños but the area was probably only sparsely peopled, perhaps by Tepecano Indians. By the beginning of the seventeenth century, Spanish adventurers had founded the town of Chimaltitán which later served as their base for both subduing the natives militarily and converting them to Christianity. They later founded the towns of Bolaños, a short distance to the north, and San Martín de Bolaños to the south.

By the mid-eighteenth century, the Spanish were in complete control and the Bolaños mines were producing between 2 and 3 million pesos worth of silver per year, or about 25% of the silver production in the whole of New Spain—a very considerable amount, bearing in mind that each peso was then worth about a dollar.

By the 1760s, 16,000 people lived here. Overlooking an attractive small park in Bolaños is the rococo Guadalupe Chapel (the church of San José), a gift to the town from Antonio de Vivanco, owner of several mines. In 1789, de Vivanco became Marquis Vivanco, Viscount of Bolaños.The prosperity of these times is reflected in the sumptuous architecture of the buildings in Bolaños that date from this period. Two particularly fine examples are the Casa de la Condesa, and Antonio de Vivanco’s former home, with its unusual frescoes, both on the street which parallels the river. Bolaños even boasted a two-story Royal Mint, with a lovely facade. Built on one side of the main plaza in the 1750s, this partially restored gem has an Austrian Hapsburg two-headed eagle carved in the stone above its main door. This royal crest may have inspired the local Huichol Indians to use two and even four-headed eagles (a head for each cardinal direction) in their handicrafts.
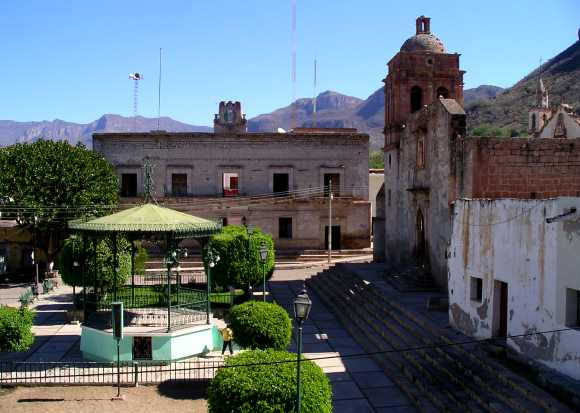
Main plaza in Bolaños

Main plaza in Bolaños. Photo: Tony Burton; all rights reserved

But the boom times of the 1750s were not to last for ever. Following a series of floods (the most serious of which occurred in 1757 and 1781), land disputes, the ever-increasing quantities of costly mercury required for smelting, and disagreements over mining rights, Bolaños’s first boom period came to an abrupt end. By 1798 the town was virtually abandoned. Its largest church, begun in 1778, still stands half-finished; today, this is probably the only place in the world where you can play basketball under floodlights in the shell of an ancient church!

A new company and British miners

British influence in Mexico quickly gained momentum following Mexico’s Independence in 1821. On 27 September 1821, Agustín de Iturbide entered Mexico City in triumph. Most gachupines (Spanish-born residents of Mexico) had fled with whatever assets they could muster back to Spain. The rest were expelled in 1829. Iturbide desperately needed funds, to pay his 80,000-strong army and to set up an administration but, after eleven years of war and chaotic politics, the nation was fatigued and the Treasury empty.

In order to stimulate the Mexican economy, Iturbide needed to revive the mines, many of which had been abandoned during the Independence War. However, the mines had drainage problems and needed large investments of capital. Mexico’s need, coupled with the aspirations and greed of England’s capitalists, proved to be an unstoppable combination. Between 1820 and 1824, no fewer than seven different mining corporations relying on U.K. capital were formed in Mexico. One of these was the Venture Company of the Mines of Bolaños.

The Bolaños Company commissioned a full inspection of their mines. This concluded that, given “modern technology”, a fortune in silver was awaiting exploration, with a potential profit of over a million dollars. The firm’s investors were happy to pour money into bringing British machinery and the ingenuity of expert tin miners from Cornwall to back up their intentions.

In the early days, it was difficult and even dangerous to travel to the mines. No fewer than 15 of the 45 Cornish miners who accompanied the first shipment of machinery for Bolaños in 1825, died through accidents or disease before taking up their posts.

Mine owners had their own agenda. Most insisted that their miners worked completely naked in an effort to thwart any attempted pilfering of ore. Miners grew ever more ingenious in trying to circumvent the rules. They were discovered concealing silver ore in their hair, hollowed-out hammer handles, their mouths and ears, and even, on one occasion, inside the disemboweled body of an overseer killed in an accident!

Despite all the problems the British were determined to succeed. They built a reservoir above the village of Tepec and then a five kilometer long canal, much of it underground, to bring water to the town of Bolaños. On the east side of the small church in Tepec, a camposanto (cemetery) was built specifically for the English miners and their descendants since they were not Catholics and should not therefore be buried in the town’s main graveyard.

To assist in drainage, the British assembled two massive hydraulic wheels, one 12 meters, and the other 14 meters in diameter. Their most important contribution, though, was to import a 32-ton steam engine from the U.K. It took 106 days for this engine to be hauled over the mountains from Veracruz. Locals say that the reason the San José church now has only small bells is because the large ones were melted down to make wheel rims to help move the steam engine.

Bolaños grew into a town of more than 30,000 people, with seven major mines in production, employing thousands of workers. However, despite the mammoth injection of British capital and technology, the company failed to extract enough silver to obtain any return on its investment. In 1842, amidst political rumblings after several accidents and a fire which cost the lives of more than 150 miners, and with the Mexican government delaying payments for silver bars “bought” by the Mint, the company was wound up and Bolaños once again echoed to the sounds of bird-song rather than of hammer, chisel and steam engine.

The town’s population declined to fewer than 5000. It became a ghost town, another casualty of the ever-changing fortunes of mining centers around the world. Various attempts to revive the mines in the late nineteenth century by North American interests came to nothing. At the end of the last century, a U.S.-Mexico joint venture mined successfully for some years but finally went out of production in about 1998. Today, Bolaños is still a small town, a mere shadow of its former self, though one offering a few small hotels and ample opportunities for adventure, eco- and cultural tourism.

Twenty kilometers south of Bolaños, down the valley and past Chimaltitán, is San Martín de Bolaños. The El Pilón mine, near San Martín, opened in the 1980s, is the only mine currently operating in the valley. By 2007, it had produced over 30 million ounces of silver, as well as some ancillary gold.

A visit to this remote corner of Jalisco provokes deep feelings of admiration for the courage and audacity of all those who chose to settle here, including the nineteenth century British immigrants who left a Europe torn by upheaval, in search of fame and fortune in Mexico.

This is a lightly edited excerpt from chapter 23 of my Western Mexico: A Traveler’s Treasury (4th edition, 2013)

Other posts related to Bolaños:

Record avocado production and exports, 2012-2013

 Updates to Geo-Mexico  Comments Off on Record avocado production and exports, 2012-2013
Nov 112013
 

Mexico is the world’s largest producer and exporter of avocados. In the 2012/13 season, Mexico’s avocado orchards produced a record 1.3 million metric tons of avocados. More than 90% of Mexico’s avocados are grown in the state of Michoacán, where about 12% of all agricultural land is currently under avocado orchards.

Avocado-growing states in Mexico.

Avocado-growing states in Mexico

Avocado exports rose 33% to 643,000 metric tons, worth 1.2 billion dollars, also a new record. The main export market remains the USA which imported 518,000 metric tons between July 2012 and June 2013, to help satisfy a demand that has risen rapidly.

Total USA avocado imports in 2012-2013 from all countries were 40% higher than the previous year, and have risen over the past 15 years from 200,000 metric tons to 750,000 metric tons.

In 2012-2013, Mexico also exported 125,000 metric tons of avocados to Canada, Japan, Central America and Europe, a 32% increase over the year before.

The Federal Farming Secretariat has introduced a new national certification system for growers to help ensure consistent quality and reduce spoilage during transport. Many avocado growers are working towards increasing the number of orchards certified by Global Gap, a worldwide certification organization.

avocado-marketingRelated posts:

Geo-Mexico has many other agriculture-related posts (easily found via our tag system). They include posts about the geography of growing/producing Christmas trees, cacao, honey, sugarcane, coffee, chiles, floriculture, tomatoes, tequila, horticultural crops and oranges. Enjoy!

The landforms of the El Pinacate and Gran Desierto de Altar Biosphere Reserve

 Other  Comments Off on The landforms of the El Pinacate and Gran Desierto de Altar Biosphere Reserve
Nov 092013
 

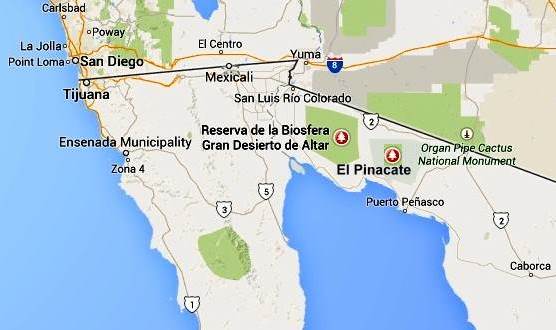
The breathtaking scenery of the El Pinacate and Gran Desierto de Altar Biosphere Reserve in the northern state of Sonora affords visitors a dramatic combination of two very distinct landscape types: volcanic landscapes (El Pinacate) in the east, and sand dunes (Gran Desierto de Altar) towards the west and south.

pinacate-map-googleVolcanic scenery (El Pinacate)

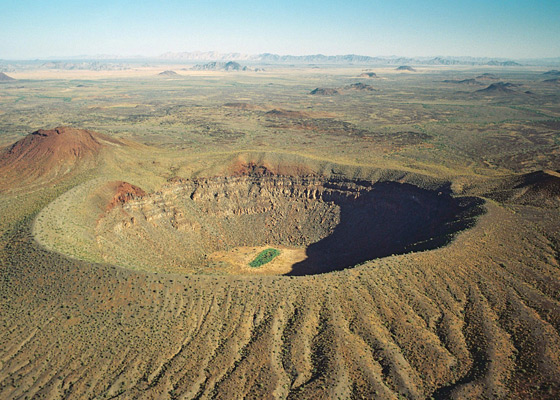
The eastern section of the Biosphere Reserve, El Pinacate, is a dormant volcanic area of around 200,000 ha (2000 sq. km), centered on the El Pinacate Shield (or Sierra Pinacate) which has 3 main peaks: Pinacate, Carnegie and Medio. The El Pinacate Shield is a composite structure, comprised of extensive, successive black and red lava flows, some more than 20 km long, seperated by desert pavement. The El Pinacate Shield boasts a wide array of volcanic phenomena and geological formations. Most of the lava is basaltic (alkaline) in composition, making it relatively fluid when molten; it is mainly of the aa (blocky) type, though some pahoehoe (ropy) lava is also found. The total volume of lava is estimated at between 150 and 180 km3.

Elegante Crater, El Pinacate

Elegante Crater, El Pinacate (example of a maar) Credit: IUCN Tilman Jaeger

Besides the lave flows, the Pinacate area has more than 400 cinder cones (formed 1.2 million years ago) and several lava tubes. The lava flows and cinder cones are only a prelude to the most visually striking features in the reserve: 10 enormous, deep, and almost perfectly circular maars (steam explosion craters). Maars are believed to originate from a combination of explosion caused by groundwater coming into contact with hot lava or magma and subsequent collapse. The maars of El Pinacate are rivalled only by similar formations in Africa. The largest single maar is El Elegante, formed 32,000 years ago, which is 1,400 meters (4,600 feet) from rim to rim and 140 meters (460 feet) deep. It takes visitors a two to three-hour hike to reach its rim and be rewarded by a spectacular view.

The volcanic forms of El Pinacate are relatively recent in geological terms, most having been formed during the Quaternary Period, which began some 2.8 million years ago. The most recent volcanic activity in this area was only about 11,000 years ago. Some volcanologists believe that some of these craters could become active again in the future, with the potential to form volcanoes up to a few hundred meters in height.

Ron Mader, the founder of Planeta.com and a foremost authority on responsible tourism in Mexico, has marveled at the “bizarre and mind-boggling scenery” of El Pinacate., which so resemble the lunar landscape that between 1865 and 1970 it was used by NASA as a training ground for astronauts preparing for the moon landings. The lava field is so vast and sharply defined that it later turned out that the astronauts could easily recognize it from space!

Sand dunes (Gran Desierto de Altar)

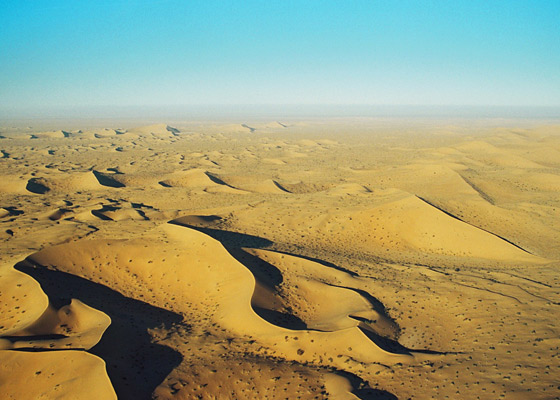
The western and southern parts of the El Pinacate and Gran Desierto de Altar Biosphere Reserve have entirely different scenery. The Gran Desierto de Altar is North America’s largest field of active sand dunes (erg). Several types of dunes are represented here, the tallest reaching 200 meters in height.

The sand needed to form and maintain these dunes comes from the fluvial and deltaic sediments of the Colorado River delta (to the west), the beaches of the Sea of Cortés/Gulf of California (to the south), the River Sonoyta (to the east) and the smaller river and stream fans formed in those parts of the reserve where there are volcanic and granitic mountains.

Sand dunes of Gran Desierto de Altar

Sand dunes of Gran Desierto de Altar

Prior to the opening of the Sea of Cortés (Gulf of California), vast amounts of sediment accumulated in this region brought by rivers of which little trace remains today. The creation of the Sea of Cortés, 5.3 million years ago, shortened the rivers and increased their average gradient (rejuvenation), causing them to cut into the pre-existing landscape leaving behind river terraces, remnants of the former higher level floodplains.

The fields of sand dunes of the Gran Desierto de Altar cover more than 550,000 hectares (5700 sq.km.) Several different kinds of sand dunes are found here–linear, crescent-shaped (barchans) and star-shaped–and they can be simple, compound or complex, depending on seasonal changes in the direction and strength of the wind.

Although linear dunes dominate (70%), crescent-shaped complex dunes and star-shaped dunes are of more interest because they exist in only a few locations in the world. Spectacular and very large star-shaped dunes, up to 200 meters high, occur both singly and in long ridges up to 48km in length. Star-shaped dunes possibly evolved from crescent dunes which changed their direction of movement becoming “reversing dunes”. Side winds may account for the multiple arms of some star-shaped dunes.

Other features – Granite massifs

In addition, there are several granite massifs (inselbergs), such as the Sierra del Rosario, emerging like islands from the sandy desert flats and dunes. They range in elevation from 300 to 650 meters above sea level. They represent another remarkable landscape feature harboring distinct plant and wildlife communities.

Main source:

Related posts:

Nov 062013
 

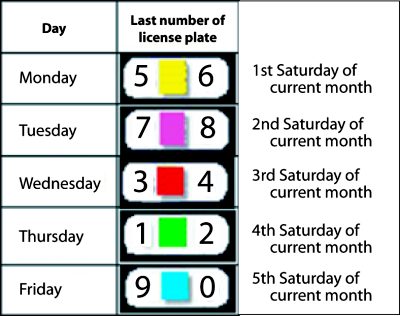
Mexico City and its surrounding areas have a strict “Hoy no circula” (“Today you can’t drive” or “Day without a Car”) program. The program is intended to reduce air pollution from vehicle emissions.

Day without a car table

The graphic shows the major rules for most vehicles. With few exceptions, these rules apply to all tourist vehicles as well as Mexican-plated vehicles.

Click here for a Wikipedia article with more details of the rules, including Saturday rules and exceptions

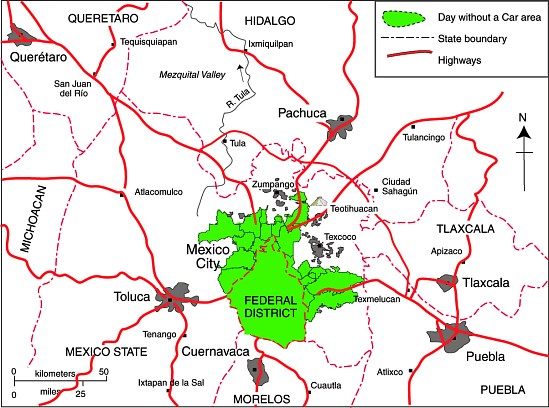
Area subject to “Day without a Car” rules, November-2013. All rights reserved.

As of November 2013, the “Hoy no circula” program applies to the Federal District and the following 18 adjoining municipalities in the State of Mexico (see map):

  • Atizapán de Zaragoza
  • Coacalco de Berriozabal
  • Cuautitlán
  • Cuautitlán Izcalli
  • Chalco
  • Chimalhuacan
  • Chicoloapan
  • Ecatepec de Morelos
  • Huixquilucan
  • Ixtapaluca
  • La Paz
  • Naucalpan de Juárez
  • Nezahualcóyotl
  • Nicolás Romero
  • Tecámac
  • Tlalnepantla de Baz
  • Tultitlán
  • Valle de Chalco Solidaridad

No responsibility or liability is assumed for any situation arising from the information contained within this post, which is believed to be accurate at the time of writing. For more details about the growth of Mexico City, and its urban issues and management strategies, consider buying a copy of Geo-Mexico: the geography and dynamics of modern Mexico, available from all good bookstores, as well as via amazon.com or this webpage.

How well do you know Mexico? The geography of Mexico: Quiz 7

 Quiz  Comments Off on How well do you know Mexico? The geography of Mexico: Quiz 7
Nov 042013
 

Welcome to our seventh quiz about the geography of Mexico.

How many of the following can you answer correctly?

If you answer a question incorrectly, you can have more attempts at each question before the answer is revealed.

Good Luck!

Geography of Mexico Quiz 7

Start
Congratulations - you have completed Geography of Mexico Quiz 7 . You scored %%SCORE%% out of %%TOTAL%%. Your performance has been rated as %%RATING%%
Your answers are highlighted below.

Previous quizzes:


 Tagged with:
Nov 022013
 

Innovation is an important ingredient of economic growth, especially growth in the decades ahead. While most people know what innovation is, it is not an easy concept to measure. Fortunately three different groups have attempted to measure it and compare countries on their “innovativeness”. All three rely on such measures as research and development, number of patents, number of researchers per person, manufacturing, and the percentage of college graduates with science and engineering degrees. However, the number and character of the specific individual variables they use are quite different. As a result their international rankings can be very different. The three approaches are briefly discussed below.

1. Bloomberg’s “Global Innovation Quotient” is based on R&D intensity (20%); manufacturing capability (10%); researcher concentration (20%); productivity (20%); High-tech density (20%); patent activity (5%) and tertiary (education) efficiency (5%).  [For more details, see Global Innovation Index (pdf)]

Bloomberg’s “Global Innovation Quotient”, for 96 countries, ranked Mexico ranked in 2012 as 46th, just behind Chile (41st) and Argentina (43rd), but ahead of Brazil (57th) and Venezuela (62nd). Other notable countries ranked as follows: Finland (1st), Singapore (2nd), USA (7th), Switzerland (8th), Canada (19th), Russia (22nd), Israel (29th) and China (32nd) and Indonesia (64th).

2. In 2009, a “Global Innovation Index” was produced by The Boston Consulting Group (BCG), the National Association of Manufacturers (NAM), and The Manufacturing Institute (MI). In March 2009, the Global Innovation Index ranked Mexico 57th. For comparison, it had Chile at 37th, Argentina at 92nd, Brazil at 72nd, and Venezuela at 108th.

These rankings are significantly higher than the Bloomberg rankings above because this index included more countries which pushed the Latin American countries lower down on the ranking list. But there are other important differences in how innovativeness was measured in the two studies. Compare the following rankings with the ones in paragraph above: Finland (7th), Singapore (1st), Switzerland (3rd), USA (8th), Canada (14th), Russia (49th), (Israel 16th), China (27th) and Indonesia (71st).

3. The third index, confusingly also called the “Global Innovation Index”, is published jointly by Cornell University, INSEAD (The Business School of the World) and the World Intellectual Property Organization (WIPO).

global-innovation-index-2013This very complicated index is based on six pillars (Institutions, human and capital research, infrastructure, market sophistication, business sophistication, knowledge and technological outputs and creative outputs.), each with sub-pillars, and a total of 84 indicators. Of the 134 countries analyzed in 2012, Mexico ranked 79th, way behind Chile (39th) also lagging behind Brazil (58th) and Argentina (70th), but way ahead of Venezuela (118th). This complex index’s rankings are different from but generally align with the two other indices: Finland (4th), Singapore (3rd), USA (10th), Switzerland (1st), Canada (12th), Russia (51st), Israel (17th) China (34th) and Indonesia (100th).

Conclusion

These three indices appear to tell us that Mexico is relatively weak when it comes to innovativeness. Mexico, along with Brazil and India, appears to lag behind other major emerging economies such as China, Russia, South Africa and Thailand. This is a bit surprising considering that Mexico is a world leader in the export of smart phones, flat panel TVs, automobiles and appliances. Apparently these exports are manufactured in Mexico but the innovations that go into their designs mostly come from elsewhere.

Though Mexico is graduating thousands of engineers and science majors, these are either not yet innovating or are finding employment in other countries. If Mexico is to compete in future world trade, it would do well to take steps now to improve its innovativeness.

Related posts: