Geography research in Oaxaca funded by the US military stirred up a storm of protest

 Other, Teaching ideas  Comments Off on Geography research in Oaxaca funded by the US military stirred up a storm of protest
Feb 282011
 

In 2005, a geography research project known as México Indígena, based at the University of Kansas, received 500,000 dollars in funding from the US Defence Department to map indigenous villages in two remote parts of Mexico, in collaboration with the Autonomous University of San Luis Potosí , Radiance Technologies (USA), SEMARNAT (Mexico’s federal environmental secretariat) and partnered with the US Foreign Military Studies Office (FMSO).

Under some circumstances, this might not be a huge problem. After all, the large-scale survey maps of many countries were developed primarily by military engineers with military funding, in the interests of national security. In the past, several countries, including France and the UK, extended their map-making to cover their colonies or dependent territories.

What sets México Indígena apart is that, between 2005 and 2008, under the guise of “community participatory mapping”, US researchers, funded by the US military, collected detailed topographic, economic and land tenure information for several villages in Mexico, an autonomous nation, whose people have long viewed their northern neighbors with considerable suspicion. After all, in the mid-19th century, the USA gained a large portion of Mexico’s territory.

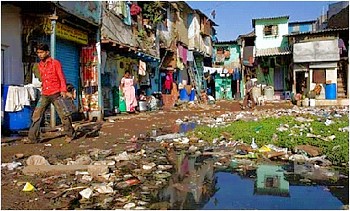
The indigenous villages mapped were in the Huasteca region of San Luis Potosí, and in the Zapotec highlands of Oaxaca, the most culturally diverse state in Mexico. The villages mapped in Oaxaca included San Juan Yagila and San Miguel Tiltepec.

México Indígena is part of a larger mapping project, the Bowman Expeditions. In the words of the México Indígena website:

“The First Bowman Expedition of the American Geographical Society (AGS) was developed in Mexico…  The AGS Bowman Expeditions Program is based on the belief that geographical understanding is essential for maintaining peace, resolving conflicts, and providing humanitarian assistance worldwide.”

“The prototype project in Mexico is producing a multi-scale GIS database and digital regional geography, using participatory research mapping (PRM) and GIS, aiming at developing a digital regional geography, or so-called “digital human terrain,” of indigenous peoples of the country.”

Mexico’s indigenous communities are the poorest in the country, beset by poverty, poor access to education and health care, and limited economic opportunities. Among the common concerns voiced by protesters against the mapping project were that the information collected could be used for:

  1. Counter-insurgency operations
  2. Identification and subsequent acquisition of resources
  3. Biopiracy

Despite attempts at clarification by the project leaders, some communities remain upset, claiming that they were not made aware of the US military’s funding, and have demanded that all research findings either be returned to the community or destroyed (see, for example, this open letter from community leaders in San Miguel Tiltepec).

Choose the conclusion you prefer:

1. Mexico’s indigenous peoples face enough challenges already. Their best way forward is if US military funding for mapping beats a hasty retreat, or

2. Mexico’s indigenous peoples face enough challenges already. Their best way forward is to welcome and embrace offers of help from outside their community.

Further reading/viewing:

The México Indígena controversy is the subject of a short film entitled, “The Demarest Factor: US Military Mapping of Indigenous Communities in Oaxaca, Mexico”. The film investigates the role of Lt. Col. Geoffrey B. Demarest ( a US Army School of the America’s graduate) and the true nature of the mapping project. It discusses parallels between US political and economic interests within the North American Free Trade Agreement (NAFTA) and a US military strategy designed to secure those very interests.

Things to think about:

  • Should academic research in foreign countries ever be funded from military sources?
  • Does the right of self-determination mean that indigenous peoples can refuse to cooperate with academic researchers, even when the research may bring benefits to the community?
  • Should researchers ever be allowed to collect information from a community without the community’s express consent?

The irony about the choice of “Bowman” for the AGS research expeditions.

Isaiah Bowman (1878-1950), born in Canada, was a US geographer who taught at Yale from 1905 to 1915. He became Director of the AGS in 1916, a position he only relinquished when appointed president of Johns Hopkins University in 1935. He served as President Woodrow Wilson’s chief territorial adviser at the Versailles conference in 1919. Bowman’s best known work is “The New World: Problems in Political Geography” (1921). His career has been subject to considerable scrutiny by a number of geographers including Geoffrey Martin (The life and thought of Isaiah Bowman, published in 1980) and Neil Smith who, in American Empire: Roosevelt’s Geographer and the Prelude to Globalization (2003) labels Bowman an imperialist, precisely the claim made by many of its opponents about the México Indígena mapping project.
The changing geography of drug trafficking routes in Mexico

 Mexico's geography in the Press  Comments Off on The changing geography of drug trafficking routes in Mexico
Feb 262011
 

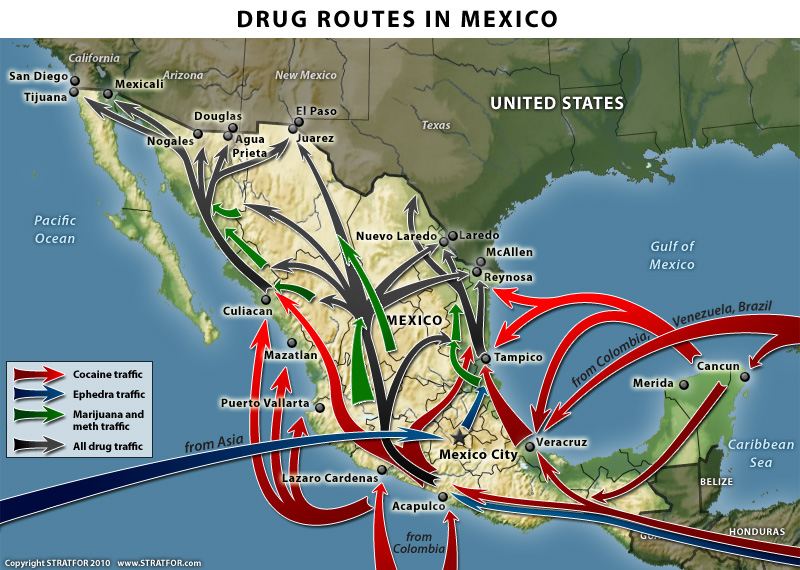
Last year, we reproduced an earlier version of this Stratfor map in The geography of drug trafficking in Mexico. The recently released new version, shown below, shows several changes from the earlier version.

Drug routes through Mexico

Drug routes in Mexico. Copyright Stratfor. Click map for enlarged version.

Map © Copyright 2010 Strategic Forecasting Inc, STRATFOR www.stratfor.com. This map is republished with permission of STRATFOR.

The main changes are that the new map:

  • does not show the territories controlled by each of the major drug cartels. As we have noted previously, the boundaries between cartel territories are hotly disputed and in a constant state of flux.
  • shows more marijuana traffic originating from Jalisco and Michoacán states.
  • labels the importing of ephedra from Asia as coming “from China”
  • adds a new route for ephedra trafficking from Central America through Guatemala and along Mexico’s Pacific Coast towards Acapulco.
  • strengthens the arrows showing a much larger movement of “all drug traffic” northwards from central Mexico through Chihuahua state and towards the border city of Ciudad Juárez, with branches of this flow extending not just to the Pacific Coast (as in the old map) but also to the Gulf Coast.

What do these changes mean?

First, it is apparent that the overall pattern of drug trafficking routes is more complex than originally thought. Shifting alliances between trafficking groups means that the “map” is being constantly redrawn to reflect the changing relative strengths of the different cartels and drug gangs.

These shifts in routes, and in the zones at the margins of each cartel’s territory mean that the focus of drug-related violence in Mexico is not limited to fixed locations, but that virtually anywhere in the country could find itself “in the wrong place at the wrong time” at some point in the future.

This is quite different to the pattern of drug-related violence 30 or 40 years ago, when most of the problems were concentrated in a relatively small number of generally isolated areas where the drugs were actually grown.

To read more posts about the geography of narcotic drugs in Mexico, use the “drugs” tag in the navigation bar on the left hand side of each page.

Other relevant link

Geo-Mexico: the geography and dynamics of modern Mexico discusses drug trafficking in several chapters.  A text box in chapter 20 looks at the drug trafficking business and efforts to control it.  Buy your copy today to have a handy reference guide to all major aspects of Mexico’s geography!

Feb 242011
 

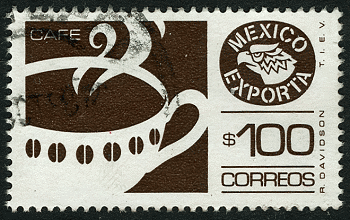
Mexico is the world’s seventh largest coffee producer and one of the leading suppliers of organic, shade-grown coffee. The nation’s 480,000 coffee growers, most working small parcels of land less than 5 hectares (12 acres) in size, are concentrated in Chiapas, Veracruz and Oaxaca, and produce 268,000 metric tons a year. While Mexican coffee consumption per person is rising, 62% of the harvest is exported, bringing in $400 million annually.

This year’s crop escaped the deep freeze in late January and early February that decimated corn, tomatoes, bell peppers and other crops in northern Mexico, but unseasonal rains and cold weather in coffee-growing regions of southern and eastern Mexico have reduced coffee yields and mean that this season’s crop is also ripening unevenly. Some growers are worried that this could be the worst coffee harvest in almost 20 years.

Mexico's exports: coffee

Coffee, one of Mexico's most important agricultural exports

With fewer berries on each plant, the potential earnings for coffee-pickers are poor, since it takes longer to fill each basket with ripe berries. Some experienced coffee pickers are looking for alternative employment hoping for better pay. According to growers, the less experienced pickers remaining on the job are causing more damage to the bushes than normal, because they employ a hand picking method known as “ordeñando” (milking) in which they run their hands rapidly along a branch, stripping away the leaves as well as the beans. The problem for growers is that this technique reduces the following year’s crop.

The 2010-2011 harvest season began in October. Government officials are still estimating a harvest of 4.4 million 60-kg sacks, which would be a total of about 264,000 metric tons. However, Agroindustrias Unidas de México, Mexico’s largest coffee exporter, believes that 3.5 million sacks will be nearer the truth. If the exporter is correct, the current harvest would be only marginally better than Mexico’s 1992-1993 harvest which was the lowest in the past twenty years.

The only silver lining in this cloud is that coffee prices on international markets are high and rising, mainly due to problems in Colombia, so Mexican growers have a good incentive to pick every single ripe berry they can find.

Feb 222011
 

The Baja California peninsula is one of the most arid areas in Mexico and water shortages are becoming critical, especially along the southern coastline which has matured into one of the most desirable jet-set locations in the world.

Desalination, which involves removing the salts from seawater or brackish water to provide drinking water, is one viable option to ensure future water security for the region. There are already about 70 desalination plants on the Peninsula, though most are very small (25 liters/second or less) and are powered by conventional electricity. Several larger desalination projects on the Baja California Peninsula, some of which will rely mainly on solar power, are currently in the planning stages.

Map of Baja California PeninsulaLa Paz, the capital of the state of Baja California Sur, faces a particularly serious water supply problem. The local aquifer is reported to be already overexploited and suffering from salt water intrusions. Because of its greater density, seawater normally underlies freshwater in coastal areas. Salt water intrusions occur when so much fresh water is pumped out of coastal aquifers that it is replaced by the underlying salt water. The water supply issues have led to water rationing, in which almost half of La Paz’s 250,000 residents receive water only 12 hours or less each day.

Obtaining water from the desalinization of sea water is more expensive than abstracting water from aquifers via wells, but avoids the possibility of salt water intrusions.

A recent Ooska news article provides details of the desalination plants already built or being planned:

Baja California Sur:

Cabo San Lucas, opened in 2007, treats approximately 230 liters a second (60 gallons/s), equivalent to 20 million liters (5 million gallons) a day.

La Paz. Still at the proposal stage is a desalination plant capable of treating 200 liters a second.

Sierra de la Laguna. A Canadian mining company (Vista Gold Corp.) planned a desalination plant to provide water for its proposed Concordia open-pit mine. However, the mining plan was refused an essential permit by the Mexican government.

Baja California:

Ensenada. The 28-million-dollar El Salitral desalination plant is a “highly innovative project that would put the region on the map globally for desalination”. Construction is due to start later this year, and the plant should be operational by the end of 2012, when it will treat 250 liters of seawater a second. The plant would supply 96,000 people with potable water.

Rosarito. Preliminary geological and environmental impact studies are underway for a desalination facility in La Misión large enough to supply the needs of 96,000 people. Still in the concept stage is a second desalination plant  which would supply water across the border to San Diego in California.

San Quintín. Plans exist for a desalination plant with a capacity of 150 liters a second.

Main source: The OOSKA News Weekly Water Report for Latin America and the Caribbean (16 February 2011)

Want to read more?

Cold weather wreaks havoc on crops in Sinaloa, Mexico

 Mexico's geography in the Press  Comments Off on Cold weather wreaks havoc on crops in Sinaloa, Mexico
Feb 212011
 

Corn production has been the core of Mexican agriculture throughout its history, and continues to be very important. Production has increased by more than 40% since 2000. Currently corn is grown on about half of all agricultural land. However, corn is a rather low value crop and accounts for only about 14% of total crop value.

Corn, for both human and livestock consumption, is grown virtually everywhere in Mexico and is the leading crop in 17 of the 32 states. The leader in volume of corn produced is Sinaloa with 28% of the national total. Other major corn states are Jalisco (12%), State of Mexico (6%), Michoacán, Guanajuato and Guerrero (5% each).

The unusually cold weather in early February 2011 hit farming areas in northern Mexico particularly hard. Farmers in Sinaloa, the “Bread Basket of Mexico,” report that 300,000 hectares (750,000 acres) of corn were destroyed after unusually cold temperatures in the first few weeks of the year. A further 300,000 hectares suffered some damage. Sinaloa has 470,000 hectares of farmland devoted to the white corn used to make tortillas; 90% of this area has been damaged. Heriberto Felix Guerra, federal Secretary for Social Development (SEDESOL) called the weather-related losses the worst disaster in Sinaloa’s history. The economic loss could exceed three billion dollars.

The federal Agriculture Secretariat is rushing urgent aid to farmers, including tax breaks and low-interest loans for seed, in the hopes that many of them can replant their corn crop while there is still time. As of today, more than 130,000 hectares of corn in Sinaloa have already been replanted. The aim is to reseed between 200,000 and 300,000 ha (500,000-750,000 acres) of corn, for an eventual harvest (in Sinaloa) of 3 million metric tons of corn. The reseeding must be completed by 10 March as, after that date, there are too few “growing days” to guarantee a harvest. Average yields in Sinaloa for white corn are expected to fall from their usual 10 tons/ha to around 7 tons/ha this year.

Mexico has an annual shortfall in corn production and always has to import some corn (mainly from the USA and South Africa) to meet total domestic demand. This year, the government is considering raising its usual import quotas to ensure ample supplies of corn (and tortillas) for the coming year. Corn prices have already shot up; Mexico’s imports are going to cost a lot more than in recent years.

Citrus orchards, tomato crops and other vegetables were also decimated. Tomatoes are by far the most important horticultural crop in Sinaloa, but other crops affected include green beans, squash and chiles. It will be another 6 weeks to 2 months before another tomato harvest is possible. The price of tomatoes also rose immediately and could double, at least temporarily, within the next few weeks.

The Mexican tomato crop is mainly the larger Roma variety which is widely used in the fast food industry. Already at least one fast-food chain in the USA is adding tomato slices to hamburgers only on request; the smaller tomatoes used in salads are not affected by the recent cold snap.

Previous related posts:

Review of Geo-Mexico by Geographic Travels

 Reviews of Geo-Mexico  Comments Off on Review of Geo-Mexico by Geographic Travels
Feb 202011
 

Geographic Travels is one of the web’s most popular and long-established geography blogs. Here is what they had to say about Geo-Mexico:

Book Review: Geo-Mexico

Earlier we featured the great blog, that is still active, Geo-Mexico. The blog Geo-Mexico is a promotion blog for the book, also called Geo-Mexico. We received a review copy of the book and can honestly say the book more than lives up to the blog.

As a child growing up in the center of the United States I knew Mexico was 1) the source of many immigrants 2) the land of tacos and 3) home of advanced American Indian nations. Later on I became more and more interested in Mexico because of its advancement into multiparty democracy, its rich Catholic tradition, and complex mixture of cultures. Because of my growing interest the book Geo-Mexico was a great read for me.

The book is authored by Dr. Richard Rhoda and Tony Burton. Both of these men are experts on Mexico. Their book proves their expertise. Written in textbook form Geo-Mexico covers the whole range of the geography of Mexico. The chapters covers Poctepec (“hill that smokes” or physical geography), Michmaloyan (“place to fish” or economic geography), and Teocalcingo (“where the temple is” or human geography). Thirty-one chapters cover the full range included in these three subfields. Whether one wants to read about the rise of Protestantism in Mexico, the stark north-south political divide between Right and Left, or water issues throughout the country this is the book to read.

Catholicgauzette greatly appreciated the professional, easy-to-read maps. Though the maps are in black and white this is not an issue because of the smart use of different fill designs.

Geo-Mexico is fragmented into a text book style which allows one to jump to the chapter of interest without fear of missing out. However, it does help if you read related chapters like “Migration to the USA” and “Mexicans in the USA.”

Geo-Mexico is a great read. To quote myself during the first day of high school Spanish, Me gusta

Geographic Travels, April 12, 2010

– – – – –

Six months on, one of the authors of Geographic Travels kindly sent us this short note:

It truly is a great book.  When I was back stateside there would be slow nights were I would take it off the bookshelf, open to a random chapter, and just read.  I like how you combined the textbook format with general readability.”

Feb 192011
 

Tomatoes are one of the many native Mexican plants that have become essential ingredients in the cuisine of many countries. Mexico is the 10th largest tomato producer in the world, after China, USA, India, Turkey, Egypt, Italy, Iran, Brazil and Spain (FAO 2008).

Mexico produces both red tomatoes (tomate or jitomate, depending on the region) which have high yields and account for about 75% of total tomato production, and green tomatoes (tomate verde) which have a lower yield and account for the remaining 25% of production.

The statistics in this post apply to the production and export of red tomatoes only.

The main varieties of red tomatoes in Mexico are:

  • vine-ripe large rounds
  • cherry tomatoes
  • Roma tomatoes, which now account for 54% of all tomato plantings in Mexico, as demand for them has increased at the expense of other kinds
  • greenhouse tomatoes (the collective name for several other varieties)

Greenhouses

The single most significant trend in tomato growing in Mexico is the increasing volume of production coming from greenhouse (including shade house) cultivation. Greenhouse cultivation still represents only a small portion of total tomato production in Mexico, but results in greatly improved yields.

Mexico has around 3,200 hectares of horticultural greenhouses in total. An earlier post analyzed the essential characteristics and advantages of the production of horticultural products in greenhouses.

The major advantages for tomato production are:

  • helps to raise yields
  • enables producers to move away from seasonal production and grow tomatoes virtually the entire year
  • ensures a higher quality and consistency of product
  • facilitates better food safety
  • helps to ensure that production and packing plants meet or exceed international standards

Rising yields

Yields are rising. Open field yields have risen from 23 metric tons/ha in 1990 to 28 mt/ha in 2000 and to 39 mt/ha in 2010. The highest open field yields are about 45 mt/h in Baja California and Sinaloa, due in part to their efficient pest and disease control protocols.

Greenhouse cultivation of tomatoes gets much higher yields, but also requires more capital investment and more expensive inputs of labor, fertilizers and pesticides. Open field cultivation of tomatoes in Sinaloa and Baja California costs between $3,800 and $6,000/ha. Greenhouse and shade house production of tomatoes can cost up to $22,000/ha. (All figures in US dollars.) The costs associated with many imported inputs (agrochemicals, seeds and fertilizers) are high; they are also dependent on the peso/dollar exchange rate.

Greenhouse yields in Mexico are generally about 150-200 mt/ha. Tomato growers in the USA and Canada using greenhouses achieve yields of up to 450mt/ha, so Mexican producers still have plenty of room for continued improvement.

The largest area of greenhouse tomato cultivation is in Spain (20,000 hectares). By comparison, the USA has only around 350 ha of greenhouse tomatoes, Canada has 650 ha and Mexico 730 ha.

Area cultivated and volume of production

The total area (greenhouse and open field) devoted to tomato cultivation in Mexico has decreased in recent years, from 85,000 ha in 1990 to about 60,000 in 2010.

Tomato production in Mexico for the 2010/11 season is forecast to reach 2.2 million metric tons.

Seasonality

There are two major seasons:

1. In the winter season (October-May), growers in Sinaloa are the main producers and exporters of fresh tomatoes. Michoacán, Jalisco, and Baja California Sur also produce significant amounts in the winter season. Sinaloa growers have adopted very modern cultivation methods, selecting varieties with an improved and extended shelf life, employing highly efficient drip irrigation, and using plastic mulch to maintain their high yields. Sinaloa has 15,000 hectares devoted to tomatoes, of which 1,340 hectares are using greenhouses or shade houses.

2. During the summer season (May-October), growers in Baja California are the main producers and exporters of fresh tomatoes, along with growers in Michoacán, Jalisco, and Morelos.

Tomatoes on a stamp

Mexico Exports: Tomatoes

Domestic consumption and the export market

The final consumption figure for the domestic market depends largely on the volume of tomato exports (primarily to the USA), since domestic consumption is essentially restricted to those tomatoes that do not enter the export flow. Volumes of exports, and price/ton depend on numerous factors beyond the control of farmers in Mexico, including, for example, the seasonal weather in Florida which will help determine the volume of tomatoes produced in the USA.

The USA imports tomatoes from both Canada and Mexico. Mexico’s share of USA tomato imports has risen rapidly since 2000 on account of their lower costs. Mexican tomatoes are less expensive for USA buyers than their Dutch or Canadian counterparts, due to Mexico’s cheaper labor rates, lower transport costs, and their modern cultivation and packing systems.

Mexico’s 1.1 million tons a year of tomato exports are worth 1.1 billion dollars. Mexico does import some tomatoes, but the annual value of imports rarely exceeds 65 million dollars.

Potential risks faced by Mexico’s tomato growers

  • extreme heat may make tomatoes ripen earlier than usual, as happened in Sinaloa in December 2009
  • the switch from open field tomato production to protected production (in greenhouses or shade houses) requires an expensive investment in infrastructure and technology.
  • international prices each year are a major determinant of how many hectares of tomatoes are planted the following year

Note on the first GM tomato

The first GM tomato to be commercially cultivated was the Flavor Saver from the Calgene company, planted in 1995 in Mexico, California and Florida. It was marketed as the MacGregor tomato. It was primarily developed because it did not spoil as quickly as previous varieties of tomato. MacGregor tomatoes last at least 18 days without spoiling, from the time they are picked. Conveniently, consumers also preferred their taste to then-existing varieties. Developing the first GM tomato cost Calgene 25 million dollars and took 5 years.

Main source:

Flores, D and Ford, M. Tomato Annual: area planted down but production up. USDA Foreign Agricultural Service GAIN (Global Agricultural Information Network) Report, January 2010


The ten states in Mexico with the lowest population density

 Other, Teaching ideas  Comments Off on The ten states in Mexico with the lowest population density
Feb 172011
 

In a previous post we looked at “The ten states in Mexico with the highest population density“. At the end of that post, we suggested that you try to guess which 10 states in Mexico have the lowest population density. In this post, we look at the answer!

Below is a table showing the 10 states in Mexico with the lowest population density.

RankStatePopulation density (people/sq.km)
1Baja California Sur8.6
2Durango13.2
3Chihuahua13.7
4Campeche14.3
5Sonora14.7
6Coahuila 18.1
7Zacatecas19.8
8Quintana Roo29.9
9Nayarit38.9
10Oaxaca40.6

You probably got many of the answers right, since several of the states in the table are among Mexico’s largest states in terms of area. In fact, Mexico’s five largest states (Chihuahua, Sonora, Coahuila, Durango and Oaxaca, are all on the list. However, there are some surprises. For example, both Nayarit and Campeche are smaller than the average Mexican state. Why might this be so? Large parts of each state currently have very few residents. Much of Nayarit is either mountainous terrain or swampy, coastal wetland. A large part of Campeche is sparsely peopled tropical evergreen forest (tropical rainforest).

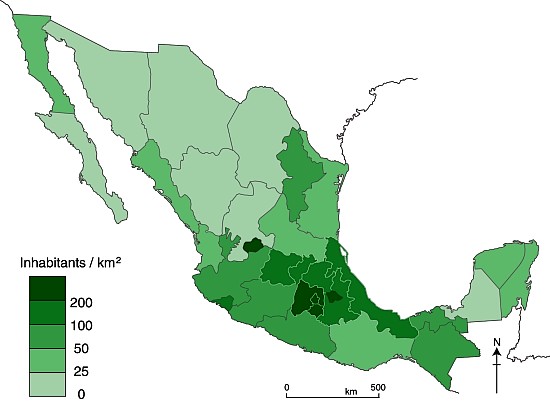
To conclude this brief look at population density, here is a map showing the population density of all Mexico’s 32 states. [For simplicity, we count the Federal District as a state.]

Population density map
Mexico’s population density in 2010

Several chapters of Geo-Mexico: the geography and dynamics of modern Mexico discuss population issues, including population distribution and population density. Buy your copy today to have a handy reference guide to all major aspects of Mexico’s geography!

Feb 162011
 

The commercial greenhouse production of horticultural crops in Mexico started in the 1950s, with floriculture (flower-growing) operations. It then expanded to include some vegetables in the 1980s. During the 1990s, larger, more modern greenhouses were introduced specializing in the growing of vegetables for export markets.

In 1991, Mexico had only 51 hectares of vegetable production in greenhouses. The signing of NAFTA in 1994 stimulated increased investment in Mexico from Israel, Holland, and Spain in greenhouse systems designed to boost vegetable production for the US market.

The area of greenhouses has risen rapidly since then to about 2,400 hectares in 2009, almost double the area recorded for 2005, and including 1,000 hectares devoted to flowers.

What are the advantages of production using greenhouses?

  • possible to control the environment
  • enables a higher quality of product, suitable for international markets
  • improves food safety
  • allows growers to have a tighter control on water quality
  • enables farmers to supply winter markets when fresh food prices are at a premium
  • avoids or offsets weather-related problems, such as cold spells or heavy rain
  • allows farmers to perfect crop timing to match times of highest prices
  • avoids some open-field issues such as weeds and insect pests
  • takes advantage of Mexico’s long days and many hours of strong sunlight

What are the disadvantages of production using greenhouses?

  • construction costs
  • costs to install necessary infrastructure, such as water supply
  • cost of energy required to heat greenhouse in the event that sunshine is insufficient
  • nearby residents may object to the unsightly view of hectares of greenhouses

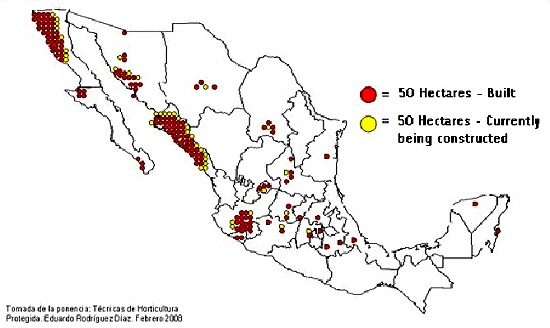
Protected horticultural areas in Mexico

Protected agricultural areas in Mexico (greenhouses and shade houses), 2007. Source: Mexican Association of Protected Horticulture

Where are most of Mexico’s greenhouses located?

Vegetable greenhouse production is highly developed in five states (see map):

  • Sinaloa (26.3% of Mexico’s total production of greenhouse vegetables)
  • Baja California Sur (13.5%) -NB this state’s protected area has increased sharply since 2007, the date of the map
  • Baja California (9.5%)
  • Jalisco (7.4%)
  • Sonora (6.9%).

Combined, these five represent 84% of the total greenhouse production of vegetables.

By area planted, the major crops produced in greenhouses in Mexico are:

  • tomatoes (60% of the total)
  • cucumbers (20%)
  • chiles (10%)

One clear trend is that the area of all these crops is expanding very rapidly. For instance, from 2007 to 2008, the area devoted to the greenhouse production of tomatoes rose 19%, while chiles and cucumbers rose 35% and 29% respectively.

95% of Mexico’s greenhouses are plastic, rather than glass, mainly because the extra insulation afforded by glass is not required in most parts of Mexico given the climate. Many greenhouses are now made in Mexico, but others are imported from Israel, Canada, the Netherlands, Spain, France and the USA. Many of the greenhouses are high-roofed, between 4 and 5 meters tall.

A basic greenhouse structure covering 1 hectare (2.4 acres) costs about $160,000, excluding the cost of any irrigation system. Because financing is difficult to obtain in Mexico, many producers rely on relatively low-cost plastic greenhouses, which do not usually have any heating systems. Some newer models have hot water or gas heating systems which guarantee that crops can be timed to coincide with peak demand during the US winter.

In an effort to hasten the adoption of improved horticultural technology, the Agriculture Secretariat (SAGARPA) has started a shared-risk fund to encourage greenhouse installation, provided it is to grow crops other than tomatoes, including herbs, chiles and lettuce.

Besides initial costs, another major constraint on the expansion of greenhouse systems in Mexico is distance from the main markets north of the border. From some areas, reaching markets in California requires a 36-hour truck ride. Any delay means that the crop will not arrive in optimum condition.

Another limitation which restricts the universal adoption of greenhouses is that they generally need a good supply of water. This is not always easy (or cheap) to obtain, especially in arid areas such as Baja California.

Finally, as with most farmers, greenhouse operators in Mexico face competition from growers in other countries, and also have to contend with market volatility (whether real or perceived).

Sources:

Lopez, J. and K. Shwedel. 2001. The Mexican greenhouse vegetable industry. Industry Note 032-2001, 5 pp.

Cantliffe, D and Vansickle, J. Mexican Competition: Now from the Greenhouse. http://hos.ufl.edu/protectedag/pdf/MexicanGHindustry.pdf [accessed 22 January 2011]

Flores, D and Ford, M. Greenhouse and Shade House Production to Continue Increasing. USDA GAIN report, 22 April 2010. [accessed via link at http://www.freshplaza.com/news_detail.asp?id=62580; accessed 27 January 2011]

Feb 142011
 

The January 2011 issue of Scientific American contains “Casualties of Climate Change” which takes an in-depth look at three case studies (Mozambique, Mekong Delta and Mexico) where (according to the authors) climate-forced migrations will be inevitable in the next 70 years.

The article combines research which formed part of the European Commission’s Environmental Change and Forced Migration Scenarios project (EACH-FOR), a global study on environmentally induced migration, with maps produced by the Center for International Earth Science Information Network (CIESIN) at Columbia’s Earth Institute.

In the case of Mexico, the case study suggests that the declining rainfalls and decreasing water availability resulting from climate change will lead to more frequent and more prolonged droughts, especially in central and western Mexico, alongside an increase in the frequency and severity of tropical storms and hurricanes. The authors cite evidence from interviews in the state of Tlaxcala that some climate-induced migration is already under way, as rainfall totals and timing have become less predictable.

Of course, predicting what the climate in Mexico (and elsewhere) will be like in 2080 is a decidedly risky undertaking. At best, such predictions are a statistical guesstimate. Even so, it is still useful to consider alternative climate change scenarios, together with their likely impacts on  environmental hazards and future movements of people. Looking at the alternatives may allow the development of strategies and policies which can reduce or minimize the adverse  social, human, economic and environmental impacts.

Four colorful maps accompany the Mexico case study:

  • population density
  • rain-fed agricultural land
  • incidence of drought
  • predicted change in runoff.

The downside: In some instances, data given in the text appears to conflict with the data shown on these maps. Furthermore, no definition for “drought” is offered in either the text or the relevant map. The drought map’s categories are stated to be “percent of growing season that experienced drought, 1988-2007) but some methodological clarification of the underlying assumptions made and how these figures were calculated would have greatly enhanced the map’s value.

Previous posts about climate change in Mexico:

Mexico’s environmental trends and issues are examined in chapter 30 of Geo-Mexico: the geography and dynamics of modern Mexico. Ask your library to buy a copy of this handy reference guide to all aspects of Mexico’s geography today! Better yet, purchase your own copy…

Remittances sent back to Mexico rose only 0.12% in 2010

 Updates to Geo-Mexico  Comments Off on Remittances sent back to Mexico rose only 0.12% in 2010
Feb 122011
 

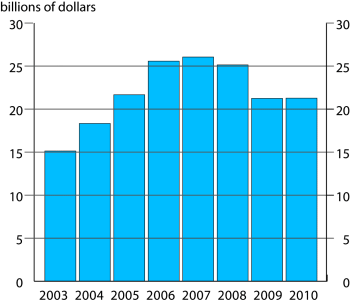
The graph below shows the trend in the total value of remittance payments sent home by Mexican migrant workers employed in the USA.

Remittances to Mexico, 2003-2010

Remittances to Mexico, 2003-2010

The graph shows how the total value of remittances sent home to Mexico rose rapidly from 2003 to 2007 before declining slightly in 2008 and then crashing in 2009 as the full effects of the recession in the USA became apparent. The good news for 2010 is that remittances have increased slightly; the bad news is that the increase is very, very small. Remittances remain well below their 2007 level.

The total value of remittances in 2010 was 21.271 billion dollars. Given change in the dollar-peso exchange rate over the year, and even before considering the impact of inflation, families that received the same number of dollars in 2010 as in 2009 were actually significantly worse off, with the lowest income families hit disproportionately hard.

Of the 32 states, the following 13 states all had lower remittances in 2010 than in 2009:

  • Chiapas
  • Hidalgo
  • Veracruz
  • State of México
  • Nuevo León
  • Tamaulipas
  • Tabasco
  • Chihuahua
  • Querétaro
  • Campeche
  • Nayarit
  • Puebla
  • Oaxaca

The “winners” who received more remittances in 2010 than in 2009 were:

  • Baja California
  • Baja California Sur
  • Sonora
  • Aguascalientes
  • Colima.

Related posts on this bog:

Migration between Mexico and the USA is the focus of chapter 25 of Geo-Mexico: the geography and dynamics of modern Mexico. Ask your library to buy a copy of this handy reference guide to all aspects of Mexico’s geography today! Better yet, order your own copy…

The ten states in Mexico with the highest population density in 2010

 Other, Teaching ideas  Comments Off on The ten states in Mexico with the highest population density in 2010
Feb 102011
 

The table below shows the ten states in Mexico with the highest population density (people per square kilometer) in 2010.

Question:

  • Find a blank map of Mexico [click here for a printable pdf map of Mexico] and locate each of these ten states.
  • What do these ten states have in common?
  • Can you suggest a reason or reasons for any pattern you have found?

[the answer appears at the end of this post; no peeping until you have come up with an answer!]

RankStatePopulation density, 2010 (people/square km)
1Federal District5,936.8
2State of Mexico678.9
3Morelos364.2
4Tlaxcala292.6
5Aguascalientes211.0
6Guanajuato179.2
7Puebla168.5
8Querétaro156.2
9Hidalgo128.0
10Colima115.5

Did you suggest that these states are all small in area? If so, well done! The list of the ten states with the highest population density includes the eight smallest states in Mexico in terms of area, and all ten of the states are in Mexico’s twelve smallest states. The other two small  states, neither of which has a very high population density, are Nayarit and Tabasco; they are both smaller than either Puebla or Guanajuato.

Why should small states have higher population densities than large states? The main reason is because it is likely that a higher percentage of their area will be used for villages, towns and cities, and there will be less countryside (where population densities are usually very low) than is likely in large states. Of course, many other factors also play a part, including the location of resources (minerals, soil, water, biodiversity), the opportunities for employment and the relative wealth of the area (people may migrate from poorer areas to areas which they think are richer or offer more opportunities).

In a future post, we will take a look at which states in Mexico have the lowest population density.But, before we do, which states do YOU think will have the lowest population density? Choose your “top ten”, make a list or mark them on your map, and come back to Geo-Mexico next week to see if you are right…

Feb 092011
 

Previous posts in this mini-series analyzed the recently released data on drug war deaths for Mexican states, the largest cities, and the communities with the highest death rates per 100,000 population. This post looks into the number and rates of drug war deaths for 25 communities with large numbers of non-Mexican (ex-pat) residents or visitors. Drug war deaths include deaths of drug cartel members, law enforcement personnel, and innocent by-standers.

Drug war death rates of larger communities of particular ex-pat interest were addressed in an earlier blog which focused on municipalities with populations over 750,000. The table (link above) indicates the number drug war related deaths (from December 2006 through December 2010) and the rate per 100,000 population in the 25 municipalities.

In general, these municipalities have death rates below the national average. The rates for Xalapa, La Paz, and Los Cabos are less than one eighth the national average. Those for Guanajuato and San Miguel de Allende are almost as good. Apparently, foreigners in these communities have relatively little to worry about with regard to drug war violence.

Only six of the 25 have death rates above the national average. Mazatlán has the highest drug war death rate, about four times the rate for all of Mexico, but still less than a fourth that of Ciudad Juárez. The rate for Playas de Rosarito is also very high, even higher than that of its northern neighbor Tijuana. Interestingly, its southern neighbor Ensenada has a low rate, about one eighth that Playas de Rosarito.

The drug war death rate for Tepic, Nayarit is over twice the national average. The rates are also relatively high for Cuernavaca and Nuevo Laredo. Actually, the rate for Nuevo Laredo is less than most of the smaller municipalities surrounding it. There is considerable variation among three adjoining municipalities near Lake Chapala: Ixtlahuacan (43.8), Jocotepec (28.5) and Chapala (18.4). All three have rates many times higher than the nearby city of Guadalajara (9.7).

I wonder how much these drug war death rates are affecting or will affect the choices that foreigners make concerning where to live or where to vacation in Mexico?

Previous posts in this mini-series:

Related posts about the geography of drug trafficking and drug cartels in Mexico:

Geo-Mexico: the geography and dynamics of modern Mexico discusses drug trafficking in several chapters. A text box on page 148 looks at trends in the drug trafficking business and efforts to control it. Buy your copy today to have a handy reference guide to all major aspects of Mexico’s geography!

The 10 states in Mexico with the lowest male-female ratios

 Other  Comments Off on The 10 states in Mexico with the lowest male-female ratios
Feb 072011
 

In an earlier post, we looked at the ten states with the highest male-female ratios (ie the most males for every 100 females). This time we turn our attention to the ten states with the lowest male-female ratios (or the most females for every 100 males). Male-female ratios are sometimes referred to as “sex ratios”, though that term does not indicate clearly whether the values are males for every 100 females (the usual interpretation) or females for every 100 males.

States with low male-female ratios

The 10 states with the lowest male-female ratios

Male-female ratios are an important demographic statistic and reflect numerous environmental, economic and social factors. In turn, they influence many aspects of economic and social geography. This Wikipedia entry on Human Sex Ratio offers a general introduction to some of the geography associated with male-female ratios.

The table and map show the 10 states in Mexico with the lowest male-female ratios.

RankStatemale-female ratio (males/100 females)number of females per 100 males
1=Federal District91.8108.9
1=Oaxaca91.8108.9
3Puebla92.1108.6
4Guanajuato92.8107.8
5Hidalgo93.2107.3
6Michoacán93.4107.1
7Morelos93.5107.0
8=Tlaxcala93.7106.7
8=Veracruz93.7106.7
10Querétaro94.3106.0

What do these states have in common?

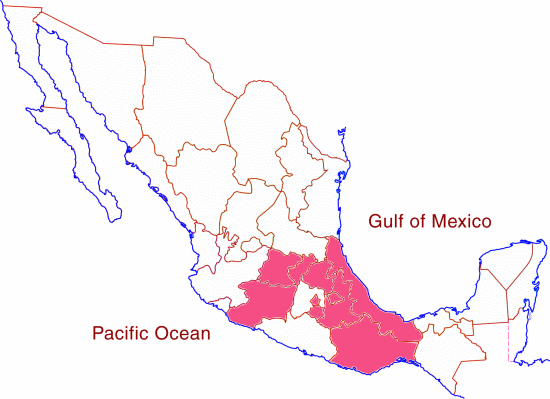
The short answer would appear to be not very much, apart from forming a band across central Mexico!

The Federal District may offer far more employment opportunities for females than for males. Females who live in other states may be more likely to migrate to Mexico City in search of employment than to attempt the more complicated migration to the USA which has become the preferred option for many young males.

Oaxaca, along with Guanajuato and Michoacán, has a high rate of out-migration. In most situations, demographers consider that males are more more likely to migrate than females. This gender imbalance in migration would leave a low male-female ratio at the place of origin. Out-migration may also explain why Morelos and Tlaxcala, two of the smallest states in Mexico, are on the list.

In conclusion, while male-females ratios are an important population statistic, it is not necessarily always easy to explain them, especially when considering a country as complex as Mexico.

Relevant posts previously published on this blog:

Several chapters of Geo-Mexico: the geography and dynamics of modern Mexico discuss population issues, including population growth, distribution, gender differences and density. Buy your copy today to have a handy reference guide to all major aspects of Mexico’s geography!

Are the residents of Ciudad Nezahualcóyotl becoming middle class?

 Mexico's geography in the Press  Comments Off on Are the residents of Ciudad Nezahualcóyotl becoming middle class?
Feb 062011
 

In a previous post –Nezahualcoyotl, an irregular settlement which grew into a monster – we looked at the extraordinarily rapid growth of Ciudad Nezahualcóyotl (today a city of over 1.5 million inhabitants) from its start on the dried-up lake bed east of Mexico City in the 1950s.

Nezahualcoyotl, the city of dreams

Nezahualcoyotl, the city of dreams, now has its own Sears and Wal-Mart

The Economist special report on Latin America (11 September 2010) included an evocative description of Ciudad Nezahualcóyotl, well worth reading. It describes how “an impoverished settlement of dirt streets and one-storey shacks built of grey concrete blocks” [ed: see photo] has become “comfortable homes of two or three storeys” with asphalted streets and “traffic-clogged thoroughfares… lined with businesses of every type”. Next to a Wal-Mart and private hospital is a shopping center with Sears and C&A, boutiques and a multiplex cinema.

The inhabitants aspirations have changed from bicycles to private cars, and include hopes of a higher education and finding a well-paid position elsewhere. The article concludes that the rise in living standards of many of the people is (arguably) creating  a “middle class” society, before examining the concept of “middle class” in much more depth.

Which communities in Mexico have the highest rates of drug war deaths?

 Updates to Geo-Mexico  Comments Off on Which communities in Mexico have the highest rates of drug war deaths?
Feb 052011
 

Guadalupe, in the state of Chihuahua, with 139 deaths among a population of only 6,458, has the highest drug war death rate in Mexico: 2,152 drug deaths per 100,000 population. Mier (Tamaulipas) and General Treviño (Nuevo León) are not far behind. Most of the municipalities in the attached table (link below) have rather small populations; 15 of the municipalities had fewer than 6,500 inhabitants in 2010.

A previous post noted that among big cities, Ciudad Juárez had the highest rate of drug war deaths by far, over twice the rate for the runner-up Culiacán in Sinaloa. However, Ciudad Juárez ranks only 10th when smaller municipalities are included in the analysis. The table lists the 20 municipalities with the highest rates of drug war related deaths (from December 2006 through December 2010) per 100,000 population. Drug war deaths include deaths of drug cartel members, law enforcement personnel, and innocent by-standers.

All 20 municipalities listed in the table are in one of four border states: Chihuahua, Sonora, Nuevo León and Tamaulipas. In fact, half of the 20 municipalities are in the state of Chihuahua. Five form a cluster around Ciudad Juárez on the border and four are just south of Chihuahua City. The three in Tamaulipas and three in Nuevo León are bunched together between Nuevo Laredo and Reynosa within 60 kilometers of the border. Three of the four in Sonora are not far from the highway joining the state capital Hermosillo with Nogales on the US border.

Previous posts in this mini-series:

Related posts about the geography of drug trafficking and drug cartels in Mexico:

Geo-Mexico: the geography and dynamics of modern Mexico discusses drug trafficking in several chapters. A text box on page 148 looks at trends in the drug trafficking business and efforts to control it. Buy your copy today to have a handy reference guide to all major aspects of Mexico’s geography!

Trends in income distribution in Mexico: are the poor getting poorer?

 Excerpts from Geo-Mexico, Updates to Geo-Mexico  Comments Off on Trends in income distribution in Mexico: are the poor getting poorer?
Feb 032011
 

Many proponents of the North American Free Trade Agreement (NAFTA) which came into effect in 1994 argued that it would stimulate Mexico’s economic development, leading to an increase in employment, and (in due course) higher wages. This would have a beneficial effect for the entire workforce but the effect would be most pronounced among the poorest 20%. It would help reduce the differential between their incomes and those of the middle income earners.

Opponents of NAFTA argued that free trade would have the opposite effect and would lead to a widening gap between the haves and the have-nots.

Which argument is right? Has the gap widened or narrowed?

Research addressing this question reveals the complexity of the issue. Complicating the situation is the economic instability which followed the passage of NAFTA as well as the significant urban–rural and regional inequality that persists in Mexico. Available data suggest that inequality increased during the 1980s and again slightly between 1996 and 1998 but inequality then declined until 2002. This decline appears to have continued. A chart published last year in The Economist (11 September 2010) shows a decline in Mexico’s Gini coefficient (ie a decline in inequality) of almost 1% between 2000 and 2006.

Researchers conclude that the giant gap between rich and poor will not decline naturally as the economy grows, but will require specific policy actions.

The overall impact from the global economic downturn which started in 2008 is not yet clear but past experience suggests that the gap tends to decline during economic hard times. Some economists argue that a trend of a widening gap between rich and poor was already evident in the years prior to NAFTA. If so, this suggests that globalization and Mexico’s support for free trade are not the only factors responsible for the apparently growing disparities of wealth in the country.

Even if the disparities are widening, it does not necessarily mean that the poor are getting poorer. It is perfectly possible that their real incomes (and standards of living) could increase, by say 10%, while those at the top increase by 15%. Both groups would therefore be getting richer, even though the gap between them widened. On the other hand, it is possible that both could be getting poorer, with the gap increasing or declining. Clearly, income data are difficult to analyze and we should be very cautious to avoid making any overly-simplistic statement about the poor getting poorer.

Inequality in wealth in Mexico: the GINI index

 Excerpts from Geo-Mexico  Comments Off on Inequality in wealth in Mexico: the GINI index
Feb 022011
 

Several chapters of Geo-Mexico: the geography and dynamics of modern Mexico look at inequalities in Mexico. The inequalities considered include inequalities related to physical geography (eg water availability), population dynamics (eg fertility rates), gender (eg. female employment), economics (eg GDP/person), development indices (eg HDI) and the distribution of wealth within the country, or within a subset of the country’s residents, such as those who live in a particular state.

Taking the country as a whole, Mexico has a very unequal distribution of wealth:

In 2005, the per person income for the richest 10% of the population in Mexico was $44,035. This figure is over four times the national average, indicating that per person income in Mexico is very unequally distributed. In fact only two countries—Brazil and South Africa—in the top twenty-five economies are more unequal. The average for all twenty-five countries is about three times the national average. The distribution in Japan and Italy is far more equitable; in both countries, the highest 10% get only about twice the national average. [Geo-Mexico, p 89]

If we want a more precise measure of how unevenly distributed the wealth or income is in a country, it is possible to calculate the country’s Gini coefficient. The Gini coefficient, or index, was developed by Italian statistician Corrado Gini :

Without going into all the mathematical details, Gini index values range from 0 (perfect equality) to 100 (extreme inequality with all wealth in the hands of a single individual).The Gini index at a national scale usually falls between 25 and 70. It provides a very useful way to compare income inequalities between countries or to analyze trends in income inequality over time.

In general, the Gini index loosely correlates with development, since most developed countries have lower Gini values (usually below 36) than more developing countries where the values often exceed 40. However, there are many notable exceptions. The USA has a Gini index of 45, higher than might be expected, and Bangladesh and Ethiopia both have relatively low Gini values of 33 and 30 respectively.

Mexico’s Gini index of 48 is high, indicating that inequality remains a real issue. Is Mexico’s inequality of wealth increasing or diminishing? There is little evidence that the GINI index has fallen significantly since the 1990s, though we will return to this question in a future post.

One important thing to note is that in Mexico’s case, its informal sector (not reflected in Gini calculations) may serve to ameliorate the degree of income disparities suggested by the Gini figure taken on its own. Some economists suggest that countries with such high Gini indexes need to double their rates of economic growth before they will succeed in reducing their incidence of poverty. [Geo-Mexico 89-90]

Mexico’s ambassador to the UK protests to the BBC

 Other  Comments Off on Mexico’s ambassador to the UK protests to the BBC
Feb 012011
 

Mexico’s ambassador to the UK, Eduardo Medina-Mora Icaza, has written to the BBC, demanding an apology for remarks made in a recent episode of Top Gear, the BBC’s flagship motoring program. Co-presenter Richard Hammond made the remarks during a review of the Mexican sports car, the Mastretta, labeling Mexicans as “lazy, feckless, flatulent and overweight”. The overweight comment might be accurate, but the ambassador is (rightly) outraged at the other words used by Hammond, and by other comments made in the show.

Jeremy Clarkson, Top Gear’s lead presenter, suggested at the time, and on air, that the Mexican ambassador would not complain about the comments because he would be slumped asleep in front of the television. The time has come for the BBC to make Clarkson eat his words, and issue a full apology.

The limited edition Mastretta MXT enters production this year; 150 cars will be made in the first year. It is the first sports car to be entirely Mexican designed and made.

[Uupdate: 2016 – The Mastretta MXT is no longer in production – see Mastretta press release]

Related post:

Is drug war violence concentrated in Mexico’s largest cities?

 Updates to Geo-Mexico  Comments Off on Is drug war violence concentrated in Mexico’s largest cities?
Feb 012011
 

It is commonly believed that crime and murder rates are highest in the largest cities. Is this the case for Mexican drug war deaths? Recently available data (from Mexican government) on drug war deaths indicate that this generalization is definitely NOT TRUE for Mexico’s largest cities. Drug war deaths include deaths of drug cartel members, law enforcement personnel, and innocent by-standers.

True, the largest numbers of deaths were recorded in some of the larger cities: Ciudad Juárez (6,637 deaths), Culiacán in the state of Sinaloa (1,890), Tijuana (1,667), Chihuahua City (1,415), and Acapulco (661). On the other hand, the number of deaths per 100,000 population was four to five times higher in some small municipalities in the states of Chihuahua, Sonora, Tamaulipas, and Nuevo León. A future post will take a more in-depth look at the drug war death rates in these smaller communities.

In this post, we consider only those Mexican municipalities whose 2010 population exceeded 700,000. The table below indicates drug war death rates per 100,000 population since December 2006 for the 22 Mexican municipalities with 2010 populations over 700,000. It is no surprise that the rate for Ciudad Juárez (484.7) is the highest, about 16 times the national average of 30.8. The city accounted for about 30% of the country’s drug war deaths during the four year period. In general, the cities with the highest rates are in the northern or western areas with concentrated drug cartel activity. However, Saltillo in the northern state of Coahuila has one of the lowest rates.

Only six of the largest 22 municipalities in the table have death rates above the national average. Monterrey is just below the average, Guadalajara is less than a third the average and Mexico City is less than a quarter. Two Mexico City suburbs, Nezahualcoyotl and Ecatepec in the State of Mexico, have rates nearly twice that of the capital, but are still less than half the national average. Zapopan, a suburb of Guadalajara has a rate 36% higher than Guadalajara.

Puebla, the center of the fourth largest metropolitan area in the country has an extremely low rate, less than 3% of the national average. Querétaro and Mérida also have very low rates.

Our next post in this mini-series will look at the smaller municipalities which tend to have the highest drug war death rates of all.

Previous posts in this mini-series:

Related posts about the geography of drug trafficking and drug cartels in Mexico:

Other relevant link

Geo-Mexico: the geography and dynamics of modern Mexico discusses drug trafficking in several chapters. A text box on page 148 looks at drug trafficking business and efforts to control it. Buy your copy today to have a handy reference guide to all major aspects of Mexico’s geography!