Is the south shore of Lake Chapala in Jalisco or in Michoacán?

 Maps, Mexico's geography in the Press  Comments Off on Is the south shore of Lake Chapala in Jalisco or in Michoacán?
Aug 242022
 

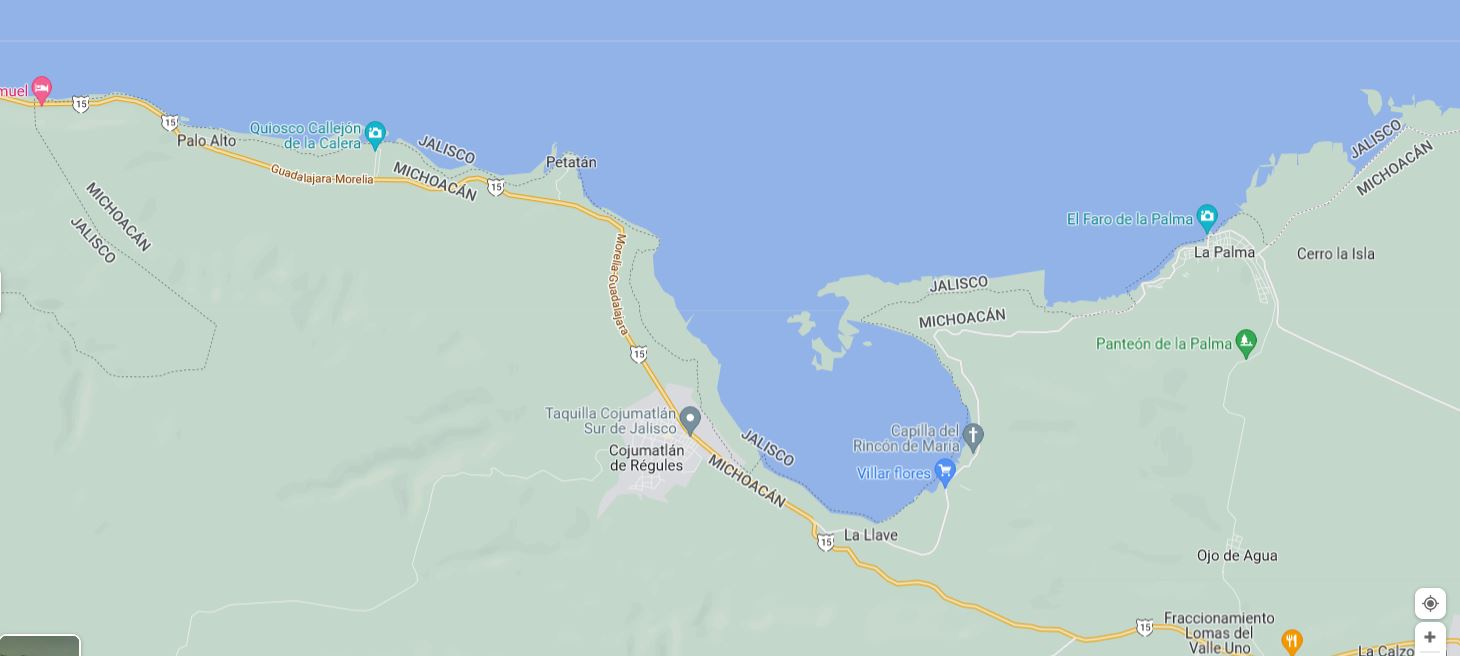
According to Google Maps, the entire southern shore of Lake Chapala belongs to Jalisco, not Michoacán . . .
– Según Google, toda la orilla sur del lago Chapala pertenece a Jalisco, no a Michoacán . . .

The south shore of Lake Chapala according to Google Maps (2022)

Google might want to alert Mexico’s mapping and statistics agency, INEGI, to that ‘fact.’

Google knows best? Not always!!

Aug 132015
 

Like many of our readers, we love looking at maps. It is always interesting to study maps compiled by cartographers working in different countries and different languages. It can also be a great way to learn some new words and phrases in a foreign language.

world-atlas-spanish

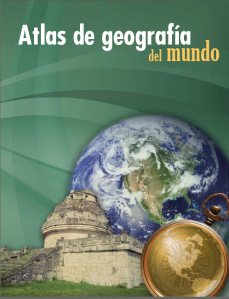
This latest resource is therefore well worth recommending. It is an outstanding Spanish language World Atlas, accessible online as a series of three pdf files:

The lavishly illustrated atlas was prepared by experts from the Geography Institute of Mexico’s National University (UNAM). It is aimed at high school students and the maps are complemented by carefully selected info-graphics and informative text.

Exploring these maps is a great way for native English speakers to improve their Spanish language geographic vocabulary!

Related posts:

 Tagged with:

Ground-breaking mapping of Mexico’s drug war

 Mexico's geography in the Press  Comments Off on Ground-breaking mapping of Mexico’s drug war
Jul 022015
 

During the 2006-2012 federal administration, it was possible to map the incidence of crime across the country, with data readily available at both the state and the municipal level. The current administration of President Enrique Peña Nieto has diverted press attention away from the drugs-related violence, arguing that press coverage only serves to give more publicity to the bad guys. Unfortunately, that decision means that it has now become next to impossible to get regularly updated data for, or be able to map, the patterns of criminal activity.

This is one of the inevitable caveats that limits the future application of the ground-breaking methods (using data from 2007 to 2011), developed by Jesús Espinal, a quantitative analyst at the National Institute of Genomic Medicine in Mexico City,and Hernán Larralde, statistical physicist at the National University (UNAM). Their work is described in “Mapping Mexico’s deadly drug war“, in Science magazine.

Mapping by Jesús Espinal Enríquez in Science magazine. Click to enlarge.

Mapping by Jesús Espinal Enríquez in Science magazine. Click to enlarge.

Essentially, they took official data for the location and date of all drug-related homicides in Mexico. They built a complex month-by-month network looking for temporal correlations in the homicide numbers between different cities. “If cities shared a death rate higher than 70 casualties per 100,000 inhabitants in a year and were less than 200 kilometers apart, Larralde and Espinal linked them together on their map to tease out broader geographical patterns.”

The results (summarized by the maps) are interesting. They show the rapid spatial spread of violence during the administration of Felipe Calderón as his government waged its war on drug cartels. The map for 2011 suggests that violence may have been finally becoming less widespread and becoming more focused on a relatively limited number of places.

Two major points are worth emphasizing. First (and as we have repeatedly pointed out in previous posts on this subject), the incidence of violent crime, including homicides, is certainly not similar across the entire country. Some states have much higher homicide rates than others; some municipalities have much higher rates than others. Some parts of the country, including several important tourist areas, have witnessed little or no drug-related violence.

Second, there is no evidence that the spread of violence between 2007 and 2011 occurred by continuous “contagious” diffusion (i.e. that it gradually spread from a single central point or a limited number of central points). The work of these authors supports the contention that the drugs-related activity in Mexico could, and did, increase simultaneously in cities far apart. This is only suggesting a coincidence in timing, and is certainly not proof of any causal connection. A small number of cities, such as Ciudad Juárez, Acapulco, Culiacán, Monterrey, Tampico and
Tijuana, appear as nodes in the network.

This approach may offer some help to policy makers as they consider alternative approaches to combating drugs-related violence, but, as the article makes clear, it does not necessarily mean that the best policy is to attack the cartels in the central hub cities. Aiming at the heart of a major cartel might reduce violence for a time, but could also lead to the formation of numerous smaller splinter groups with different ideals and methods. For example, after the leadership of the Gulf Cartel was dismantled in 2010, the cartel’s former enforcing arm, the Zetas took over, introducing a wave of more extreme violence.

Related posts:

Mar 302015
 

In a departure from our usual style, this post considers some of the more striking gifts available on the web that would surely please any Geo-Mexico fanatic. (Sadly, we do not receive any commission or recompense for making these recommendations, though we are always open to offers!)

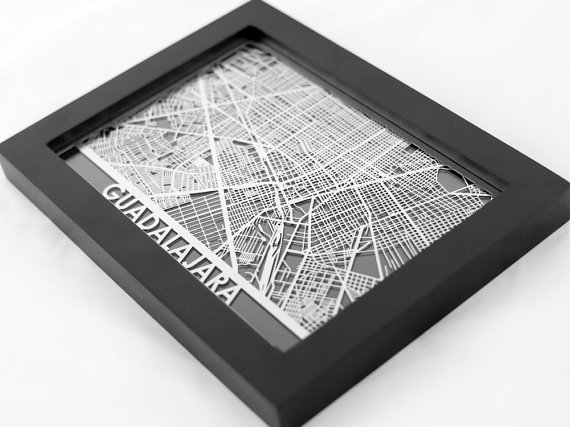
First up is this framed, 5″ x 7″ stainless steel laser-cut map street map of Guadalajara:

Stainless steel, laser-cut map of Guadalajara

Stainless steel, laser-cut map of Guadalajara

Next is this stunning Mexico City Map, by modern artist Jazzberry Blue, reproduced as a Giclée Fine Art Print:

Mexico City street map by Jazzberry Blue

Mexico City street map by Jazzberry Blue

This map is available in four sizes, 13″x13″ (includes a 1″white  border); 17″x17″ (includes a 2″ border); 22″x22″ (includes a 2″ border); and 28″x28″ (includes a 2″ border). There is a similar, though less colorful, map of Guadalajara.

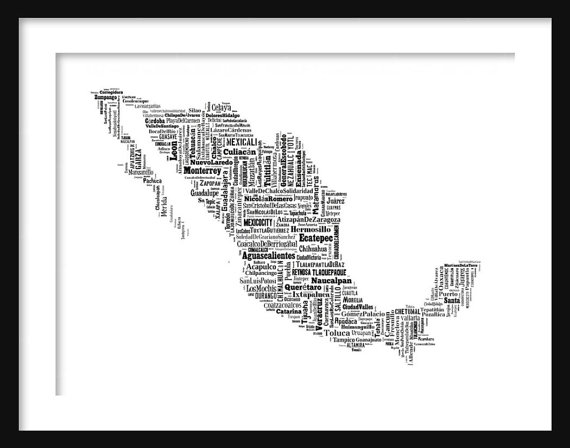
Alternatively, how about this Mexico typography map?

Mexico typography map

Mexico typography map

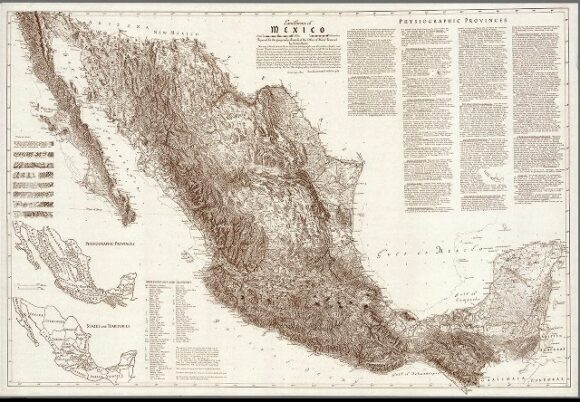
This more conventional Landform Map of Mexico, drawn by Erwin Raisz, is an absolute classic. Erwin J. Raisz (1893-1968) was an internationally renowned cartographer. The map is a hand drawn, pen and ink map, based on field observations and aerial photography.

raisz-map-mexicoThis incredibly detailed map is a bargain at $12 plus shipping, but is 28″ by 41″ in size and will cost you several times that to frame.

The online gifts site Etsy has many other arts and crafts maps related to Mexico. Which is your favorite?

 Tagged with:

Where are the mining concessions in Mexico?

 Books and resources  Comments Off on Where are the mining concessions in Mexico?
Feb 022015
 

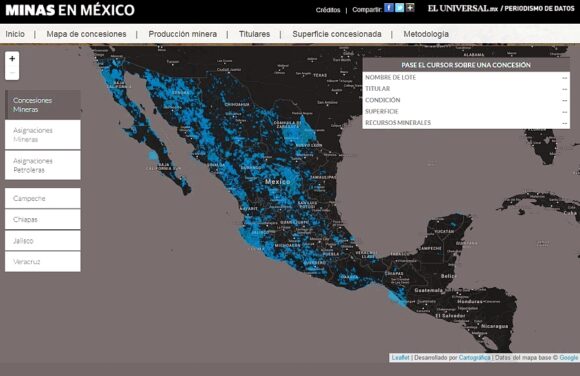
A series of graphics prepared by Mexico City daily El Universal includes a map showing the details of all the mining concessions in Mexico. According to the newspaper’s analysis, one fifth of Mexico’s total land area is subject to mining concessions belonging to one company or another.

The six companies holding the largest areas of concessions are:

  • Altos Hornos de México (364 concessions totaling 3208 hectares)
  • Fresnillo PLC (1009; 1953)
  • Industrias Peñoles (922; 953)
  • Minera Fresco (779; 889)
  • Cascabel (116; 749)
  • and Grupo México (711; 607).

The map is probably the single most interesting graphic in the series. Zooming in (top left of map) allows the details of each concession to be viewed, including the concession holder, size of concession, minerals involved and whether or not the concession is “active”. Is there a mining concession near you? You might be surprised. Even in an area of Mexico that I have known intimately for many years, there are two concessions that I have never previously heard of!

Related posts:

Raymond Craib’s “Cartographic Mexico, a history of state fixations and fugitive landscapes”

 Books and resources  Comments Off on Raymond Craib’s “Cartographic Mexico, a history of state fixations and fugitive landscapes”
Jul 192014
 

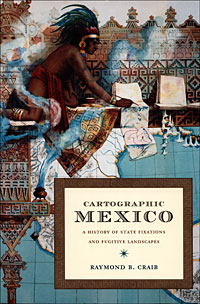
This book by Raymond Craib (Duke University Press, 2004) is one-of-a-kind. Craib combines archival analysis of mainly 19th century documents with perceptive comments on the relationships between history and geography in Mexico from the mid-19th century until about 1930.

craib-coverIn “Cartographic Mexico, a history of state fixations and fugitive landscapes”, Craib emphasizes the significance of map-making in post-Independence Mexico as a means towards furthering nationalism and as a development tool. He traces the changing motives of map-makers, focusing especially on the key area of Veracruz-Puebla which served as Mexico’s main gateway to Europe for centuries.

Craib considers why certain place names acquired more prominence than others, and examines a case study of a mining area where the granting of water rights hinged on precisely where a particular river flowed, and which tributary had which name, a case where cartographic ‘proof’ proved to be impossible and where a pragmatic solution was required.

This is an important study, with meticulous footnotes and bibliography.

“Cartographic Mexico, a history of state fixations and fugitive landscapes” is available via amazon.com

(Note: This short review was first posted on sombrerobooks.com)

Other books reviewed on Geo-Mexico.com:

New York Public LIbrary online historical maps of Mexico

 Books and resources, Maps, Mexico's geography in the Press  Comments Off on New York Public LIbrary online historical maps of Mexico
Jul 022014
 

A few months back, the New York Public Library (NYPL) announced that it was placing high resolution scans of more than 20,000 cartographic works online. The NYPL also asserted that it believed that “these maps have no known US copyright restrictions” and that it “is distributing these images under a Creative Commons CC0 1.0 Universal Public Domain Dedication.”

The maps can be viewed and downloaded via the New York Public Library’s Digital Collections page, and the NYPL Map Warper.

Naturally, this piqued Geo-Mexico’s interest, and we spent several enjoyable hours browsing the various maps included in this online treasure-trove that have some relation to Mexico. A search for “Mexico” yielded 36 maps, though this number included many that depict New Mexico.

seller

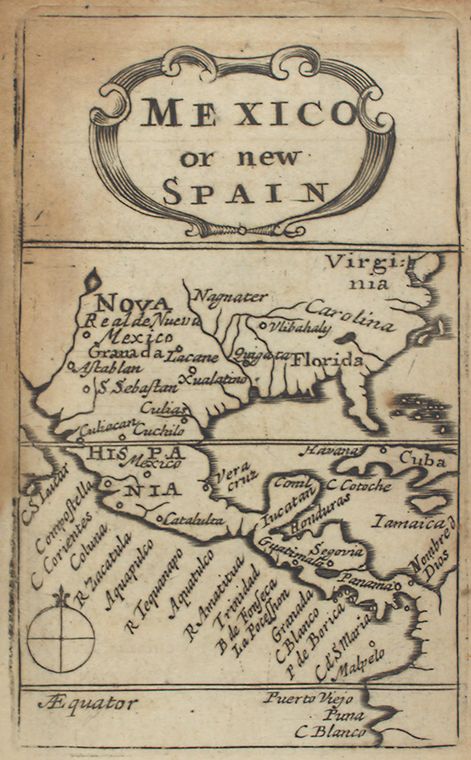
This 1679 map “Mexico, or, New Spain” (above) comes from “Atlas minimus, or, A book of geography : shewing all the empires, monarchies, kingdomes, regions, dominions, principalities and countries, in the whole world”, by John Seller.

Far more detailed, and a more recognizable shape emerged by 1713, with the publication of Mexico, or, New Spain : divided into the audiance of Guadalayara, Mexico, and Guatimala, Florida, from “System of geography with new maps”.

Carey's 1814 map.

Carey’s 1814 map.

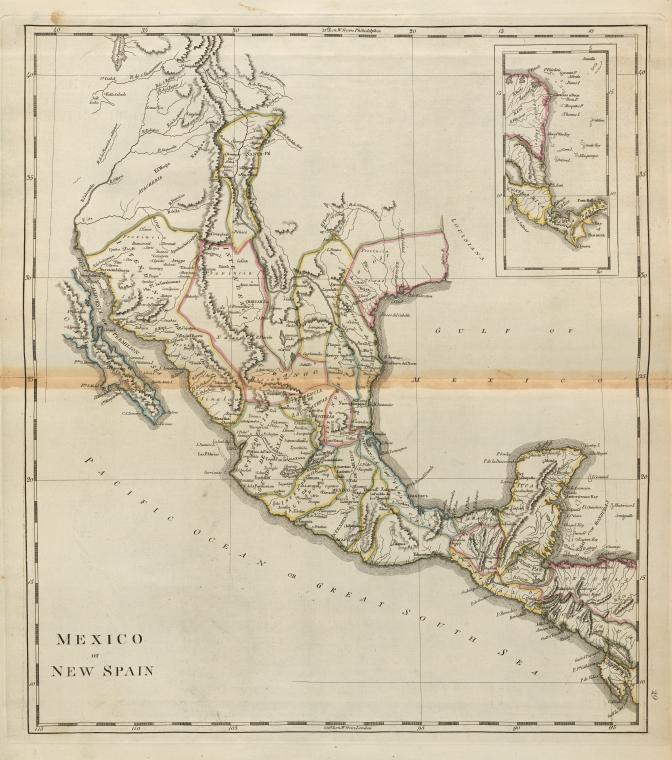
This 1814 map “Mexico of New Spain” (above) is part of “Carey’s general atlas, improved and enlarged : being a collection of maps of the world and quarters, their principal empires, kingdoms, &c.”

From the mid-nineteenth century, the maps become very much like modern-day atlas maps. For example, this 1876 map, “Mexico; Mexico to Vera-Cruz; The Isthmus of Tehuantepecfrom the “New illustrated atlas of Dutchess County, New York. / Compiled & drawn from personal examinations, surveys etc. under the personal supervision of O.W. Gray & Son and F.A. Davis, and published under the superintendence of H. L. Kochersperger”.

Related posts:

Apr 032014
 

Geo-Mexico agrees entirely with Joseph Kerski (a key member of ESRI’s Education Team), that it is amazing “how little American students really know about their neighbor to the south.” In order to help remedy this situation, ESRI’s Witold Fraczek has created a series of online “story maps” about Mexico. The maps can be accessed in several different ways, including as an ArcGIS Online presentation and an iPad iBook, or via this webpage.

The six stories are entitled:

Each “story” includes several maps (covering topics such as population, landforms, climate, historical landmarks, caves, indigenous cultures, tourist attractions), some of which are interactive in the sense that clicking on a marked point brings up a pop-up panel with a photograph and/or additional information about that place. The maps, linked by short commentary notes, can be viewed at a variety of scales.

This series of maps has many strong points, and could certainly be useful in some geography classes, but it also has some weaknesses that should be taken into account when using them. Brief comments follow on each of the six stories.

1 Explore Mexico (Crime vs. Tourism)

The first map in this mini-series depicts “tourism attraction density” based on “650 major points of interest”. No clues are offered as to how the 650 points were selected, and indeed, some can not really be shown by points on a map since they cover larger areas. The map appears to weight all 650 points equally, though some are major, major tourist attractions (like the pyramids of Teotihuacan) that attract thousands of visitors a day, while others are very much less significant.

The second map, showing the “20 cities with most murders” uses data from 2011 (now out-dated) to conclude that “crime, measured by the total number of murders” appears to be “spatially isolated from the areas most attractive to tourists”. Surely murder rates (per 100,000 people) are a better measure than the number of murders in each city?

Murder rate per 100,000 is used as the basis for comparing Mexico with its regional neighbors, but Mexico is so large (and the murder rates across the country so varied) that comparisons at this scale mean relatively little, especially when some of the nations are tiny Caribbean islands, where one or two murders extra in any year can mean a significant spike in their murder rate.

2. Mexico’s Natural Wonders

The introductory text to this section rightly highlights how “the natural world of Mexico varies amazingly, from tropical jungles and coral reefs to deserts and glaciers.”

However, the statement that “Central Mexico is home to billions of Monarch Butterflies, whose 2 year /4 generation long trip to Canada and back amazes both scientists and the general public” is misleading. First, there may be millions of Monarch Butterflies, but there are not billions. Secondly, not all Monarch Butterflies migrate. Thirdly, those that do migrate are part of an annual (1 year) cycle involving 4 or 5 generations, not a two year cycle.

The text later claims that the Monarch Butterfly reserves “are located on old volcanic hills covered with pine-oak forest”. Actually, they overwinter in pine-fir forests. Mexico’s pine-oak woodlands occur only at much lower elevations.

The only birds incorporated into Mexico’s “biological wonders” are its pink flamingos, yet there are dozens of other bird species that are equally worthy of inclusion. Fortunately, the texts accompanying the maps of caves and cenotes (sinkholes), waterfalls, volcanoes, canyons and geologic sites appear to be much more accurate.
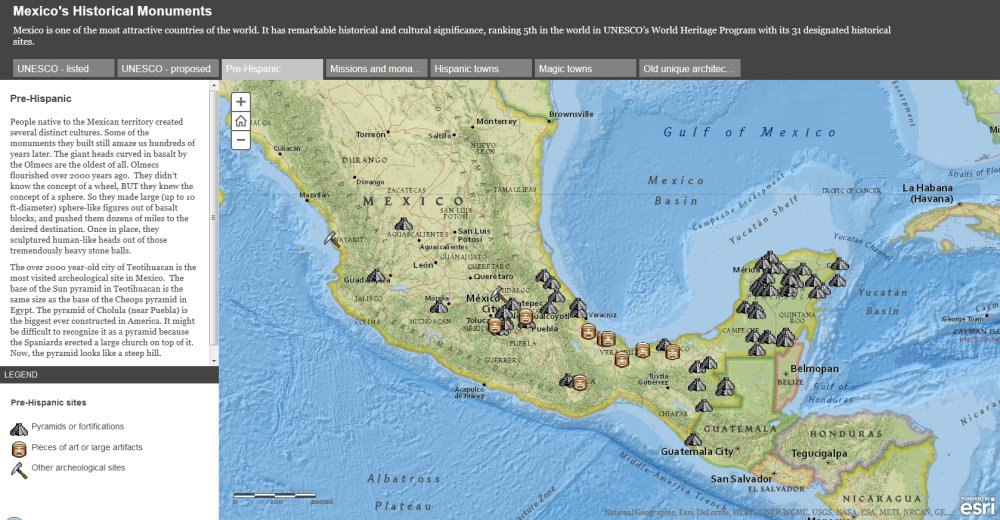
Screenshot from ESRI's story maps of Mexico.

Screenshot of ESRI’s story maps of Mexico.

3. Historical monuments

This section includes a useful map of Mexico’s World Heritage sites, though absent (from both the declared sites and the proposed sites) is the El Pinacate and Gran Desierto de Altar Biosphere Reserve in Sonora, which in June 2013 became Mexico’s 32nd World Heritage Site.

The great weakness of the maps of “archaeological sites” and “missions and monasteries” is that no clues are given as to how and why particular locations were selected for inclusion. This leads to some anomalies in the distribution. For example, Oaxaca is almost a no-show for “missions and monasteries” according to the map, despite such buildings being the subject of an excellent and extensive book by Richard Perry published as long ago as 2006, Exploring Colonial Oaxaca: The Art and Architecture.

The map of Magic Towns is also a useful map, though many more towns have been added to the list since 2012.

4. Geography of Mexico – Did You Know?

This series of maps will be quite useful to many classes as a quick way to introduce the basic physical and settlement geography of the country. Maps of relief and precipitation are accompanied by one of time zones and a simple map of states (though these are not named on the “map story” version) and major cities.

The introductory text to this section claims that “the array of Mexican volcanoes stretches along the same latitude as the volcanoes of Hawaii. Analogously, those located at the eastern ends are the newest and highest.” This may be true for Hawaii, but is not the case for Mexico. There is no simple pattern to the heights of Mexico’s major volcanoes, and certainly those in the east are not significantly younger than those in the west.

5. Indigenous People of Mexico

The single map in this section attempts to show the location of about 25 of Mexico’s many indigenous groups. The colors chosen for each group are in many cases confusingly similar, though the names of each group do appear as you zoom in on parts of the map.

The introductory text makes a strong case for Mexico’s attractiveness to tourists, yet concludes with the strange (and unanswered) question, “So why isn’t Mexico a major tourist destination?” Mexicans would beg to differ. Mexico is a major tourist destination. In 2013, for example, it received 23.7 million international visitors who spent 13.8 billion dollars. In fact, Mexico is ranked #11 in the world in terms of tourist arrivals (and that number excludes the 70 million or so border tourists each year).

6. Cartograms of Mexico

The cartograms in the last section certainly add interest to the map stories, but the basis of the “travelers attractiveness” map (those 650 tourist attractions again) means that the map is not a very good reflection of tourist numbers across the country. The significance of the State of Mexico is greatly exaggerated, while states such as Quintana Roo (with the resort of Cancún) and Baja California Sur (with Los Cabos) fail to stand out.

The final “fictional map” purports to portray Mexico as perceived by Californians. Based on the author’s personal impressions, in some ways this is the single most interesting map in the entire collection!

All in all, these maps are a mixed bag. The idea behind them is great, as is the decision to produce them in a flexible GIS system. If the details were refined a little, and more explanation offered about the basis for selecting places for inclusion, they would be even more useful in geography classes, and might go some way towards helping American students gain a better appreciation for their southern neighbor.
Early maps of Mexico

 Books and resources  Comments Off on Early maps of Mexico
Jun 152013
 

If you find maps, especially old maps, as fascinating as I do, you’ll enjoy reading the chapter on “Mesoamerican Cartography” (link is to pdf file) in the University of Chicago’s History of Cartography. In this wide-ranging chapter, author Dr. Barbara Mundy explores many aspects of Mesoamerican Cartography, from the different styles and materials used to the subtle changes that followed the arrival of the Spanish conquistadors in the sixteenth century.

The chapter has numerous illustrations of early maps, as well as an interesting diagram showing some of the regional and ethnic differences in the pictographs used to depict common geographic features such as hills, fields, sources of water and stones.

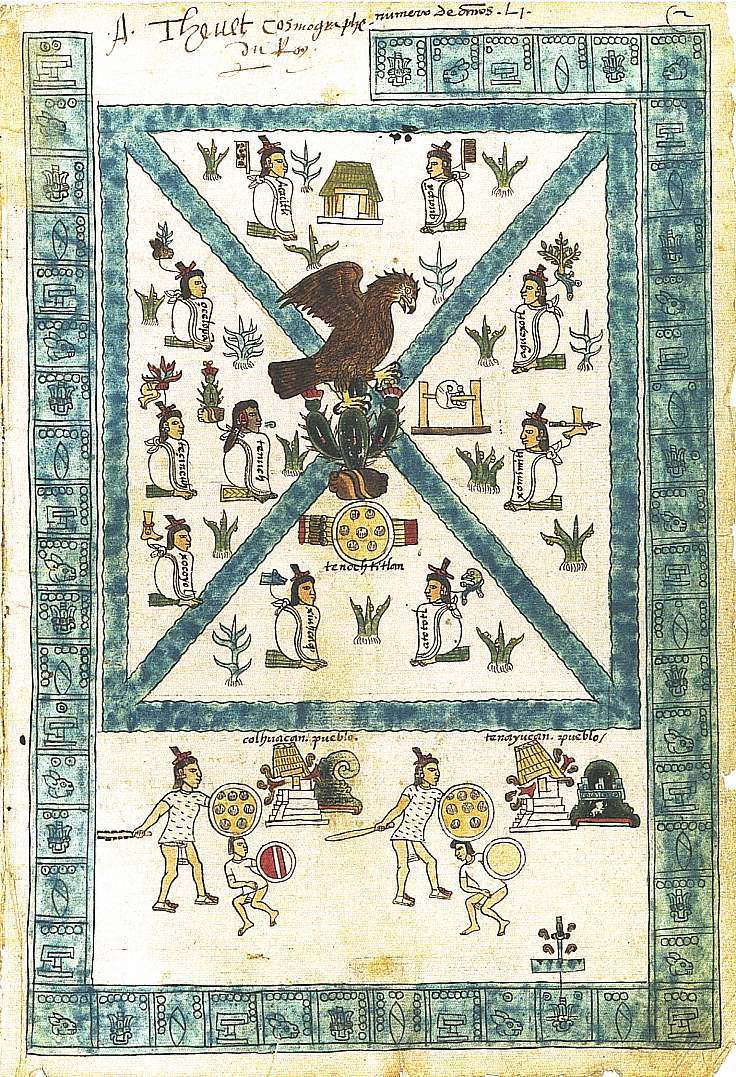
This image shows a page from the Codex Mendoza depicting the Aztec capital Tenochititlan.

Codex Mendoza

Codex Mendoza

The map, thought to have been painted in 1541, shows the founding of Tenochtitlan (by the Mexica) in 1325 (this date is shown by a symbol for a house crowned by two dots in the upper left hand corner). The glyphs around the edge of the map show the passage of time. The central illustration shows Tenochtitlan, dominated by a blue X, marking the four canals that divided the city both geographically and socially. Around the four quadrants sit the ten original founders of the city. Their leader, Tenoch, is seen immediately left of center. The hieroglyphic place-name for Tenochititlan, in the middle of the page, at the juncture of the canals, is a stone with a cactus growing out of it. (Description based on caption in History of Cartography).

On top of the cactus sits a bird of prey (popularly thought to be an eagle, but more probably a Crested Cara-Cara), the sign that the Mexica believed would tell them where to found their new city.

“Mesoamerican Cartography” is chapter 5 of Volume Two, Book Three (“Cartography in the Traditional African, American, Arctic, Australian, and Pacific Societies”) of the History of Cartography. The first volume of the History of Cartography was published in 1987 and the three books that constitute Volume Two appeared over the following eleven years. The University of Chicago Press website has links to a series of pdf files for the first three volumes of the History of Cartography (each chapter is a separate pdf).

Related posts:

Using Google to map areas influenced by drug cartel activity

 Mexico's geography in the Press  Comments Off on Using Google to map areas influenced by drug cartel activity
Nov 282012
 

The area of influence of each individual drug cartel in Mexico is far from fixed. As cartels fight each other (and government forces) to control their markets, the cartels’ areas of influence expand and contract. This inevitably means that conventional maps of drug cartel “territories” are only a snapshot, each valid only for a limited time. Territories change so rapidly that it is seemingly impossible to keep up.

Two Harvard graduate students have now shown how Google can be used to derive maps of cartel influence. In How and where do criminals operate? Using Google to track Mexican drug trafficking organizations, Viridiana Ríos and Michele Coscia use an algorithm called MOGO (Making Order Using Google As an Oracle) and show how Google data can be processed into maps and graphs.

The method is a much faster, and lower-cost alternative to the sophisticated intelligence and research techniques employed by private security consultants and research institutes.The new approach suggests that different drug groups operate in quite different ways.

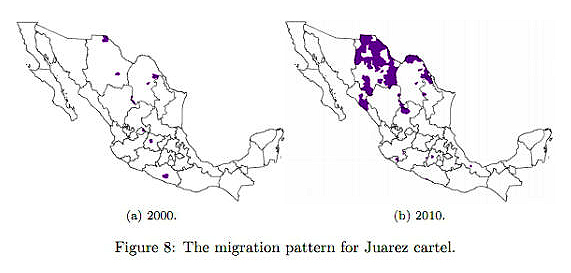
Coscia & Ríos, Figure 8: Changing pattern of Juárez cartel

Coscia & Ríos, Figure 8: Changing pattern of Juárez cartel

The spatial patterns related to the activity of each cartel show distinctive peculiarities. For instance, the longer-established cartels, including the Juárez cartel (see graphic) and Sinaloa cartel, “have a tendency towards being not competitive, being most of the time the first to operate in a particular territory. They operate in a large number of municipalities but also have a high turn over.”

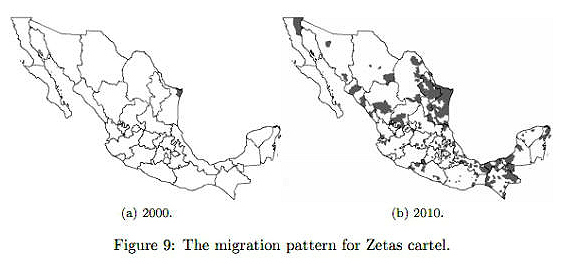
Coscia & Ríos, Figure 9: Changing pattern of Zetas

Coscia & Ríos, Figure 9: Changing pattern of Zetas

On the other hand, newer groups such as the Zetas  (see maps) are “Expansionary competitive”, being both highly competitive and very willing to explore new territories.”In other words, they not only try to invade others’ territories but also are the first to colonize new markets and to operate in areas where drug tracking organizations had never been present before.” By mid-2012, the Zetas operated in 324 municipalities. They were adding “an average of 38.87 new municipalities every year”. However, they also “abandon an average of 22 municipalities per year, lasting an average of only 2.86 years in each one of them.”

These findings appear to lend support to the view that, even in the worst-hit areas, the violence related to cartel activities does not last indefinitely. Indeed, the latest homicide figures from Ciudad Juárez and many other northern border areas show a significant improvement from a year or two ago. Hopefully, the new administration will continue to make progress in tackling the violence. According to press reports, Enrique Peña Nieto, whose six year term as President starts 1 December, will focus his public security policies on reducing Mexico’s homicide rate, as well as reducing the rates of kidnapping and extortion.

Related posts:

A matter of scale: Mexico compared to Spain

 Other  Comments Off on A matter of scale: Mexico compared to Spain
Mar 262012
 

Scale matters, especially when two countries or regions are going to be compared. A case in point is depicted on this Mexican airmail stamp from 1977 issued to celebrate the resumption of diplomatic relations between Mexico and Spain. Mexico had broken off relations with Spain in 1939 at the end of the Spanish Civil War when Francisco Franco gained control. Following that war, more than 30,000 Spaniards sought refuge in Mexico, giving a significant boost to the country’s entrepreneurs. It took until 28 March 1977 for diplomatic relations between Mexico and Spain to be restored.

The outline maps on the stamp show Mexico and Spain as having approximately the same area. Presumably this was to ensure that the stamp would be seen as politically-correct, even if not spatially-correct, and would make the two countries look like equal partners. In real life, or on any equal-area map projection,  Mexico (almost 2 million square kilometers) is about four times as large as Spain (close to 50,000  square kilometers).

If the maps were drawn proportional to population, then Mexico would be more than twice as large, since its population of about 112 million (2010) is more than double that of Spain (48 million in the same year). This difference is widening with the years, since Spain’s population growth rate has fallen to about 0.6%/year, while Mexico’s (which has also fallen) remains significantly higher at about 1.1%/year.