Mexico’s GDP and position among the world’s largest economies, 1800 to 1900

 Other  Comments Off on Mexico’s GDP and position among the world’s largest economies, 1800 to 1900
Jun 302012
 

Comparing the historical sizes of national economies is extremely challenging. This post relies on data from Gapminder which has attempted to do this for all the countries in the world for the period since 1800. Gapminder’s approach relies on first obtaining for each country historical population size and Gross Domestic Product per capita (GDPpc; for more details, see Standard of living in Mexico since 1800: some international comparisons) and then multiplying these to obtain the GDP. To obtain historical measures of population and GDPpc, Gapminder relies on quantitative and qualitative data from hundreds of official and unofficial documents and a number of carefully documented assumptions. In some cases they admit that some of their numbers for years before 1900 are essentially well-educated “guesstimates”. [Full details are given in the pdf file “Documentation for GDP per capita by purchasing power parities“.]

Though the Gapminder data have limitations, they are about the best source for comparing the GDP growth of Mexico since 1800 with that of other large economies. The Gapminder GDPpc data are adjusted for inflation by using constant 2005 US dollars. They are also based on Purchasing Power Parity (PPP) which measures total goods and services produced by an economy independent of exchange rates.

During the 19th century Mexico’s total GDP grew at a relatively unimpressive 1.3% per year, which was only about 0.5% above population growth. In 1800, Mexico’s estimated GDP was just over $6 billion, ranking it second in the Americas. Though this was almost nine times the GDP of Canada, and 3.6 times that of Brazil, it was less than that of Nigeria and half that of the USA. China had by far the largest GDP in 1800 at about $290 billion, more than three times the GDP of second place India, over seven times that of Japan and the large European countries (France, Germany and the UK) and over 20 times that of the USA. The table below shows the estimated GDP levels from 1800 to 1900 for some of the world’s current largest economies.

Estimated total GDP of large economies, 1800 to 1900

(GDP in billions of constant 2005 US dollars based on Purchasing Power Parity)

Country1800182018701900Growth/yr, 1800-1900
Brazil1.72.47.010.31.8%
Canada0.71.19.323.13.6%
China286.9328.8279.1320.90.1%
France38.447.1113.5167.31.5%
Germany36.048.5113.2254.72.0%
India91.098.2118.8nana
Indonesia8.39.316.026.31.2%
Italy23.629.344.671.61.1%
Japan31.133.639.676.60.9%
MEXICO6.17.39.123.31.3%
Russia25.626.2nanana
UK34.945.4151.3240.12.0%
USA12.720.1261.3506.03.8%

From 1800 to 1820, just before gaining independence, the Mexican economy grew to $7.3 billion at a sluggish rate of about 0.9% per year. In contrast, Canada and the USA expanded at around 2.3% per year while Brazil’s GDP went up about 1.9% per year. Germany, France, UK and Italy grew at roughly 1.0% to 1.5% per year. The major Asian countries–China, India, Japan and Indonesia–only managed 0.4% to 0.7% per year. The Russian economy essentially stagnated during the 20 year period. China maintained the top position with over three times the GDP of India and over six times those of the large European economies.

By 1870, Mexico’s GDP had inched up over $9 billion growing rather slowly at just over 0.4% per year since 1820; this was slower than the population growth rate. While Mexico’s growth rate was better than the three biggest Asian economies, it severely lagged behind its northern neighbors which grew very rapidly based on industrialization and immigration. Canada’s economy expanded by an impressive 4.4% per year and edged past Mexico. The USA did almost as well at 4.2% per year to move into second place behind China, which declined by a surprising 0.3% per year over the fifty year period. (In China both GDPpc and population declined from 1820 to 1870.)

Brazil grew by a solid 2.1% per year and closed the gap with Mexico. The three largest European economies were also industrializing and grew by roughly 1.7% to 2.0% per year, but they were still overtaken by the USA. While Indonesia’s GDP expanded by about 1.1% per year, growth rates for Japan and India were less than 0.4% per year.

From 1870 to 1900, under the Porifiro Diaz regime, Mexico’s economy grew rapidly at about 3.2% per year up to $23.3 billion. This put Mexico just ahead of Canada which grew slightly more slowly at roughly 3.1% per year. Mexico’s estimated GDP in 1900 was just behind that of Indonesia but over twice that of Brazil which slowed to 1.3% per year. The USA sped ahead at 3.9%. In the early 1880s it became the world’s largest economy by overtaking China which grew slowly at less than 0.5% per year. In 1900 China’s estimated GDP was actually less than it had been 80 years earlier in 1820. By 1900 the USA’s estimated GDP was over $500 billion, about 22 times that of Mexico. Germany grew at an impressive 2.7% per year becoming Europe’s largest economy by moving past the UK which grew at 2.2%, about the same rate as Japan. Growth in France and Italy was significantly slower.

During the full 19th century, Mexico almost quadrupled its GDP but its overall economic performance was fair at best. Its growth rate of just over 1.3% per year was better than the Asian countries which performed poorly during the century. The USA registered a very impressive 3.8% growth per year resulting in a fortyfold GDP increase. Canada was a close second with 3.6% per year and a 34-fold increase. Germany and the UK had seven-fold increases with growth rates near 2.0%, followed by Brazil at 1.8% growth per year. France followed with growth averaging just under1.5% per year. Though these Gapminder GDP levels have some limitations, they do give a pretty good indication of relative historical economic sizes and growth rates.

Mexico’s economic performance was much better in the 20thcentury as was that of all major world countries. A future post will focus on economic growth since 1900.


Ever wondered how ropes are made? A photo essay about Villa Progreso, Querétaro

 Other  Comments Off on Ever wondered how ropes are made? A photo essay about Villa Progreso, Querétaro
Jun 282012
 

This account of the rope-making industry in the small village of Villa Progreso in the state of Querétaro, is based on information collected during numerous student interviews conducted in the village in the 1980s.

Villa Progreso in the 1980s

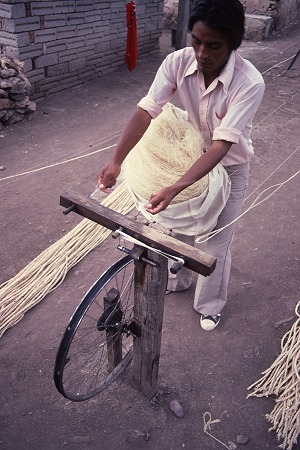
Preparing to start. Rope-maker starts to twist the strands.

Preparing to start. Rope-maker starts to twist the strands.

Villa Progreso is nestled in the hills at the end of a road, east of the town of Ezequiel Montes. The rocky soil is not very fertile, and water is in short supply, so agricultural production is limited, though maguey plants grow well here, even when neglected. The local maguey plants used to supply the raw material for rope-making, the main “secondary” occupation in the village.

However, as the village’s population increased, and as more and more families became dependent on rope-making, another maguey product, ixtle de henequen (henequen fibers), had to be trucked in as the raw material from other states, in particular from Yucatán and Tamaulipas.

The trucks are either rented by the villagers or supplied by the village “distributors” (who eventually buy the finished ropes from the village). About 40 metric tons of henequen are needed each week to keep the rope-makers supplied.

In the 1980s (all monetary figures are from that time), raw henequen was bought by the distributors for about 50 pesos a kilo, and then resold to the villagers at about 95 pesos a kilo. The distributors are “middle men” who, in the words of one student, “make a lot of money doing nothing” and “live in the largest, most expensive homes in the village.”

Once the villagers have purchased a supply of henequen, they perform the various tasks to turn it into ropes. The first step is to “comb” it to make fine fibers and to clean the henequen.

The fibers are then shaken in the wind to further separate them before being stored in a large sack. The ends of the top fibers are then tied onto three wires (see first photo). These wires are made to spin by a wheel.

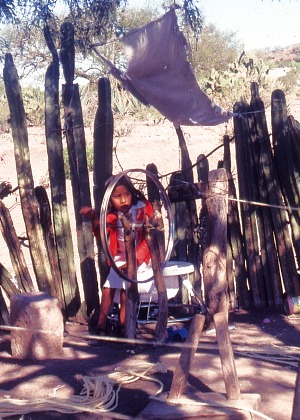
This is often an old bicycle wheel. Some villagers turn the wheel themselves as they walk backwards feeding fibers onto the wires, via a rope that is wound over the wheel; others rely on children or family members to turn the wheel.

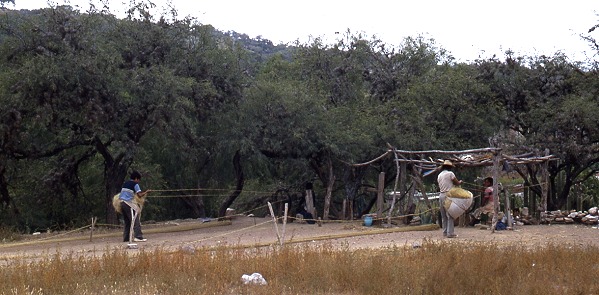
The rope gets longer... and thicker...

The rope gets longer… and thicker…

As the person carrying the sack walks backwards, they continue to feed the three strands of fiber, gradually creating three fine strands of rope. The spinning process is repeated, using the fine strands as the basis, and the rope can be made as thick as you like by successive spins.

The entire family helps

The entire family helps (note cloth tied as sunshade)

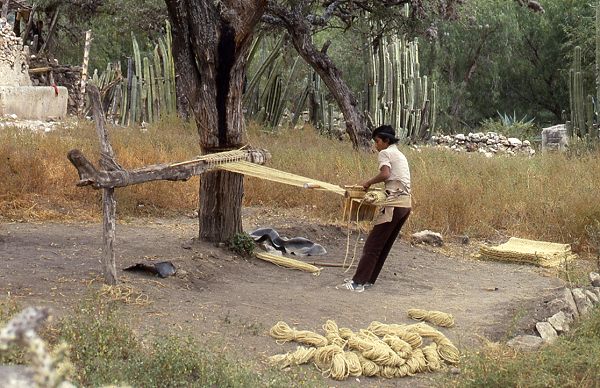
The main output from this system is strands of rope of various thicknesses, used for things such as clothes lines. Short strands of henequen are not wasted, but formed into natural cleaning pads.

The work is done by the entire family. One worker pointed out that “it is better to have a large family as like this all can work for each other”. Any workers who have no family have to hire extra workers and are unlikely to make any profit.

On a good day, one family can produce about 72 ropes, each about 5 meters long, which can be sold for around 1800 pesos. However, it takes about 1 kilo of henequen to make 7 or 8 ropes, so the family only makes about 800 pesos [about 5 dollars at the then exchange rate] a day after they have paid for the “raw” henequen. The average family size, including children, in the village was between 5 and 6 individuals. 800 pesos a day is not much income to support the entire family!

The finished ropes are bought by the distributors, who in turn sell it on to other distributors in other places, and so on. The main markets are Mexico City, where about 90% of these ropes are eventually sold.

The workers in the rope-making industry in Villa Progreso have tried to organize themselves, but with only limited success. For example, three years before the interviews, they had formed a cooperative, but decided to quit the group when they realized that the managers of the cooperative also wanted part of the profits. So, at the time of the interviews, they had returned to working independently without any outside help.

Sales of rope fluctuate with the economy, and also seasonally, with the highest demand during the rainy season, partly because these natural fiber ropes tend to disintegrate more quickly during damp conditions.

The final stage, with finished ropes

The final stage, with finished ropes

As one student concluded, “It is very visible here how the middle men (distributors) take advantage of the cheap labor available and make a large profit by only buying and selling raw materials and by buying and selling finished products. thus, the distributors are getting richer by exploiting the workers and the workers are remaining as poor or getting poorer than before. The workers have been pulled into a situation that they can not easily escape from.”

How have things changed since the 1980s?

Sadly, I haven’t had the chance to return to Villa Progreso since then, but things appear to have changed considerably. Newspaper accounts such as “Artesanos dan nuevo aire al ixtle” (“Artisans give new life to Ixtle”), which appeared in the national daily El Universal in 2008, suggest that the residents of Villa Progreso are now emerging from some very hard times.

The price of natural fiber ropes could not compete with cheaper plastic alternatives and the rope-making industry went into near-terminal decline. Many of the able-bodied young men left to look for work north of the border. A small number (mainly the older inhabitants) remained home and continued to make ropes by hand for the limited market that remained for their products.

Now, though, a new industry has arisen based on the henequen fibers (usually known simply as ixtle). Enterprising villagers have turned their hands to fashioning nativity scenes and decorative items out of ixtle. Isaías Mendoza Guzmán is described in the article as making pieces that are more than two meters tall and take three months to complete, clearly indicating a high level of sophistication in the final product.

Villa Progreso now holds an Ixtle and Nopal Fair (Feria del Ixtle y el Nopal) towards the end of April each year in the La Canoa “ecotourism park”.

Villa Progreso is by no means the only place in Mexico where rope-making is an important activity. Similar rope-making methods are used elsewhere in Mexico. For example, John Pint describes in “Mexican artisans of Lake Cajititlán” how rodeo-quality lariats are made in the village of San Miguel Cuyutlán, near Guadalajara. Demand for these high-end products apparently remains strong.

Photo credit:

All photos in this post are by Tony Burton; all rights reserved.

How to get there:

Villa Progreso is about 10 km east of the town of Ezequiel Montes in Querétaro. From Mexico City, take the Querétaro highway (Hwy 57D) north-west to San Juan del Río. Then take Highway 120 past Tequisquiapan to Ezequiel Montes. Once in the town, turn right for the road to Villa Progreso. Allow 2.0 to 2.5 hours for the drive.

Related posts about the same general area:


Founder of Grupo Ecológico Sierra Gorda honored by National Geographic

 Mexico's geography in the Press  Comments Off on Founder of Grupo Ecológico Sierra Gorda honored by National Geographic
Jun 252012
 

Mexican environmentalist Martha “Pati” Isabel Ruíz Corzo has been awarded the 2012 National Geographic/Buffett Award for Conservation Leadership in Latin America.

The press release from the National Geographic summarizes a lifetime’s dedication to the Sierra Gorda region of the state of Querétaro:

Martha “Pati” Isabel Ruiz Corzo founded Grupo Ecológico Sierra Gorda (GESG), a local grassroots organization, with her husband and local residents in 1987 to rescue the Sierra Gorda bioregion in Mexico from the destruction of unregulated development. GESG has set the standard in Mexico for a “conservation economy,” establishing a new paradigm in natural protected area management with widespread local community participation.

GESG is a living model of community-based conservation management. Thanks largely to GESG’s efforts and Ruiz Corzo’s leadership, the Sierra Gorda — comprising a third of Mexico’s Querétaro State and considered the area with the most ecosystem diversity in Mexico — is now a UNESCO and federal Biosphere Reserve and is the largest federal protected area with participatory management in the world. It spans 1 million acres, and its 35,000 residents own 97 percent of the Reserve’s territory.

Ruiz Corzo’s efforts to include local communities in the management of the Reserve make her a pioneer in the conservation field. Her leadership has created opportunities for rural, low-income communities in the areas of ecotourism, reforestation, soil restoration, ecological livestock management and other profitable microenterprises.

Over the past 25 years, GESG has organized environmental education for the community members, who regularly take part in clean-up campaigns, solid waste management, soil restoration and other conservation activities. Community volunteers operate 115 recycling centers. Thanks to the residents’ stewardship of the Reserve, more than 13,000 hectares of regenerated forest and woodland has been recovered over 15 years.

Ruiz Corzo and her team have developed online and on-site courses that allow others to replicate the GESG model, which is now being applied beyond the borders of Mexico.

Ruiz Corzo also has pioneered the concept of valuing the “natural capital” of the region — the Sierra Gorda has been validated by the Rainforest Alliance and is the first forest carbon project to achieve this milestone in Mexico.

The Sierra Gorda Biosphere Reserve covers 383,567 hectares of the state of Querétaro. Eleven core protected areas have a combined area of 24,803 hectares with 358,764-hectares of buffer zone surrounding them. The reserve is home to about 100,000 people (including cattle ranchers, seasonal farmers and forestry workers) living in 638 settlements in five municipalities:

  • Jalpan de Serra
  • Arroyo Seco
  • Landa de Matamoros
  • Pinal de Amoles
  • Peñamiller

The reserve is ecologically diverse, with a large number of distinct ecosystems; it is one of the most biodiverse areas in central Mexico. The major reason for such diversity is that the reserve straddles the Nearctic and Neotropical bio-regions. It ranges in altitude from 300 meters above sea level to more than 3,000 meters. The reserve has 14 distinct vegetation types, home to 6 feline species (including the jaguar) and 334 bird species.

Forestry is controlled, but illegal logging persists, especially on the fringes of the reserve.

Out-migration has reduced population pressures on the reserve, and remittances have helped raise household incomes, so decreasing local demand for wood as fuel in favor of gas.

Related posts:

Standard of living in Mexico since 1800: some international comparisons

 Other  Comments Off on Standard of living in Mexico since 1800: some international comparisons
Jun 232012
 

Comparing historical standards of living for different countries over long periods of time is extremely challenging. This post relies on data from Gapminder which has attempted to do this for all countries in the world since 1800. Their approach relies on quantitative and qualitative data from hundreds of references and a number of carefully documented assumptions. They obtained input from a very wide range of official and unofficial documents and combined these to come up with their best estimates. In some cases they admit that some of their numbers for years before 1950 are essentially well-educated “guesstimates”. [For more details, see “Documentation for GDP per capita by purchasing power parities” (pdf file).]

Though the Gapminder data have some limitations, they are about the best source for comparing standards of living in Mexico since 1800 with a number of other middle income countries. The measure of standard of living used in this post is the Gapminder indicator of Gross Domestic Product per capita (GDPpc) at constant 2005 US dollars based on Purchasing Power Parity (PPP) which measures total goods and services produced by an economy independent of exchange rates.

The data indicate that Mexico’s GDPpc has grown over eleven-fold since 1800 from over $1,000 to almost $12,000. This increase sounds very impressive but actually represents an average annual increase of under 1.2% per year. The eleven-fold increase demonstrates the power of compounding. The growth has not been constant. During the 19thcentury Mexico’s GDPpc actually decreased slightly up until 1870, but then expanded relatively rapidly under the Porfirio Diaz regime, almost doubling between 1870 and 1900. For the century as a whole it increased an average of about 0.5% per year. The rate of increase more than doubled during the first half of the 20th century to 1.2%. It doubled again to 2.5% during the second half of the 20th century, which included the so-called “Mexican Miracle”, which started in the 1940s. After 2000, as a result of the very severe recession in the USA, Mexico’s growth slowed to 0.6% per year for the period 2000-2011. Growth is expected to increase significantly during the present decade.

Income growth in Mexico since 1800 (Gapminder data) 

(Incomes values are at constant 2005 US dollars based on Purchasing Power Parity)

Country18001900195020002011Growth/yr, 1800-2011
Argentina8724,0116,32310,77114,5951.3%
Brazil5095981,9047,81910,1921.4%
Chile7022,3063,61210,10613,6111.4%
China9868024272,7847,9311.0%
Cuba1,124na4,9585,8249,4691.0%
India5635855881,6072,9720.8%
Indonesia5146046662,6273,9991.0%
Iran7501,3472,8168,26011,6661.3%
South Korea59667070815,69225,2561.8%
MEXICO1,0541,7223,07410,35911,7541.2%
Peru6979963,2895,7058,4201.2%
Russia824nana7,79214,3181.4%
South Africa759na4,7667,3349,2841.2%

The table compares the 1800 to 2011 GDPpc of Mexico with 12 other middle and low income countries. In 1800, Mexico was ahead of all other countries in the table except Cuba. By 1900, Argentina had moved past and its GDPpc was more than double that of Mexico. Argentina’s GDPpc growth rate for the 19thcentury was over three times that of Mexico. Chile also moved ahead of Mexico. On the other hand, Brazil grew very slowly at only about 0.2% per year during the century; it actually declined between 1870 and 2000. By 1900, its GDPpc was about equal to that of India and a third that of Mexico.

In 1800, China’s GDPpc trailed Mexico by only about 6.5%; but declined by about 0.2% per year during the 19thcentury when China’s economy seriously stagnated as a result of opium wars and numerous internal rebellions which took from 20 to 40 million lives. By 1900, China’s GDPpc was less than half that of Mexico. India, South Korea and Indonesia also grew very slowly during the century. Their GDPpcs went from about half that of Mexico to about a third. There was no Asian economic miracle during the 19th century.

By 1950, Mexico trailed Argentina, Chile, Peru, Cuba and South Africa. From 1900 to 1950, the GDPpc of Mexico grew by a respectable 1.2% per year; however Peru and Brazil grew twice as fast. At the other end, the Asian countries did rather poorly. For example, China’s GDPpc declined by an amazing 1.2% per year from 1900 to 1950, when the country suffered from competing warlords, a protracted civil war, and Japanese invasion. By 1950, China’s GDPpc was less than half of what it had been in 1800 and also was behind India and less than a seventh that of Mexico. From 1900 to 1950, India’s GDPpc grew by only 0.01% per year while Indonesia and South Korea did only marginally better. The mid 20thcentury wars were very damaging to the Asian economies.

By 2000, Mexico had almost caught up with Argentina and had surpassed Chile, Peru, Cuba and South Africa. While Mexico’s growth from 1950 to 2000 of about 2.5% per year was very impressive, Brazil grew even faster at 2.9% per year. South Korea’s GDPpc surged ahead by an amazing 6.4% per year during the second half of the 20th century; it increased over twenty-fold from about $700 to over $15,000. China also grew at a very impressive 3.8% per year posting over a six fold increase. These two countries recovered briskly after their numerous wars and kept moving ahead at a rapid clip.

During the years between 2000 and 2011, Mexico had the worst performance of the countries in the table, growing at only 1.6% per year. China grew over eight times faster than Mexico; India and Russia grew almost five times faster. The growth rates of the other Latin American countries in the table – Argentina, Brazil, Chile, Cuba and Peru – were over twice that of Mexico. However, the Mexican economy is closely tied to the USA where GDPpc grew less than half as fast as Mexico. As mentioned previously, Mexico is expected to grow briskly during the rest of this decade.

It is interesting to look over the full 211 year period from 1800 to 2011. Interestingly throughout the whole period the GDPpc of Iran slightly trailed that of Mexico. The gap between these two countries closed a bit during the 211 year period. As a result of its rapid surge in recent decades, South Korea grew the fastest at 1.8% per year; it moved from one of the poorest in 1800 to the richest in the table. Other solid growth rates were posted by Argentina, Brazil, Chile, Iran and Russia. The slowest growth occurred in India, at only 0.8% per year, followed by Indonesia and China at slightly less than 1.0% per year. However, these Asian countries are now growing considerably faster than the other countries in the table. Looking at income growth over the last two hundred years puts the current situation in perspective. It is interesting to speculate on what the next two hundred years will bring, something we will return to in future posts.

Related posts:

Rocks and relief fieldtrip: Tequisquiapan and the Peña de Bernal

 Other, Teaching ideas  Comments Off on Rocks and relief fieldtrip: Tequisquiapan and the Peña de Bernal
Jun 212012
 

There is a close connection between geology and relief in many parts of Mexico. In this post we describe a one-day fieldwork excursion in the Tequisquiapan area of the central state of Querétaro that looks at this connection. The fieldwork is suitable for high school students but could easily be extended to provide challenges for college/university students.

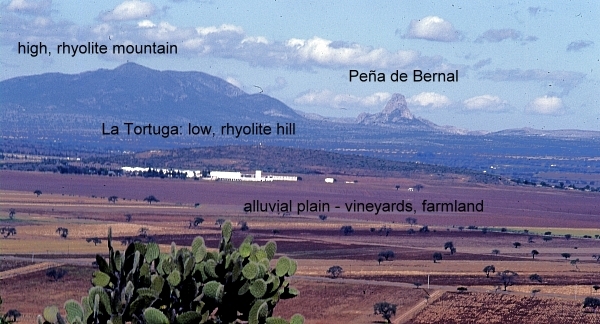
The fieldwork starts with a fieldsketch from near Tequisquiapan. Any suitable vantage point will do, provided it offers a clear view northwards to the very distinctive Peña de Bernal (seen in the background of the photo below). At this point, a simple line sketch should suffice to help students identify the following four different kinds of terrain:

  • flat or gently sloping plain, used for cultivation
  • low hills, with gently sloping sides, which look to be covered in bushes and cacti [scrub vegetation]
  • high mountains, with steeper slopes, also with no obvious signs of cultivation
  • the Peña de Bernal itself, a distinctive monolith with exceptionally steep sides

There is no need to identify any rocks or use any geological terms (students can add appropriate labels later!). Engage the students in a discussion about why there might be four different kinds of relief visible in this area, and how their ideas or hypotheses could be investigated further. Conclude the discussion by explaining that they are now going to look for evidence related to the idea that these four different kinds of relief are connected to significant differences in geology.

View looking north from "Las Cruces" near Tequisquiapan. Photo: Tony Burton; all rights reserved.

View looking north from "Las Cruces" near Tequisquiapan. Photo: Tony Burton; all rights reserved.

The next stop is a small roadside quarry on the flat area. The most accessible quarry many years ago was located a short distance south of Tequisquiapan on the east side of the highway, but any quarry on the flat land will serve to reveal the rocks that form the plain.

Roadside quarry, near Tequisquiapan. Photo: Tony Burton; all rights reserved

Roadside quarry, near Tequisquiapan. Photo: Tony Burton; all rights reserved

[Warning: Ensure that you park off the highway; when examining the rock in the quarry, avoid any overhanging sections, and do not do anything to cause slope instability or collapse].

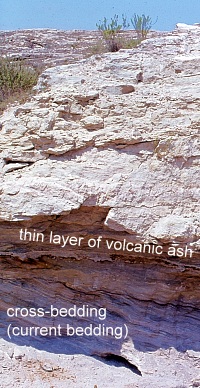
The rocks in the quarry are in layers (sedimentary) and very distinctive. The individual particles of the rock are rough to the touch and sand-sized, so this is some kind of sandstone.

Some layers are more or less horizontal, but in places successive layers are laid down at a much steeper angle. This is “current bedding” and indicates that the rocks were formed by water, perhaps where a river entered a lake. The individual particles in the rock are not well-rounded, so have not traveled all that far.

Within each major layer, the material shows signs of sorting, with fine material sitting on top of coarse material. In some places, the sandstone contains small pebbles, so this rock is a sandstone conglomerate. Small casts of fossil shells can be seen in places, further suggesting it is a sedimentary rock deposited in a former lake.

A very thin white layer is present (at about head height in the photo). This layer is totally different to the sandstone conglomerate. It is fine material that has been compacted. Given the volcanic history of central Mexico, this is almost certainly a thin layer of volcanic ash that covered older rocks before being covered in turn by the next layer of sediments.

With some guidance, students should be able to work most of this out for themselves! The last stage at this stop is to ask why this rock forms the flat land in the area, rather than the hills. (Answer: softer, weaker, less resistant, easier to erode, etc).

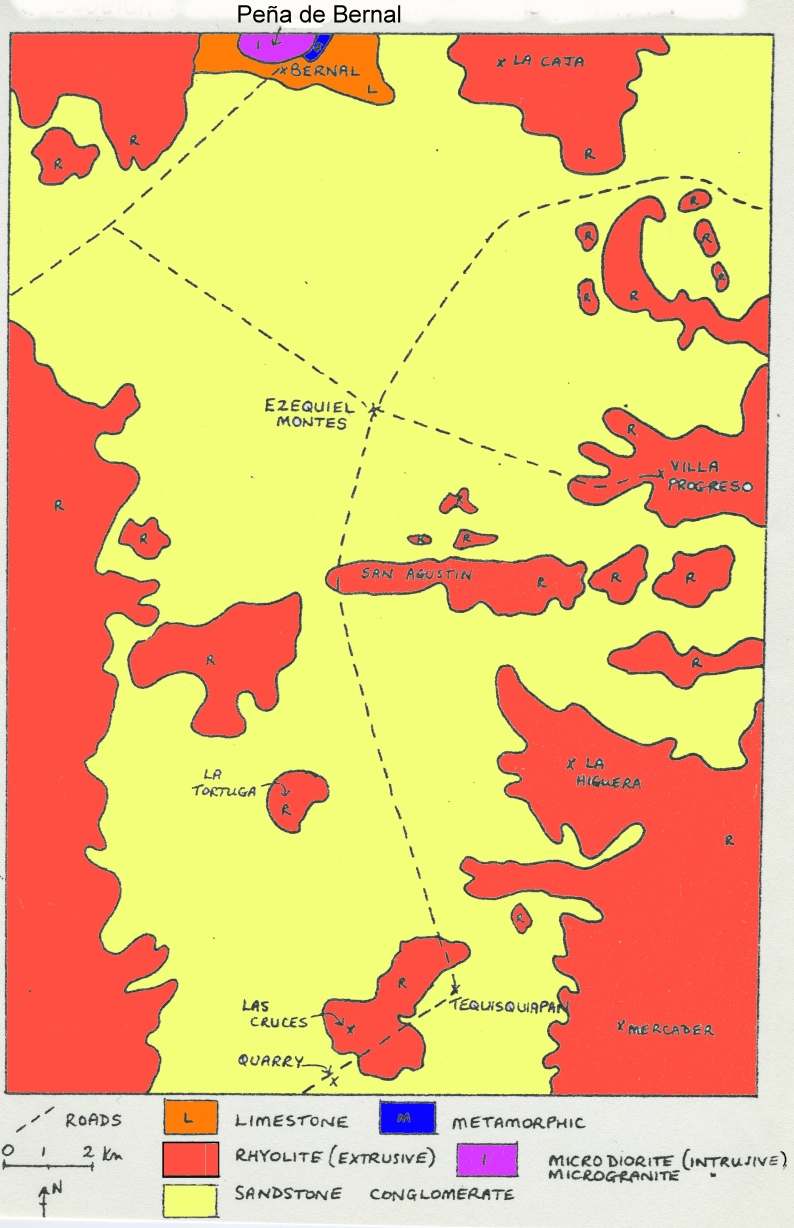
The next stop is to take a look at the rock forming the low hills. The highway between Tequisquiapan and Ezequiel Montes (see map) conveniently cuts through a low ridge at San Agustín. This affords an opportunity to take a close look at the rock forming that ridge. [Warning: Ensure that you find a safe parking spot, and take every precaution, since traffic along this highway can be heavy and very fast-moving]

The rock at San Agustín is darker and much harder than the rock in the quarry. It has clear crystals in it, apparently arranged haphazardly. From its color (grey) and grainsize (fine), it is a rhyolite [a fine grained, acid igneous rock].  It is far more difficult to erode than the sandstone on the plain, so it forms upstanding ridges and low hills in the landscape.

From San Agustín, drive through Ezequiel Montes and on to the town of Bernal, one of Mexico’s “Magic Towns“. The next part is the most physically-challenging part of the excursion since it is necessary to climb at least part-way up the Peña de Bernal! [Warning: this is very steep in places, and climbing beyond the mid-way “chapel” is definitely not recommended]. Examining the rocks of the Peña de Bernal reveals that they are lighter in color than the rhyolite and fine-grained, but with larger crystals (phenocrysts) in some places. This rock must have cooled very slowly (or the phenocrysts would not have had chance to form) and this is an intrusive igneous rock known as microgranite. Eagle-eyed students should also find some other rocks while climbing the Peña de Bernal. In places, it is possible to find good specimens of a very hard, banded metamorphic rock that was formed when heat and/or pressure transformed pre-existing rocks. The banded rock is a gneiss [pronounced “nice”].

The presence of intrusive igneous rocks (formed underground) together with metamorphic rocks strongly suggest that the Peña de Bernal is an example of a volcanic plug. It represents the central part (and all that now remains) of a former volcano, whose sides, presumably composed of ashes and lava, have long since eroded away.

Conclusion:

After students have had chance to work most of this out for themselves, a look at the local geological map should confirm that their deductions are reasonable. As can be seen on the map below, the flat area is indeed an alluvial plain (sandstone), with low rhyolite hills and ridges in places, and higher rhyolite mountains in the background, with the distinctive Peña de Bernal made of igneous and metamorphic rocks at the northern edge of the map.

In this particular part of Mexico, as in many other areas, the link between geology and relief is very strong! Happy exploring!

Sketch map, Geology of the Tequisquiapan area

Sketch map, Geology of the Tequisquiapan area; click to enlarge

Related posts:

Jun 172012
 

Good news for Mexico’s coastline! The controversial Cabo Cortés mega-resort project in Baja California Sur, Mexico, has been cancelled, with President Felipe Calderón announcing that in “such an important area for the Gulf of California and the country … we should all be absolutely certain that [the project] will not cause irreversible harm”. However, Calderón did not rule out the possibility that a revised, more sustainable project might meet government approval.

As detailed in several previous geo-mexico.com posts, the Cabo Cortés project had been opposed by local residents, fishermen, environmental groups including Greenpeace and many academics:

The president of the Mexican Center for Environmental Law, Gustavo Alanis, hailed the government’s decision as “a triumph for conservation, environmental protection and nature.” He said that it is “a message in favor of legality and the rule of law in the environmental sphere” that would make clear to potential investors that they are welcomed as long as they respect nature and comply with existing environmental laws.

A round-up of news items about the Mexican diaspora in the USA

 Other  Comments Off on A round-up of news items about the Mexican diaspora in the USA
Jun 162012
 

This is part of an occasional series of updates featuring news items relating to the Mexican diaspora, especially that part of it residing in the USA. Links to previous news round-ups appear at the end of the article.

Sharp drop in number of illegal border crossings

Julian Aguilar, writing for The Texas Tribune, attributes the sharp drop in apprehensions by the US Border Patrol (from about 540,000 in 2009 to 327,500 in 2011) to “a sour economy, increased enforcement by the Border Patrol and skyrocketing smuggling fees” that combine to keep “more would-be crossers at home.”

Undocumented Mexican migrants in the USA

According to a Department of Homeland Security report published in the American media, including The Economic Times, the number of undocumented Mexican migrants in January 2011 stood at 6.8 million, 59% of the total number of undocumented migrants. The total number was around 11.5 million, down slightly from the figure of 11.6 million the year before. The number of undocumented migrants peaked in 2007 at 11.8 million. The report claims that only 14% of all undocumented migrants in January 2011 had entered the USA after 2005. The figure for undocumented migrants includes more than 1 million minors.

The Pew Hispanics Center estimates that 35% of undocumented adults have been in the USA for 15 years or longer.

Mexican migrants: a million more in poverty in just four years, but rich Hispanics get richer
According to a study published by the banking giant BBVA the number of first generation Mexicans living in poverty in the USA rose from 2.6 million in 2007 to 3.5 million in 2011. Nationwide, about 15% of Mexicans live in poverty, according to US statistics, only half the 30% figure for first generation Mexican migrants. The report’s authors blame the economic crisis and steep rises in unemployment.

It was not all doom and gloom in the BBVA report. The report also found that the proportion of Mexican migrants earning less than 30,000 dollars a year fell from 30% in 1997 to 12.6% in 2011, while the proportion of migrants earning more than 40,000 dollars a year rose from only 4.7% to 15%.

Size of the Hispanic market

This ties in nicely with a study by leading market research firm Packaged Facts which found that 8.2 million Hispanic adults live in households with an income of 75,000 dollars or more. The number of “upscale Latino households” doubled between 2000 and 2010. The report estimates that the buying power of these households will reach 680 billion dollars by 2016. Noting that this group accounts for more than two-thirds of all Hispanics who annually spend $1,000 or more online, Packaged Facts suggested that retailers may wish to rethink their marketing strategies and realign advertising campaigns targeting the massive Hispanic market.

According to the Selig Center for Economic Growth, the buying power of minorities in the USA has grown into a diverse and formidable consumer market in the last decade. Jeff Humphreys, director of the Selig Center, in the Selig Center’s annual Multicultural Economy report, writes that, “In 2012, the $1.2 trillion Hispanic market is larger than the entire economies of all but 13 countries in the world.”

First generation Mexican-American children healthier than succeeding generations

A study published in the Journal of Nutrition shows that first generation Mexican-American children are thinner and eat better than subsequent generations. The study conducted by the Arnold School of Public Health at the University of South Carolina looked at 2,300 Mexican-American youth aged 12-19.

Health experts believe that the diet of first generation Mexican-Americans is closer to traditional Mexican cuisine, and is therefore relatively rich in meat, beans, fruit and vegetables. The study found that second-generation Mexican-Americans were 2.5 times as likely to be obese as their first-generation peers; third-generation Mexican-Americans were two times more likely to be obese.

Cultural identity: what’s in a name?

The Pew Hispanic Center (PHC) has published the results of a survey of 1200 Hispanic adults that explores how migrants in the USA see themselves. Entitled “When Labels Don’t Fit: Hispanics and Their Views of Identity”, the report opens by saying that,

Nearly four decades after the United States government mandated the use of the terms “Hispanic” or “Latino” to categorize Americans who trace their roots to Spanish-speaking countries, a new nationwide survey of Hispanic adults finds that these terms still haven’t been fully embraced by Hispanics themselves. A majority (51%) say they most often identify themselves by their family’s country of origin; just 24% say they prefer a pan-ethnic label.

Moreover, by a ratio of more than two-to-one (69% versus 29%), survey respondents say that the more than 50 million Latinos in the U.S. have many different cultures rather than a shared common culture. Respondents do, however, express a strong, shared connection to the Spanish language. More than eight-in-ten (82%) Latino adults say they speak Spanish, and nearly all (95%) say it is important for future generations to continue to do so.”

The PHC report makes many interesting points about migrants’ cultural identity, race, language and core values.

About half (47%) of all Hispanics say they consider themselves to be very different from the typical American. Only 21% say they use the term “American” most often to describe their identity. However, regardless of where they were born, large majorities of Latinos say that life in the USA is better than in their family’s country of origin and 87% say it is important for immigrant Hispanics to learn English in order to succeed.

Related posts:

The geography of Tequisquiapan, a spa town in the state of Querétaro

 Other  Comments Off on The geography of Tequisquiapan, a spa town in the state of Querétaro
Jun 142012
 

The town of Tequisquiapan is an excellent place for geographers!

For one thing, it has a monument claiming to be The geographic center of Mexico. While this is hotly disputed, it is a fun place to start!

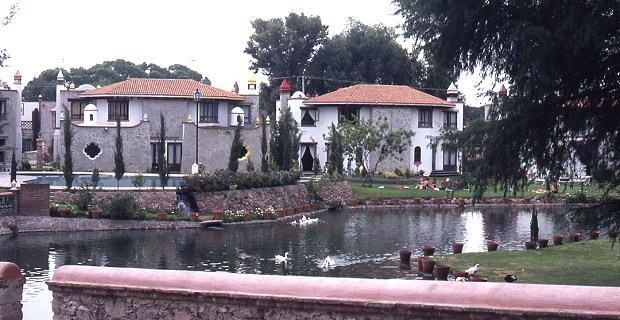
Tequisquiapan is an attractive spa town which has many hotels, restaurants and stores. It has grown substantially in recent years, attracting former Mexico City dwellers tired of the traffic congestion, smog and challenges of living in the big city. Mid-week, Tequisquiapan is largely deserted, with the air of a ghost town, waiting for revival. Revival occurs every weekend as the wealthier residents of Mexico City flee the city in search of clean air and blue skies. The town’s restaurants begin to fill and the discos gear up for action lasting into the early hours. Many of the weekenders now own second homes in Tequisquiapan.

Upmarket homes in Tequisquiapan. Photo: Tony Burton; all rights reserved

Upmarket homes in Tequisquiapan

Why is Tequisquiapan such an attractive choice for them? The key attractions (see Tequisquiapan, Querétaro: a delightful spa town)  are:

  • a small town atmosphere, with winding cobblestone streets, lined by attractive and neatly kept one-story buildings
  • the town boasts a dozen or more “three star” or better hotels, all with thermal swimming pools, and a multitude of handicraft shops and galleries
  • an 18-hole golf course, open to the public
  • a specialist handicrafts market, a lively permanent market and, on weekends, numerous small street stalls selling precious stones and jewelry (for enticing pictures, see Tequisquiapan, provincial Mexican charm  on MexConnect.com)
  • the town is small enough to walk around and bathed in sunshine virtually all year round
  • an annual cheese and wine festival in early summer
  • it is less than two hours by car from Mexico City
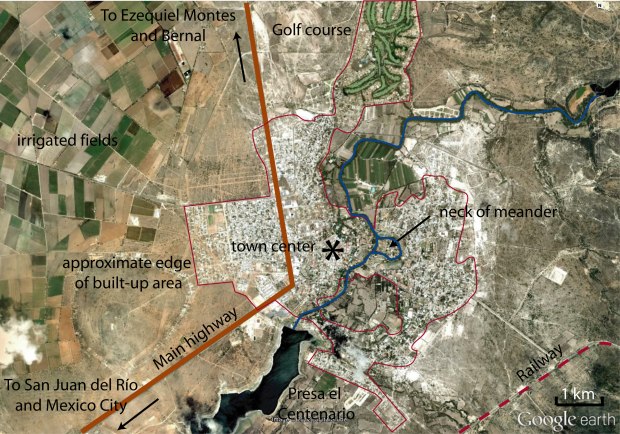
Annotated Google Earth image of Tequisquiapan area

Annotated Google Earth image of Tequisquiapan area

Anyone interested in urban geography will find that Tequisquiapan’s layout is quite unusual (for Mexico).  Some streets in the center of the town wander aimlessly rather than conforming to the traditional Mexican grid pattern. By way of comparison, a newer area of settlement across the highway (see image above) exhibits perfect grid pattern.

Bougainvillea-covered wall in Tequisquiapan

Behind the stone walls of the many fine hotels, the spa waters of Tequisquiapan offer their temptation. Why hike the streets when you can laze by a pool? The water is tepid rather than hot but very welcome, given the arid heat that envelops this area most of the year.

Towards the south-east, the town has grown around existing farmland, so homes surround an undeveloped core of agricultural land.

To the north, a former hacienda (Hacienda Grande) has been converted into a residential area built around a golf course. The irrigated fairways are strikingly visible on Google Earth.

Tequisquiapan is one of the few Mexican towns of its size and age to have a gated community in the downtown core, immediately off the main plaza.

Physical geographers won’t be disappointed either. Also near the center, upmarket houses have been built on the neck of a cut-off meander which has left an “island” with the river on either side. Floods on this river are now unlikely since it is controlled by the Centenario dam which has created a reservoir, Presa el Centenario, used for water sports.

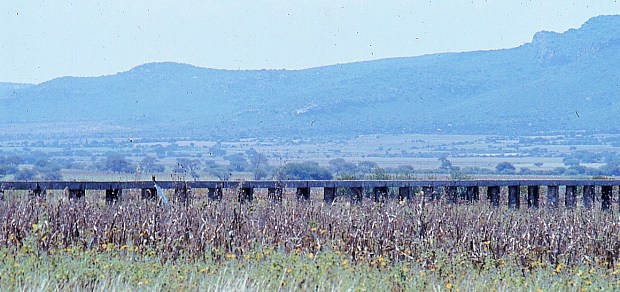
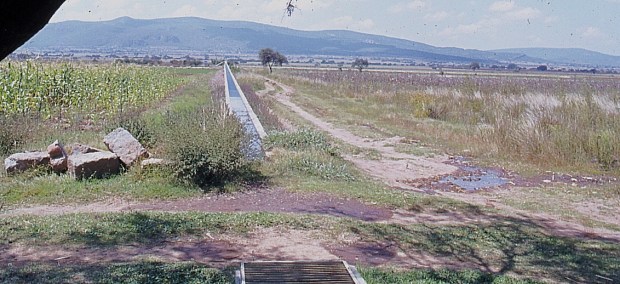
The flat valley floor around Tequisquiapan has become a rich farming area, particularly well known for its vineyards. A network of aqueducts and irrigation channels helps farmers overcome the vagaries of the annual dry season.


Aqueduct near Tequisquiapan. Photo: Tony Burton; all rights reserved.

Aqueduct near Tequisquiapan

The fact that this area has a pronounced dry season means that most local streams are intermittent; they run only for short periods during and immediately after the rainy season. The rest of the year, their channels are dry, providing a perfect opportunity for physical geographers to walk along them studying their features and landforms, without even getting their feet wet!

Irrigation channel near Tequisquiapan. Photo: Tony Burton; all rights reserved.

Irrigation channel near Tequisquiapan

On balance, given all these points of geographical interest, maybe Tequisquiapan is right to call itself the “geographic center” of Mexico after all!

Photos:

All photos in this post are by Tony Burton; all rights reserved.

Jun 112012
 

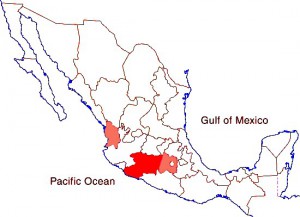
Avocados originated in Mexico and the country remains the world’s leading producer. Farmers in Michoacán (where 92% of Mexico’s avocados are grown) harvested 1.1 million tons of avocados in the 2010-2011 harvest season, 40% of the world total. About 125,000 hectares, or 11.5% of all agricultural land in Michoacán, is currently under avocado orchards.

Avocado-growing states in Mexico.

Avocado-growing states in Mexico

The value of avocado exports has tripled over the past five years. Exports in 2011 totaled almost 400,000 metric tons and were worth 990 million dollars, compared to 338 million dollars in 2006. The main export markets are the USA (80%), Japan (9%) and Canada (6%).

Part of the reason for strong exports is due to an increased demand from US consumers but it is also due to new menus in fast food chains. The addition of avocados in 2010-11 to the menus of Burger King and Subway restaurants has since been followed by competitors such as Wendy’s, so US demand for avocados should continue to grow.

Avocado growing has not been entirely plain sailing in recent years. Growers organizations have reported that costs of the inputs of water, fertilizers and electricity required for avocado growing have all risen sharply.

Avocado growers are also having to confront a relatively new challenge that increases the cost of doing business. According to an article in Mexico City daily La Jornada, growers are now being forced to pay “protection money” to criminal gangs operating in Michoacan’s avocado-growing zone.

The article claims that avocado producers in 13 municipalities in the state of Michoacán face almost daily demands for “protection” payments if they are to continue farming and avoid kidnappings and other forms of violence. It goes on to say that many smaller growers near Uruapan, Zitácuaro and Ziracuarétiro have chosen to rent out or sell their avocado orchards and move away from the area entirely.

In addition, one of the criminal groups is demanding up to $1,000 pesos (75 dollars) a plant for every avocado plant purchased from specialist nurseries. Several different groups are alleged to be involved. Avocado packers and truck drivers are also made to pay “fees” which can amount to between 40% and 60% of their normal income, according to anonymous representatives of national organizations speaking to the press.

The situation affects avocado growers in many places, including Los Reyes, Uruapan, Salvador Escalante, Acuitzio, Tacámbaro, Ario, Teretán, Apatzingán, Tacíntaro, Nuevo Parangaricutiro, Peribán, Tingüindín and Zitácuaro.

At one time, there were as many as 22,000 avocado growers, half of them working only small orchards. The protection rackets have meant that new plantings have become the preserve of a relatively small number of larger farms, and it is currently estimated that the total number of growers has shrunk to around 17,500.

Related posts:

Remittances are on the rise

 Updates to Geo-Mexico  Comments Off on Remittances are on the rise
Jun 092012
 

The annual total of remittances sent back to families in Mexico by migrant workers in the USA increased year-on-year to 22.731 billion dollars in 2011, and looks set to rise again this year.

Mexico’s central bank (the Bank of Mexico) recently released figures showing that remittances to Mexico increased in April 2012 by more than 8% compared to the same month a year earlier, bringing the cumulative total for the first four months of this year to 7.4 billion dollars, 6% higher than in the same period in 2011.

These increases in remittance flows come despite increasing evidence that the net flow of migrants leaving Mexico to work in the USA has come to a standstill:  Net migration flow from Mexico to the USA falls close to zero or has possibly reversed.

For more detail about remittances in Mexico, see:


Jun 092012
 

What does it matter where places are? Well, as I geographer, I have to admit that I have always thought it quite important, especially for a  business exchanging one currency for another. However, apparently ForexTicket [formerly http://www.forexticket.co.uk/] was unconcerned about such details of geography, since its website, which incidentally was a nice design and included a flag of Mexico, got its basic world geography all mixed up:

Mexican Peso

  • iso 4217: MXN
  • Mexico (South America)

Enough said! Now that you’re made it into our Hall of Shame, please consider checking an atlas and revising your website,

Sincerely,

Geo-mexico.com

Jun 072012
 

The Peña de Bernal, in the central state of Querétaro, is one of Mexico’s most distinctive geomorphosites. Geomorphosites are “landforms that have acquired a scientific, cultural/historical, aesthetic and/or social/economic value due to human perception or exploitation” (Panizza M., 2001). See Geotourism and geomorphosites in Mexico for a brief introduction to the topic.

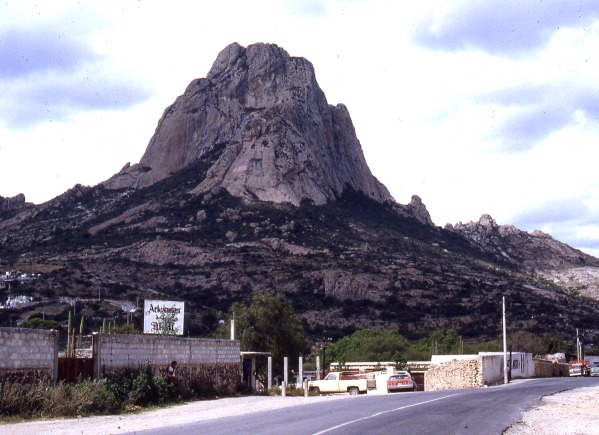
The Peña de Bernal is a dramatic sight, which only gets more imposing the closer you get. How high is the Peña de Bernal? We are unable to give you a definitive answer (it depends where you start measuring from) but claims of 350 meters (1150 feet) sound about right, assuming we start from the town.

Peña de Bernal. Photo: Tony Burton; all rights reserved

The Peña de Bernal. Photo: Tony Burton; all rights reserved.

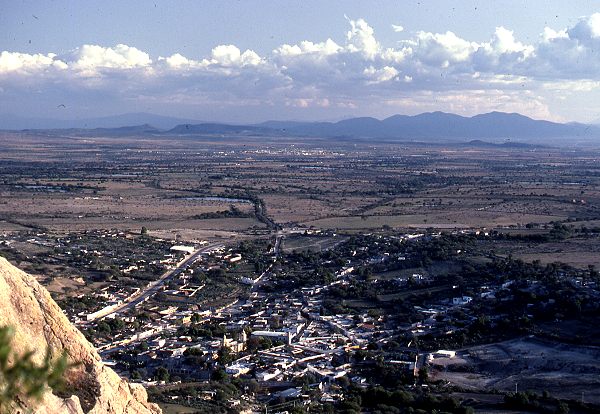
According to its Wikipedia entry, this is the “third tallest monolith in the world”, apparently only exceeded by the Rock of Gibralter and Sugarloaf Mountain in Rio de Janeiro. Others, including Melville King, have described it as the “third largest rock in the world”. These claims may (or may not) be exaggerated, but in reality it is definitely a very steep and tiring climb, even to reach the small chapel that has been built half-way up! The photo below is taken from this chapel, looking out over Bernal and the local farmland and vineyards.

View from the Peña Bernal, with the town of Bernal in the foreground.

View from the Peña de Bernal over the small town of Bernal. Photo: Tony Burton; all rights reserved.

How was the Peña de Bernal formed?

The most likely explanation is that this monolith represents the hardened magma (molten rock) from the central vent of a former volcano. This rock was much more resistant to erosion that the layers of ash and/or lava that formed the volcano’s flanks. Centuries of erosion removed the sides, leaving the resistant core of the volcano exposed as a volcanic neck. We will examine this idea in slightly more detail in a future post.

The town of Bernal

The town of San Sebastián Bernal is also well worth visiting. Having become a magnet for New Age types, it now boasts several decent restaurants, good stores and a range of hotels including high quality “boutique” hotels. Bernal was designated one of Mexico’s “Magic Towns” in 2005. To learn more about the town of Bernal and see some fine photos, we highly recommend Jane Ammeson’s article “The magic of Bernal, Querétaro: wine, opals and historic charm.

At the Spring Equinox (March 21), the town is invaded by visitors “dressed in long, white robes or gowns, and red neckerchiefs” who come seeking “wisdom, unity, energy and new beginnings”. (Loretta Scott Miller writing in El Ojo del Lago, July 1997).

How to get there:

From Mexico City, take the Querétaro highway (Hwy 57D) north-west to San Juan del Río. Then take Highway 120 past Tequisquiapan as far as the small cross-roads town of Ezequiel Montes. Turn left for about 11 kilometers, then right… and you’re there! Taking this route gives you glimpses of the Peña de Bernal from afar. Allow 2.0 to 2.5 hours for the drive.

Other geomorphosites worth visiting:

Mexico has literally thousands of geomorphosites. Among those described in previous posts are:


Jun 042012
 

A previous post—How “complex” is the Mexican economy?—discussed The Atlas of Economic Complexity and noted that Mexico’s Economic Complexity Index (ECI) of 1.145 ranked it 20th among 128 countries. ECI indicates a wide range of complex knowledge capabilities related to productive enterprises. Mexico has a very high ECI given its income level; all other countries in the top 20 have significantly higher incomes than Mexico.

According to the Atlas, during the rest of the decade Mexico’s GDP should grow relatively rapidly to catch up with its ECI. Analyses in the Atlas indicate that during the last few decades countries with higher than expected ECIs compared to their income levels experience more rapid economic growth. While this relationship is empirically true, it should be noted that it does not explicitly include other factors thought to be important to economic growth (see Section 4 of the Atlas). Some of these other factors are governance and institutional quality, corruption, political stability, measures of human capital and competitiveness indicators. The Atlas implies that these other factors contribute to and thus are indirectly part of the Economic Complexity Index.

The analysis in the Atlas predicts that Mexico’s annual growth in real per capita GDP will be 3.5% from 2009 to 2020, ranking it 10th in the world in growth rate (see table). (The growth rates for some other countries are given in footnote 1 below.)  Mexico’s annual growth in real per capita GDP is impressive given that its growth was only 0.8% per year for 1999 to 2009, the same as that for the USA. Growth in these two countries was slowed significantly during this period as a result of the very severe recession, the worst since the great depression. This rather slow growth is surprising given that Mexico’s ECI increased from 1998 to 2008 was ranked 30th worldwide. Though the Mexican economy suffered significantly during this period, it continued to develop new productive capabilities and become more complex. This added complexity is expected to generate accelerated economic growth in the current decade.

RankCountry% growth in GDP/person, 1999-2009Expected % growth in GDP/person, 2009-2020, Income/person, 2009Expected income/person, 2020
1China9.64.33,7445,962
2India5.64.31,1921,886
3Thailand3.14.03,8936,023
4Belarus7.94.05,0757,806
5Moldova4.84.01,5162,321
6Zimbabwe449.03.8 - 6.2676?
7Ukraine5.23.72,4683,694
8Bosnia-Herzegovina4.13.64,5256,669
9Panama3.93.67,15510,529
10MEXICO0.83.58,14311,894

The low growth rate of 0.8% per year for 1999 to 2009 represents “real” per capita growth corrected for inflation and population growth. In nominal terms, Mexico’s total GDP growth from 1998 to 2008 was 1.8% per year. It is expected to grow 4.8% per year for 2009 to 2020, which ranks its 22nd in the world, behind numerous poor African countries with rapidly growing populations. Of large or populous world countries, the only ones ranked ahead of Mexico are India (ranked 8th), the Philippines (12th), Egypt (14th), Pakistan (18th) and China (20th).

In summary, the Atlas of Economic Complexity predicts that the Mexican economy will grow very rapidly during the rest of this decade and beyond. Let’s hope that this prediction becomes a reality.

Footnote 1:

For comparison: Indonesia ranked 21st at 3.3%, Pakistan 27th at 3.1%, Guatemala 35th at 3.0%, South Africa 41st at 2.9%, Turkey 43rd at 2.8%, Brazil 48th at 2.7%, Argentina 54th at 2.6%, Russia 59th at 2.6%, USA 91st at 2.0%, Canada 104th at 1.7% and Nigeria 118th at 1.1%.

Source:

Ricardo Hausmann, Cesar Hidalgo, et. al. “The Atlas of Economic Complexity“, The Observatory of Economic Complexity (Harvard HKS/CDI – MIT Media Lab). Retrieved 19 May 2012.

Magic or mystery? Mexico adds four more Magic Towns to its list

 Mexico's geography in the Press  Comments Off on Magic or mystery? Mexico adds four more Magic Towns to its list
Jun 022012
 

Mexico’s Tourism Secretariat has designated four more Magic Towns, bringing the total number to fifty-four. The latest Magic Towns are:

51. Angangueo (Michoacán)

Angangueo is an attractive former silver-mining town. At the entrance to the town are strange, step-sided earth mounds; these are not pre-Columbian pyramids but twentieth century spoil-tips.

Angangueo’s pretty single-story buildings with red roofs and flower-filled porches line a narrow main street which gradually meanders up to the head of the valley and the town plaza. There are two large churches on this plaza, an obvious sign of the town’s former wealth. Worth visiting, one block uphill from the plaza, is the former residence of Bill Parker, 1930s mine superintendent, and his wife Joyce, a keen photographer. Mining in Angangueo declined after a serious accident in 1953, said to have been caused by the company’s foreign management in response to a threatened strike. The miners who lost their lives in this accident are commemorated by a huge statue which overlooks the town.

Angangueo. Sketch by Mark Eager; all rights reserved.

Angangueo, c 1980. Sketch by Mark Eager; all rights reserved.

The hustle and bustle of industrial activity has been replaced by a slower, more leisurely approach to life. In Angangueo, afternoon siestas are still the norm; don’t expect the small stores to reopen at any particular time in the afternoon. Railway enthusiasts will appreciate not only the standard-gauge mainline and its end-of-the-line station which squeezes the town’s main street against the valley side but also the narrow-gauge mining track which burrows deep into the hillsides.

From 1980-2010, Angangueo acquired a new lease of life as a tourist town, taking advantage of its location close to two major Monarch Butterfly sanctuaries. However, in February 2010, the town suffered extensive flood damage when landslides and mudflows swept away dozens of homes, killing at least 30 residents.

{The illustration and parts of the description are taken, with permission, from chapter 30 of Tony Burton’s “Western Mexico, a Traveller’s Treasury”)

52. Cuatro Ciénegas (Coahuila)

Cuatro Ciénegas (“Four marshes”) is a city and municipality in the northern border state of Coahuila. Situated in an arid region (part of the Chihuahuan desert), its name derives from the proximity of several natural springs that feed more than 200 small ponds and wetlands. These are an integral part of the UNESCO-designated Cuatro Ciénegas biosphere reserve. The city, founded in 1800, has some historical significance, since it was the birthplace of Venustiano Carranza, Mexico’s president from 1915 to 1920.

53. Magdalena de Kino (Sonora)

Magdalena de Kino is a city (and municipality) in an agricultural area in the northern state of Sonora, about 80 km (50 mi) from the Mexico-USA border. The earliest mission was established here by Father Eusebio Francisco Kino (“Padre Kino”), whose remains are now interred in a crypt near the mission. Father Kino was a tireless evangelist and educator, who led explorations of the virtually unknown areas that are, today, the states of Sinaloa, Sonora and Arizona, founding numerous missions as he went.

Magdalena de Kino has several stone buildings of historic or tourist interest, including the Padre Kino Museum and the Temple of Santa María Magdalena, a place of pilgrimage. The city’s main religious festival is held to coincide with 4 October each year.

54. Pahuatlán (Puebla)

Pahuatlán (“place of the fruits”) is a town and municipality in the state of Puebla. In early times, the town, in the mountainous northern region of the state, was a zone of conflict between several indigenous groups. The area has retained many traditions, including that of making paper by hand from tree bark. The Otomí village of San Pablito, in the Pahuatlán municipality, is by far the best-known center of production for this bark paper or amate. The word amate derives from amatl, the Nahuatl word for paper.

Besides being used as a kind of rough paper for records and correspondence, amate was also cut into human or animal forms as part of witchcraft rituals after which it would be buried in front of the person’s house or animal enclosure. Colorful paintings on papel amate or bark paper are sold throughout central Mexico, virtually anywhere there are tourists. The tradition is an ancient one.

In the village of San Pablito, villagers (mainly women and children because many of the menfolk have left to work in the USA) wash the bark, boil it with a solution of lime juice for several hours, and then lay it in strips on a wooden board. They then beat these pulpy strips with stones called muintos or aplanadores until they fuse together to form the desired texture of paper, which is then allowed to dry in the sun.

Centuries of practice enable them to produce amate paper of any thickness, from the equivalent of crepe-paper to poster-board. Visitors to San Pablito quickly discover that the constant sound of pounding is a distinctive reminder of the village’s main industry.

Related posts: