Where are the wealthiest households in Mexico?

 Other  Comments Off on Where are the wealthiest households in Mexico?
Nov 102011
 

A recent publication from the public opinion research consultancy Mitofsky offers some insights into the distribution of different socio-economic groups within Mexico.

The Mitofsky study relies on the AMAI 10×6 system to tabulate the percentage of households in each state that fall into six distinct categories: A/B, C+, C, D+, D and E.

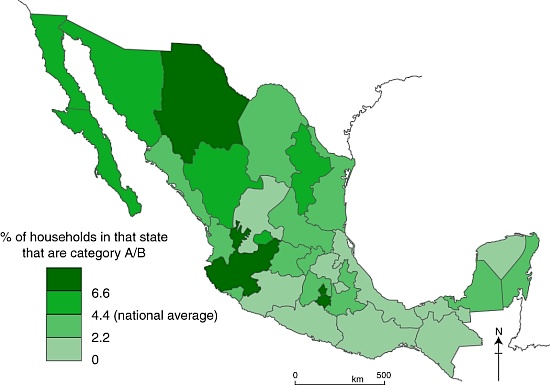
Across Mexico as a whole, 4.4% of households are categorized as A/B (the highest category, see map below), 12.3% as C+, 17.9% as C, 39.1% as D+, 21.6% as D and 4.7% as E (the lowest category).

The data show that, between them, four states–the Federal District (23.4% of all A/B households in Mexico), Jalisco (14.4%), State of México (9.3%) and Nuevo León (5.9%)– account for more than half of all the homes in this category in Mexico

The map shows how the incidence of A/B households (the highest socio-economic category) vary, state by state, across the country.

Distribution of highest socio-economic status households in Mexico.
Households in the highest socio-economic group in Mexico. (Geo-Mexico/Tony Burton; all rights reserved)

Do you live in an A/B household?

1. Housing characteristics:
– average of 6-8 rooms (often 3 bedrooms, 3 bathrooms) built of brick and/or concrete
– floors tiled, hardwood or stone; more likely to have carpets or rugs than lower categories
– most are owner-occupied, not rented

2. Sanitary Infrastructure
– connected to municipal potable water and sewer systems
– all have tub, shower, and water heater (usually using gas)
– two-thirds of these homes have water cisterns and pump to supply water tanks.
– some have air conditioning and/or central heating

3. Practical Infrastructure
– average 2 vehicles
– all have stoves, refrigerators and washing machines
– almost all have microwave ovens, blenders, toasters, coffee-makers and juice extractors

4. Communications and Entertainment Infrastructure
– almost all have fixed line telephones and cell phones
– most have 3 or 4 TVs and  satellite or cable TV
– all have DVDs and stereos/CD players; half have video game consoles
– average more than 1 computers per household; 75% connected to Internet
– many have memberships of private sports clubs and own a second home or time-share.
– more than 50% have traveled by air at least once in last 6 months, and most travel overseas at least once a year

5. Educational and Occupational Profile of Head of Family
– usually has a bachelor’s degree or higher
– work in medium or large companies, as directors, CEOs or other high-ranking professionals

6. Expenditures
– these households save more, but also spend more on education, entertainment, communication and vehicles
– food purchases account for only 7% of total expenditures, well below the average for the total population
– of these food purchases, the proportion spent on dairy products, fruit, and drinks is greater than lower categories

Questions worth thinking about:

  • How does this map compare to other maps on Geo-Mexico of inequalities across the country? (Use the site search feature or tags from the tag cloud on the left hand side of each page to find other inequality maps)
  • To what extent does this map confirm that north-south divide described in several previous posts?

Source:

Niveles socioeconómicos por entidad federativa 2009 – 2010 by Roy Campos and Ana María Hernández; CONSULTA MITOFSKY, December 2010.

Related Posts:
Oct 042011
 

Santa Rosalía in Baja California Sur is one of my favorite places on the Baja California Peninsula. Geography and economics have conspired to change its fortunes more than most towns in the course of history. Originally founded in 1705, the town failed to prosper as its populace faced repeated epidemics, and its farmland was subject to a disastrous flood. The town was largely abandoned by 1828.

A chance find of copper-bearing ore in the middle of the century reversed Santa Rosalía’s fate, and in 1885, a new lease of life was provided when the El Boleo mining company, backed by French capital, was granted a 99-year concession by President Díaz to begin mining for copper in exchange for building all the necessary infrastructure: port, town, mines, railway and foundry. It was judicious timing given that the world market for copper was taking off at precisely that time due to the rising demand for the metal from the fledgling electric companies in Europe and the USA.

Boleo Mine, Santa Rosalía

El Boleo Mine, Santa Rosalía

Within a decade, the mining company had become responsible for more than 80% of Mexico’s exports of copper ingots. The local ore was rich, with up to 25% copper in some samples. Workers flocked in from far afield, including three thousand from China. Working conditions were atrocious, little better than slavery. The health conditions for the miners and foundry workers were appalling;.for example, 1400 deaths were recorded between 1901 and 1903. The company decided on an unusual solution. Rather than move the workers’ homes, it decided to move the smelter chimney. The new chimney was built a kilometer out of town, connected to the smelter by a large, ground-hugging flue. The flue can still be seen today, climbing the hillside immediately behind the Hotel Francés.

By 1900, Santa Rosalía had become a major world copper producer. The smelter relied on supplies of coking coal from Europe, principally from South Wales and Germany. The ships took from 120 to 200 days to reach Santa Rosalía from their home ports. Square-rigged vessels, flying the British or German flag, were constantly arriving in the harbor. When the First World War broke out, several German ships were unable to return to Europe and spent the next few years anchored offshore. The sailors were shocked when they heard that Germany had lost the war; their vessels were eventually distributed among the victors.

The copper deposits were eventually exhausted. The El Boleo mining company closed in 1954, but the state-run Compañía Minera Santa Rosalía continued to mine until 1985, when the smelter was finally shut down, on the eve of the town’s 100th anniversary.

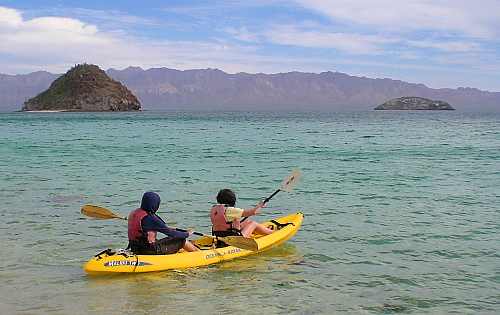
The collapse of the copper mining industry may have caused Santa Rosalía to slip back temporarily into a somnolent slump, but it is now recovering. The mining boom of a hundred and twenty years ago has been replaced by a boom in nature and adventure tourism, which take advantage of the town’s proximity to Conception Bay and the islands in the Sea of Cortés. As we shall see in a future post, because Santa Rosalía has preserved much of its past, it has a massive advantage over its competitors in the region, in that its initial revival fueled by ecotourism can be amplified by cultural or heritage tourism. This beautiful old town and its inhabitants have plenty of reasons to be optimistic as they face up to the challenges of the twenty-first century.

Paddling to an ecotourist future... Photo: Tony Burton

Paddling to an ecotourist future…

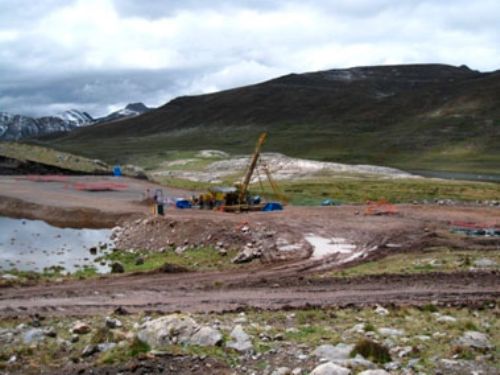
And now, the town has another reason for optimism. The massive El Boleo copper cobalt zinc-manganese deposit, which fueled the town’s first boom period, is now being re-developed with new technology. Baja Mining, based in Canada, owns 70% of El Boleo; a consortium of Korean companies owns the remaining 30%. The 1.2-billion-dollar, open-cast mine will add 3,800 jobs to the local economy. During its anticipated 23-year life span, El Boleo is expected to yield more than 2,000 metric tons of cobalt, 25,000 tons of zinc sulfate and 50,000 tons of copper annually.

Sources:

Want to read more?

The Ethos Foundation’s Multidimensional Poverty Index

 Other  Comments Off on The Ethos Foundation’s Multidimensional Poverty Index
Sep 202011
 

We looked in a previous post at the Multidimensional Poverty Index (MPI), originally presented in an Oxford Poverty & Human Development Initiative (OPHI) working paper, and explained its advantages over earlier poverty measures, especially the relatively crude single-factor approaches like “a dollar a day”.

Earlier this year (2011), the Ethos Foundation, a Mexican NGO, presented its own Ethos 2011 Multidimensional Poverty Index, using the expertise of the authors of the MPI as its starting point.

The Ethos Foundation believes that poverty is comprised of both household poverty, an inability to satisfy basic household needs, and by aspects of ambient poverty that make it impossible for people to achieve well-being given the existing political, social and economic conditions. As a result, their index gives a more “Latin American” perspective on poverty.

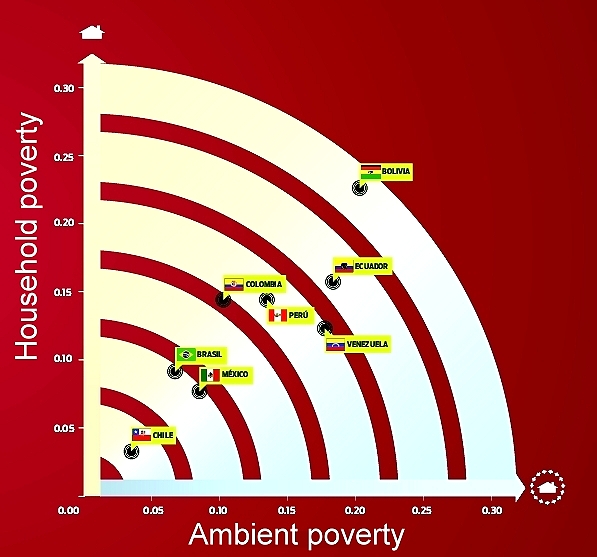
In applying its Multidimensional Poverty Index to an analysis of poverty in the eight largest economies in Latin America, the Ethos Foundation concluded that Chile is the country with the least poverty, followed by Brazil and Mexico.

Ethos Poverty Index applied to Latin America's largest economies. (Ethos Foundation, 2011)

The graph shows how the 8 countries rated, with the axes of the graph being household poverty and ambient poverty respectively. Overall, Brazil and Mexico are almost equal. While Brazil has less “ambient poverty” than Mexico, Mexico has less “household poverty”. Both countries have a long way to go to reduce poverty levels to match those in Chile.

What factors are included in the Ethos Foundation Poverty Index?

A. Household Poverty:

  1. Income per person (under $60 a day)
  2. Education (head of household uneducated? One child or more aged 7-15 not attending school?)
  3. Provision of drinking water and drainage
  4. Building materials (solid walls? three or more people sleeping in same room?)
  5. Cooking fuel used
  6. Availability of electricity

B. Ambient Poverty (21 variables in 7 categories, but not all equally weighted):

  1. Public Health (life expectancy, infant mortality, public health access)
  2. Institutions (government effectiveness; corruption; political stability)
  3. Economy (unemployment rate; competitiveness; access to micro-loans)
  4. Democracy (civil liberties; political rights and freedom)
  5. Public safety (homicide rate, vehicle theft rate, confidence in police)
  6. Gender (salary parity, educational parity, women in government)
  7. Environment (CO2 emissions/person; species in danger of extinction; rate of deforestation)

The Ethos 2011 Multidimensional Poverty Index is an interesting and valuable addition to the literature on poverty measurement. It is a salutary reminder to geographers that the world is often too complex a place for the same methods of study and quantification to work well everywhere. The great strength of the Ethos Foundation’s index is that it adopts a Latin American viewpoint on poverty, one that is more localized but of far greater relevance to Mexico than previous alternatives.

Related posts:

The financial flows involved in Mexico’s vehicle manufacturing industry

 Other, Teaching ideas  Comments Off on The financial flows involved in Mexico’s vehicle manufacturing industry
Sep 192011
 

In previous posts, we have seen Where Mexico’s vehicle assembly plants are located, as well as looked at some of the reasons for Mexico’s success in this industrial sector and examined Mexico’s vibrant autoparts sector.

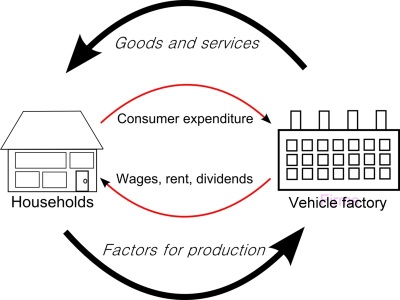
In this post we analyze the varied financial flows involved in the industry. Both local and international financial flows underpin vehicle manufacturing in Mexico.

financial flows

The following are some of the most important financial flows in the vehicle manufacturing sector.

  • International financial flows are in green
  • Domestic/local financial flows are in magenta

1. Foreign firms form Mexican subsidiaries and invest in Mexico; start-up capital to construct the factory and set up the business comes almost entirely from outside the country and enters Mexico as FDI. In recent years, FDI for auto firms has varied from $1 billion to $3 billion.

2. In many cases, local partners are involved, and they also contribute some of the start-up funds.

3. The factories employ workers, in some cases several thousand of them. These workers earn wages and spend most of their wages in the local economy. Each manufacturing job therefore has an economic multiplier effect, and generates more (indirect) jobs in the local economy. These jobs include positions in shops, services, transport, banking, auto-repair, etc. It is estimated that the economic multiplier for vehicle manufacturing is 3:1 – in other words, for every dollar spent in the industry three more are spent in the economy.

4. The factories purchase parts (components), some from Mexican suppliers, and some from overseas.

5. The factory produces vehicles, some of which are sold in the local market, via a series of vehicle distribution/sales points. This generates smaller two-way financial flows within the country.

6. Most of the parts and vehicles made in Mexican auto factories are exported. This generates another major financial flow, as purchasers overseas send funds back into Mexico to pay for their goods. This financial flow (a) allows production to continue and (b) generates profits for the factory owners (the car firms and shareholders).

7. The majority of these profits leaves Mexico, and is repatriated to the corporation’s home country, but both the workers in the factory, as well as the factory owners, pay taxes (state and federal) which remain in Mexico. In the case of shareholders, it is usually a financial flow towards their home country.

Previous posts in the mini-series:

Class exercise:

Use the description of financial flows above to draw an annotated diagram or a map to show the financial flows associated with the manufacturing of vehicles in Mexico. If you can think of additional flows that might be important, add those as well. Compare your diagram/map with that of other students and discuss the results.

Is poverty in Mexico on the rise?

 Mexico's geography in the Press  Comments Off on Is poverty in Mexico on the rise?
Sep 062011
 

According to a recent government study, almost half of Mexico’s population now lives in poverty. The report came from the National Political and Social Development Commission (Spanish language acronym: Coneval). Poverty rates had been falling for several years, so this is clear evidence that Mexico’s economy has been struggling in the wake of the economic recession in North America.

How does Coneval define poverty?

Coneval uses a simple multidimensional poverty index, which considers the following criteria:

  • household income
  • access to education
  • access to food
  • access to health care
  • access to social services
  • housing quality
  • access to basic household services (electricity, water, drainage)

According to Coneval, people living on less than 2,114 pesos (about $180) a month in urban areas (or 1329 pesos in rural areas) and who lack at least one of the basic social rights in the list are living in poverty.

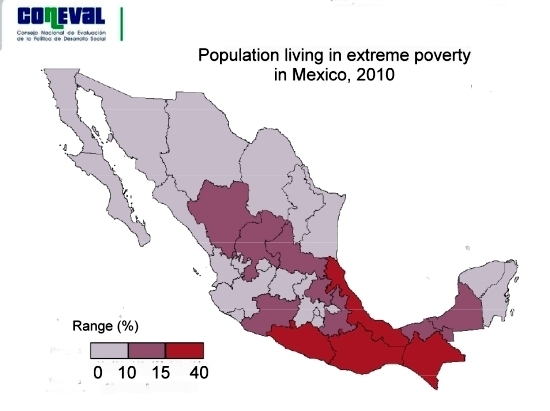
Extreme poverty (see map)  is applied to people living on less than 978 pesos ($85) a month in urban areas (684 pesos in rural areas) and lacking at least one social right.

Map of extreme poverty in Mexico 2010By these definitions, 46.2% of Mexico’s population (or about 52 million people) are currently living in poverty. This has risen from 44.5% in 2008. However, the percentage living in extreme poverty has dropped slightly since 2008 from 10.6% to 10.4%.

The distribution of poverty shown on the map above is not a surprise; we have seen many times in previous posts that the southern half of Mexico (excluding the Yucatán Peninsula) is much less wealthy in economic terms and social indicators than the north, even if it has a wealth of indigenous groups and cultural traditions.

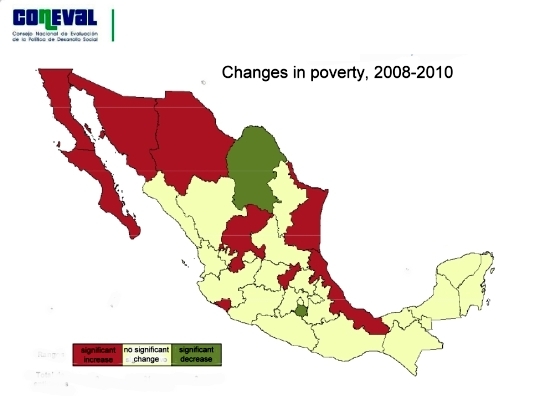
The map below is perhaps more interesting since it highlights the areas where the incidence of poverty has changed significantly between 2008 and 2010. The green areas have experienced a significant decrease in poverty and the red areas a significant increase in poverty. It is clear that the effects of the economic recession are being felt much harder in northern Mexico, where export-led manufacturing is prominent, than in the south.

map of changes in poverty in Mexico, 2008-2010Poverty in Mexico is on the rise, and it is on the rise faster in northern Mexico than the already poverty-stricken south. Only time will tell whether this increase in poverty is a temporary and short-lived trend or whether it heralds the start of tough times for many people in Mexico, especially those living in the rural areas, where the incidence of poverty and extreme poverty are far higher than in urban areas.

Given that the income levels used to define poverty in urban areas are more generous than those used for rural areas, the true level of poverty in the Mexican countryside is almost certainly much higher than this study suggests, something for politicians to bear in mind as they gear up for national elections next year.

Related posts:

The reasons why Mexico has become one of the world’s top ten vehicle-making countries

 Other  Comments Off on The reasons why Mexico has become one of the world’s top ten vehicle-making countries
Sep 052011
 

As we saw in an earlier post – Where are Mexico’s vehicle assembly plants located? – Mexico’s autoparts and vehicle assembly industry plays a vital role in Mexico’s economy, attracting foreign direct investment (FDI), providing employment and bringing in billions of dollars in export earnings each year.

vw-plant-mexico

Mexico also has a large internal (domestic) market for vehicles. According to the Mexican Automotive Distributors’ Association, 820,000 vehicles were sold on the national market in 2010. The market leader is Nissan (with 23.5% of the domestic market), followed by General Motors (19.5%) and Volkswagen (13.2%). Mexico’s best-selling cars are the Nissan Tsuru/V16 and the Volkswagen Jetta. Nissan aims to have domestic suppliers for 90% of all its components by the end of 2011.

Why has Mexico become one of the world’s top ten vehicle-making countries?

  • Mexico already had a highly competitive manufacturing sector
  • Mexico has an excellent communications network, with several trans-border highways and rail lines, as well as several major ports. This means lower shipping costs
  • Stable exchange rate
  • Significant domestic market (population 112 million)
  • Mexico has formed an outstanding network of trade and investment agreements. Mexico has the world’s largest free trade agreements network, spanning three continents, and offers preferential tariffs to more than 44 countries.
  • Competitive labor costs
  • Responsible federal fiscal policies have increased the resilience of the national economy
  • Availability of skilled labor and well-educated, multilingual managers
  • Proximity to the USA, both for investments and for markets
  • Lower production costs: since 2009, the manufacturing costs for vehicles in Mexico has been between 80% and 90% of the equivalent cost in the USA.
  • Total production and delivery costs: For vehicles sold in the USA, costs are lower for vehicles made in Mexico than for those made anywhere else, including China, India and Brazil.
  • Government support: To stimulate higher-value activities (engineering, design, testing, R&D), Mexico’s government offers numerous incentives, including job training and tax credits.

Vehicles made in Mexico are high quality
Mexican manufacturing plants have consistently done well in the annual quality surveys undertaken by market research firm JD Power and Associates. The study has been conducted annually for the past 17 years and provides an important benchmark for the automotive sector. Vehicles made in Mexico usually have fewer defects than those made in the USA. In 2008, the Toyota plant in Baja California won the award for the top ranking plant in the Americas.

The top ten manufacturers:

According to the latest figures from the International Organization of Motor Vehicle Manufacturers (OICA), Mexico was the world’s 9 th largest vehicle-maker (2.2 million vehicles) in 2010, behind China, Japan, USA, Germany, South Korea, Brazil, India and Spain, but ahead of France, Canada, UK, Italy and Russia.

Further information:

For more facts and figures (with graphs and maps useful for teaching purposes): Mexico and the Automotive Industry, a strategic place to invest. Gerardo Ruiz Mateos, Ministry of Economy. June 2010. (pdf file)

The Transnational Metropolitan Areas of Mexico-USA

 Other  Comments Off on The Transnational Metropolitan Areas of Mexico-USA
Aug 092011
 

Mexico shares a 3,169 km (1,969 miles) border with the USA. This is one of the most heavily guarded and frequently patrolled  land borders in the world, and a rare example of a land border that separates two countries with very different levels of economic development. These differences in development have, of course, prompted many Mexicans to migrate to the USA, either as seasonal or permanent migrants, and whether “legal” or undocumented.

Some regional geographers have even proposed that a regional division of North America should include a distinctive “border region”,  an international region straddling the boundary and including all border crossings and many notable cities. This region experienced rapid economic growth following the signing of NAFTA, when many companies moved to northern Mexico, setting up maquiladora manufacturing plants. The border area has long been a major focus of drugs-smuggling, with border transport of illegal narcotics getting ever more inventive. In recent years, sadly, this same area has become the scene of some of the worst drugs-related violence in the world.

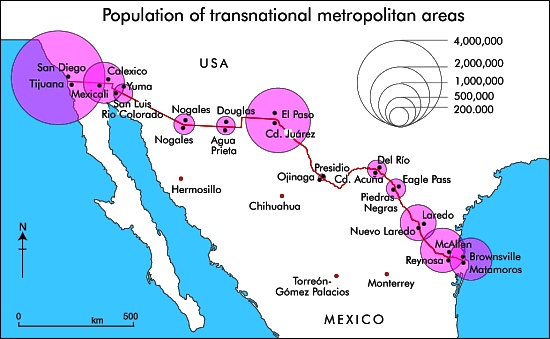
Population of Mexico-USA Transnational Metropolitan Areas.

Population of Mexico-USA Transnational Metropolitan Areas. Credit: Tony Burton; all rights reserved

The map shows the 2010 population of the major transnational metropolitan areas of Mexico-USA. The diameter of each circle represents the combined population of the twin cities that have grown up either side of the border. The pattern closely reflects the volumes of overland transport links (road and rail) between the two countries, as well as of commuters who live one side of the border, but work on the other side and cross daily.

The easternmost part of the boundary between Mexico and the USA follows the Río Bravo (Grande). Inevitably, there have been disputes when the river changed its course. Part of the western boundary follows the course of the Colorado River, from which so much water is taken that it now rarely flows into its delta region in Baja California. All the varied boundary and water-rights treaties and agreements between Mexico and the USA are decided via the International Boundary and Water Commission.

Related posts:

Inequality in wealth in Mexico: the GINI index

 Excerpts from Geo-Mexico  Comments Off on Inequality in wealth in Mexico: the GINI index
Feb 022011
 

Several chapters of Geo-Mexico: the geography and dynamics of modern Mexico look at inequalities in Mexico. The inequalities considered include inequalities related to physical geography (eg water availability), population dynamics (eg fertility rates), gender (eg. female employment), economics (eg GDP/person), development indices (eg HDI) and the distribution of wealth within the country, or within a subset of the country’s residents, such as those who live in a particular state.

Taking the country as a whole, Mexico has a very unequal distribution of wealth:

In 2005, the per person income for the richest 10% of the population in Mexico was $44,035. This figure is over four times the national average, indicating that per person income in Mexico is very unequally distributed. In fact only two countries—Brazil and South Africa—in the top twenty-five economies are more unequal. The average for all twenty-five countries is about three times the national average. The distribution in Japan and Italy is far more equitable; in both countries, the highest 10% get only about twice the national average. [Geo-Mexico, p 89]

If we want a more precise measure of how unevenly distributed the wealth or income is in a country, it is possible to calculate the country’s Gini coefficient. The Gini coefficient, or index, was developed by Italian statistician Corrado Gini :

Without going into all the mathematical details, Gini index values range from 0 (perfect equality) to 100 (extreme inequality with all wealth in the hands of a single individual).The Gini index at a national scale usually falls between 25 and 70. It provides a very useful way to compare income inequalities between countries or to analyze trends in income inequality over time.

In general, the Gini index loosely correlates with development, since most developed countries have lower Gini values (usually below 36) than more developing countries where the values often exceed 40. However, there are many notable exceptions. The USA has a Gini index of 45, higher than might be expected, and Bangladesh and Ethiopia both have relatively low Gini values of 33 and 30 respectively.

Mexico’s Gini index of 48 is high, indicating that inequality remains a real issue. Is Mexico’s inequality of wealth increasing or diminishing? There is little evidence that the GINI index has fallen significantly since the 1990s, though we will return to this question in a future post.

One important thing to note is that in Mexico’s case, its informal sector (not reflected in Gini calculations) may serve to ameliorate the degree of income disparities suggested by the Gini figure taken on its own. Some economists suggest that countries with such high Gini indexes need to double their rates of economic growth before they will succeed in reducing their incidence of poverty. [Geo-Mexico 89-90]

Mexican migrants pay 53 billion dollars a year in US taxes

 Mexico's geography in the Press  Comments Off on Mexican migrants pay 53 billion dollars a year in US taxes
Nov 272010
 

Mexicans migrate to the USA looking for work and higher salaries, but those workers pay 53 billion dollars a year in taxes, according to Ignacio Deschamps, head of the Fundación BBVA Bancomer. (The BBVA Bancomer Foundation has helped 20,000 young people in 143 municipalities complete their high school education.)

Deschamps claims that for every dollar sent home in remittances, Mexican workers will have already paid 2.50 dollars in US taxes. Hence, in 2008, they would have contributed 53 billion dollars to the US Treasury.

Recent figures show that during the economic downturn, unemployment among Mexican migrants is much higher (13%) than for the workforce as a whole (10%).

Previous posts related to Mexican migrants in the USA:

Migration between Mexico and the USA is the focus of chapter 25 of Geo-Mexico: the geography and dynamics of modern Mexico. Ask your library to buy a copy of this handy reference guide to all aspects of Mexico’s geography today! Better yet, order your own copy…

Job recovery in the USA for foreign-born workers

 Updates to Geo-Mexico  Comments Off on Job recovery in the USA for foreign-born workers
Nov 102010
 

Recent data indicate that between June 2009 and June 2010 foreign-born workers in the USA gained 656,000 jobs while native-born workers lost 1.2 million jobs. Foreign-born Hispanics gained 392,000 new jobs, but their pay declined by 5.8%. The majority of foreign-born Hispanics are from Mexico. Assuming Mexicans obtained a big share of these employment gains, we can expect that immigration from Mexico is increasing from the relatively low numbers observed in 2008 and 2009.

During the deepest part of the recession, between June 2008 and June 2009, jobs held by foreign-born workers in the USA fell by 1.1 million. Looking at the two year period between June 2008 and June 2009, foreign-born workers lost about 400,000 jobs while native-born workers lost 5.7 million jobs. Apparently, employers prefer to hire lower paid, temporary foreign-born (Mexican) workers than native-born workers who are more apt to demand higher pay and benefit packages.

Source

R. Kochhar, C.S. Espinoza, and R. Hinze-Pifer, “After the Great Recession: Foreign Born Gain Jobs; Native Born Lose Jobs”, Pew Hispanic Center, Washington DC, Oct. 29, 2010 (pdf file).

Migration between Mexico and the USA is the focus of chapter 25 of Geo-Mexico: the geography and dynamics of modern Mexico. Ask your library to buy a copy of this handy reference guide to all aspects of Mexico’s geography today! Better yet, order your own copy…

The impact of the economic recession on Mexico-USA migration

 Updates to Geo-Mexico  Comments Off on The impact of the economic recession on Mexico-USA migration
Nov 032010
 

Mexicans have been migrating from Mexico to find better employment for decades. Virtually all of this migration, over 95%, is to the USA. Migration to the USA accelerated rapidly after about 1970. Throughout this period, there has been a strong current of return migration back to Mexico. At present there are about 12 million Mexican-born residents of the USA.

The net flow of migrants peaked at about 550,000 in 2006-07.  That year over one million Mexicans entered the USA and just under 500,000 returned to Mexico. However, the recent economic recession had a strong negative impact on immigration from Mexico.

The net flow 2007-08 was down to about 375,000, with just over 800,000 entering and about 440,000 returning to Mexico. A year later, the net flow was about 200,000, with roughly 635,000 entering and 435,000 returning. Data for 2009-10 are not yet available.

It is interesting to note that in the two year period between 2006-07 and 2008-09 immigration dropped by almost 40%, while return migration declined by less than 10%. Apparently, potential immigrants in Mexico knew that jobs are scarce in the USA and thus they were relatively reluctant to migrate. On the other hand, many Mexicans in the USA appear to be hanging on and making money however possible in an effort to stay in the USA. This is particularly interesting because one might assume that undocumented workers in the USA might be among the first to be laid off.

Source:

J.S. Passel and D. Cohn; “Recession Slows – but Does Not Reverse – Mexican Immigration”, Pew Hispanic Center, Washington DC, July 22, 2009.

Migration between Mexico and the USA is the focus of chapter 25 of Geo-Mexico: the geography and dynamics of modern MexicoAsk your library to buy a copy of this handy reference guide to all aspects of Mexico’s geography today! Better yet, order your own copy…

Mexico’s national interests in the fight against drugs

 Mexico's geography in the Press  Comments Off on Mexico’s national interests in the fight against drugs
May 062010
 

The following paragraphs come from a Stratfor Geopolitical Intelligence Report about Mexico’s fight against the drug cartels, Mexico and the Failed State Revisited, by George Friedman, published on 6 April 2010. The link above is to the full text of the report.

The Drug War and Mexican National Interests

From Mexico’s point of view, interrupting the flow of drugs to the United States is not clearly in the national interest or in that of the economic elite. Observers often dwell on the warfare between smuggling organizations in the northern borderland but rarely on the flow of American money into Mexico. Certainly, that money could corrupt the Mexican state, but it also behaves as money does. It is accumulated and invested, where it generates wealth and jobs.

For the Mexican government to become willing to shut off this flow of money, the violence would have to become far more geographically widespread. And given the difficulty of ending the traffic anyway — and that many in the state security and military apparatus benefit from it — an obvious conclusion can be drawn: Namely, it is difficult to foresee scenarios in which the Mexican government could or would stop the drug trade. Instead, Mexico will accept both the pain and the benefits of the drug trade.

Mexico’s policy is consistent: It makes every effort to appear to be stopping the drug trade so that it will not be accused of supporting it. The government does not object to disrupting one or more of the smuggling groups, so long as the aggregate inflow of cash does not materially decline. It demonstrates to the United States efforts (albeit inadequate) to tackle the trade, while pointing out very real problems with its military and security apparatus and with its officials in Mexico City. It simultaneously points to the United States as the cause of the problem, given Washington’s failure to control demand or to reduce prices by legalization. And if massive amounts of money pour into Mexico as a result of this U.S. failure, Mexico is not going to refuse it.

The problem with the Mexican military or police is not lack of training or equipment. It is not a lack of leadership. These may be problems, but they are only problems if they interfere with implementing Mexican national policy. The problem is that these forces are personally unmotivated to take the risks needed to be effective because they benefit more from being ineffective. This isn’t incompetence but a rational national policy.

Moreover, Mexico has deep historic grievances toward the United States dating back to the Mexican-American War. These have been exacerbated by U.S. immigration policy that the Mexicans see both as insulting and as a threat to their policy of exporting surplus labor north. There is thus no desire to solve the Americans’ problem. Certainly, there are individuals in the Mexican government who wish to stop the smuggling and the inflow of billions of dollars. They will try. But they will not succeed, as too much is at stake. One must ignore public statements and earnest private assurances and instead observe the facts on the ground to understand what’s really going on.

“This report is republished with permission of STRATFOR” © Copyright 2010 STRATFOR.

An overview of the geography of drug trafficking in Mexico forms part of chapter 20 of Geo-Mexico: the geography and dynamics of modern Mexico. Buy your copy today!

Related articles in this mini-series:

The economic benefits to Mexico of the drugs trade

 Mexico's geography in the Press  Comments Off on The economic benefits to Mexico of the drugs trade
May 032010
 

The economics of the drug trade

The amount of money pouring into Mexico annually is stunning. It is estimated to be about $35 billion to $40 billion each year. The massive profit margins involved make these sums even more significant. Assume that the manufacturing sector produces revenues of $40 billion a year through exports. Assuming a generous 10 percent profit margin, actual profits would be $4 billion a year. In the case of narcotics, however, profit margins are conservatively estimated to stand at around 80 percent. The net from $40 billion would be $32 billion; to produce equivalent income in manufacturing, exports would have to total $320 billion.

In estimating the impact of drug money on Mexico, it must therefore be borne in mind that drugs cannot be compared to any conventional export. The drug trade’s tremendously high profit margins mean its total impact on Mexico vastly outstrips even the estimated total sales, even if the margins shifted substantially.

On the whole, Mexico is a tremendous beneficiary of the drug trade. Even if some of the profits are invested overseas, the pool of remaining money flowing into Mexico creates tremendous liquidity in the Mexican economy at a time of global recession. It is difficult to trace where the drug money is going, which follows from its illegality. Certainly, drug dealers would want their money in a jurisdiction where it could not be easily seized even if tracked. U.S. asset seizure laws for drug trafficking make the United States an unlikely haven. Though money clearly flows out of Mexico, the ability of the smugglers to influence the behavior of the Mexican government by investing some of it makes Mexico a likely destination for a substantial portion of such funds.

The money does not, however, flow back into the hands of the gunmen shooting it out on the border; even their bosses couldn’t manage funds of that magnitude. And while money can be — and often is — baled up and hidden, the value of money is in its use. As with illegal money everywhere, the goal is to wash it and invest it in legitimate enterprises where it can produce more money. That means it has to enter the economy through legitimate institutions — banks and other financial entities — and then be redeployed into the economy. This is no different from the American Mafia’s practice during and after Prohibition.

The paragraphs above are taken from a Stratfor Geopolitical Intelligence Report about Mexico’s fight against the drug cartels, Mexico and the Failed State Revisited, by George Friedman, published on 6 April 2010.

“This report is republished with permission of STRATFOR” © Copyright 2010 STRATFOR.

An overview of the geography of drug trafficking in Mexico forms part of chapter 20 of Geo-Mexico: the geography and dynamics of modern Mexico. Buy your copy today!

Related articles in this mini-series:

The importance of Mexico City’s International Airport

 Excerpts from Geo-Mexico, Updates to Geo-Mexico  Comments Off on The importance of Mexico City’s International Airport
Apr 132010
 

Mexico City’s Benito Juárez international Airport handled 26.2 million passenger movements last year, making it the world’s 43rd busiest terminal, according to the Airports Council International. In terms of flights, Mexico City airport was the world’s 30th busiest, with 366,000 take-offs and landings. For freight, it was the 48th largest in the world, with 376,000 tons of cargo going through it last year. The Airports Council International is a non-profit organization which serves as the “voice of the world’s airports”.

The numbers make Mexico City airport the most important in Latin America. The on-going modernization of Terminal 1 will expand the airport’s capacity to 32 million passenger movements a year. The airport has parking spaces for 6,514 vehicles, and is served by a metro line, city bus lines, and 1,485 licensed taxis (belonging to 7 different companies). The terminal is also served by 8 mid-distance bus lines, offering regular service to the cities of Córdoba, Cuernavaca, Pachuca, Puebla, Querétaro, Tlaxcala and Toluca.

Nationwide, of the roughly 50 million air passengers each year, about half are domestic and half international. Commercial air service started in Mexico in the 1920s. The main route was Mexico City–Tuxpan–Tampico–Brownsville, Texas. By the 1930s, flights were available to Los Angeles, Cuba, Guatemala and El Salvador. Jet services to USA and European cities started in the 1960s. The routes have expanded steadily and now connect Mexico’s 29 national and 57 international airports.

Mexico City’s airport accounts for about 35% of the national total number of passenger movements, followed by Cancún (10.5%),  Guadalajara (almost 9%), Monterrey (7.4%), Tijuana (5.3%) and Puerto Vallarta (Jalisco) and San José del Cabo (Baja California Sur) each with 3.6%.

International comparisons

Mexico averages about 370 air passenger movements per year per 1000 population, compared to 2430 for the USA, 1400 for Canada, 202 for Brazil and 179 for Argentina. While air travel is growing, it remains a distant third behind automobile and bus travel.

Mexico’s transportation systems, including airports, are discussed in chapter 17 of Geo-Mexico: the geography and dynamics of modern Mexico.