Apr 142011
 

Foreigners are defined as individuals born in another country, but residing in Mexico. According to the recent census, almost a million (961,121) foreigners were living in Mexico in mid-2010. In 2000 there were only about half as many (492,617). Among foreigners, there were slightly more males than females (50.6% versus 49.4%). Under this definition, children born in the USA of two Mexican parents are considered foreigners if they currently live in Mexico. Unfortunately, the data currently available do not enable us to separate these foreign-born Mexicans from other foreigners who were raised in other countries and moved to Mexico to follow their professions or retire. Furthermore, they do not help us answer a question we have been asked dozens of times in recent years, namely, “How many Canadians and how many Americans have retired in Mexico?”

Though almost a million foreigners sounds like an impressive number, Mexico has relatively few foreign born residents compared to its two northern neighbors. Foreigners constitute only 0.86% of the 2010 Mexican population, compared to 21% Canada and 13% in the USA.

Where in Mexico do most foreigners reside? Baja California has the most foreigners with almost 123,000, followed by Jalisco (84,000), Chihuahua (80,000), and the Federal District (72,000). Tlaxcala has the fewest, with just over 3,200, followed by Tabasco with about 4,500.

The states with the highest percentage of foreigners are mostly along the US border. Baja California leads with 3.9%, followed by Chihuahua (2.3%), Tamaulipas (1.9%), and Sonora (1.7%). Interestingly, the other border state, Coahuila, has relatively few foreigners, only 0.8%. Other states with relatively large percentages are either historical sources of immigrants to the USA or retirement havens like Colima (1.44%), Quintana Roo (1.40%), Nayarit (1.35%), Zacatecas (1.22%), Jalisco (1.14%) and Michoacán (1.10%).

Tabasco has the fewest foreigners as a percentage with only 0.20%, followed by Tlaxcala (0.28%), Veracruz (0.30%), the State of México (0.33%) and Yucatán (0.36%). Yucatán is a surprise on this list because there is a very large and active foreign retirement community there. Perhaps many of these retirees were away from Mexico when the census was taken in the summer of 2010.

What states experienced the largest increases in foreigners in the last decade? The number of foreigners grew fastest in those states with relatively few foreigners in 2000, namely Hidalgo (up 402% over the decade), Tlaxcala (333%), Tabasco (281%), and Veracruz and Oaxaca (both with 272%).

Related posts:
Apr 042011
 

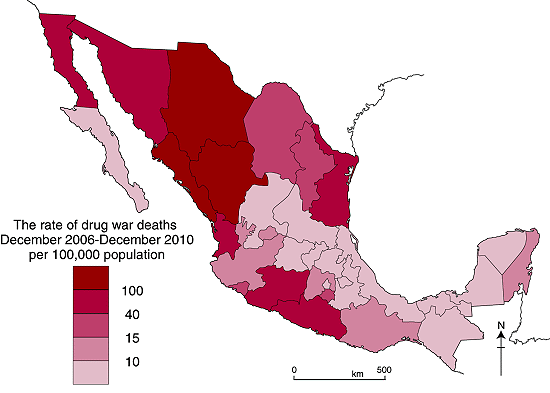
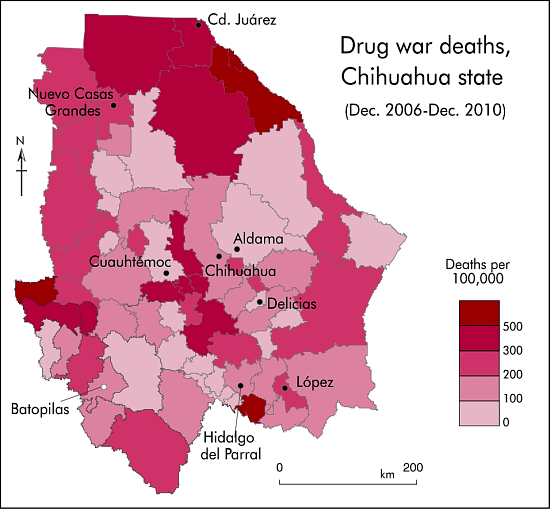
The map (below) of drug war death rates for the 67 municipalities of Chihuahua reveals a rather complicated pattern that is not amenable to easy explanation.

There is a clear cluster of very high death rate municipalities around Ciudad Juárez, which has for years been the main focus of drug violence in Mexico.

Drug war deaths in the state of Chihuahua
Drug war deaths in Chihuahua (Dec. 2006—Dec. 2010). Cartography: Tony Burton; all rights reserved.

There is also a group of high death rate municipalities west and south of Chihuahua City suggesting that it might be a center of significant drug cartel activity.

The reason for high death rate areas on the western and southern borders of Chihuahua is not readily apparent from the map, though they do coincide with the area of lowest HDI (Human Development Index) scores in the state (see Geo-Mexico, figure 29.3).

This south-western part of the state forms part of the Western Sierra Madre physiographic region (see map linked to above), an area of rugged relief with limited highway connections where rivers have carved giant canyons (such as the Copper Canyon system) into the forested plateaus and mountains. The “culture of violence” in this region, sometimes called Mexico’s “Golden Triangle”, was analyzed by Carlos Mario Alvarado in “La [Sierra] Tarahumara, una tierra herida: análisis de la violencia en zonas productoras de estupefacientes en Chihuahua”  (The Tarahumara Sierra, a wounded land: analysis of the violence in narcotic drug production zones in Chihuahua) published by the state government in 1966.

Alvarado found that between 1988 and 1993, in the southernmost municipality of Guadalupe y Calvo and in neighboring drug-growing municipalities, murders had a bimodal distribution each year, with peaks in April-May-June (when poppies and marijuana are planted) and September-October-November (when they are harvested). The four-year drug-violence death-rate for those municipalities in the early 1990s was significantly higher than the four-year drug war deaths ration shown on the map for 2006-2010.

Guadalupe y Calvo, “one of the most violent municipalities in Mexico”, had a four-year rate for 1991-1994 of about 510/100,000 inhabitants. Batopilas’s rate, 478/100,000, was almost as high. The rate in Morelos, sandwiched between these two municipalities, was over 700/100,000. On this limited evidence, it does not appear that this region has actually become any more violent than it used to be!

Returning to the map, it is also interesting that there are some relatively low death rate areas along the rather isolated Mexican-USA border in eastern Chihuahua. Careful analysis of the Chihuahua highway network does not provide any real insights to explain the mapped pattern.

There is some good news. For the 2007-2010 period, five of Chihuahua’s 67 municipalities did not experience a single drug war related death, though they are all very small municipalities with an average population of about 2,000.

Finally, we should remember that even the lightest areas on the map represent municipalities with death rates quite high compared to the rest of Mexico. Five of the municipalities in this group of 18 have death rates over twice the national average and 12 are above the average.

Previous posts in this mini-series:

Geo-Mexico: the geography and dynamics of modern Mexico discusses drug trafficking in several chapters. A text box on page 148 looks at trends in the drug trafficking business and efforts to control it. Buy your copy today to have a handy reference guide to all major aspects of Mexico’s geography!

Mexico’s population pyramid (age-sex diagram) for 2010

 Updates to Geo-Mexico  Comments Off on Mexico’s population pyramid (age-sex diagram) for 2010
Mar 102011
 

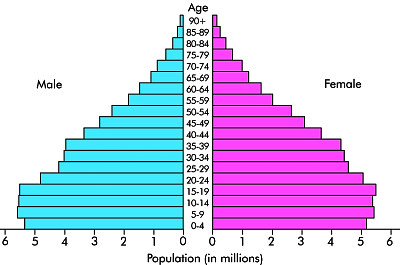
The population pyramid for Mexico in 2010 is shown below:

Mexico's population pyramid, 2010. Data: INEGI

What does this pyramid tell us about Mexico’s population and possible future trends?

The number of babies born during the last 20 years has been more or less equal for each 5-year period. This is despite a higher number of females in the age-bearing categories (15-45). These two statements, taken together, must imply that both birth rates (number of births/1,000 people) and fertility rates (number of children per female of child-bearing age) have fallen and continue to fall.

There are numerous implications for a population with a declining number of babies. Perhaps the most obvious is that fewer school places will be required in ten years time than are currently needed. In Mexico’s case, it is unlikely that school buildings will be closed (at least not in the short to mid-term) since many government-run schools currently house two independent school populations, one attending classes every morning, and the other attending classes in the afternoons.

The decline in babies also means that the average age of Mexico’s population continues to rise. The median age of Mexico’s 112.3 million inhabitants is now 26 years (i.e. half the population is older than 26 years, the other half is 26 years or younger).

Several chapters of Geo-Mexico: the geography and dynamics of modern Mexico discuss additional insights into Mexico’s population dynamics and trends, and their implications for future development. An earlier post here includes a link to a pdf file showing Mexico’s population pyramid in 1990, and the predicted pyramid for 2050. The 2050 pyramid shows just how fast Mexico’s population will age if present trends continue.

Remittances sent back to Mexico rose only 0.12% in 2010

 Updates to Geo-Mexico  Comments Off on Remittances sent back to Mexico rose only 0.12% in 2010
Feb 122011
 

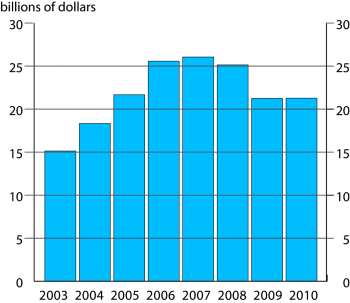
The graph below shows the trend in the total value of remittance payments sent home by Mexican migrant workers employed in the USA.

Remittances to Mexico, 2003-2010

Remittances to Mexico, 2003-2010

The graph shows how the total value of remittances sent home to Mexico rose rapidly from 2003 to 2007 before declining slightly in 2008 and then crashing in 2009 as the full effects of the recession in the USA became apparent. The good news for 2010 is that remittances have increased slightly; the bad news is that the increase is very, very small. Remittances remain well below their 2007 level.

The total value of remittances in 2010 was 21.271 billion dollars. Given change in the dollar-peso exchange rate over the year, and even before considering the impact of inflation, families that received the same number of dollars in 2010 as in 2009 were actually significantly worse off, with the lowest income families hit disproportionately hard.

Of the 32 states, the following 13 states all had lower remittances in 2010 than in 2009:

  • Chiapas
  • Hidalgo
  • Veracruz
  • State of México
  • Nuevo León
  • Tamaulipas
  • Tabasco
  • Chihuahua
  • Querétaro
  • Campeche
  • Nayarit
  • Puebla
  • Oaxaca

The “winners” who received more remittances in 2010 than in 2009 were:

  • Baja California
  • Baja California Sur
  • Sonora
  • Aguascalientes
  • Colima.

Related posts on this bog:

Migration between Mexico and the USA is the focus of chapter 25 of Geo-Mexico: the geography and dynamics of modern Mexico. Ask your library to buy a copy of this handy reference guide to all aspects of Mexico’s geography today! Better yet, order your own copy…

Feb 092011
 

Previous posts in this mini-series analyzed the recently released data on drug war deaths for Mexican states, the largest cities, and the communities with the highest death rates per 100,000 population. This post looks into the number and rates of drug war deaths for 25 communities with large numbers of non-Mexican (ex-pat) residents or visitors. Drug war deaths include deaths of drug cartel members, law enforcement personnel, and innocent by-standers.

Drug war death rates of larger communities of particular ex-pat interest were addressed in an earlier blog which focused on municipalities with populations over 750,000. The table (link above) indicates the number drug war related deaths (from December 2006 through December 2010) and the rate per 100,000 population in the 25 municipalities.

In general, these municipalities have death rates below the national average. The rates for Xalapa, La Paz, and Los Cabos are less than one eighth the national average. Those for Guanajuato and San Miguel de Allende are almost as good. Apparently, foreigners in these communities have relatively little to worry about with regard to drug war violence.

Only six of the 25 have death rates above the national average. Mazatlán has the highest drug war death rate, about four times the rate for all of Mexico, but still less than a fourth that of Ciudad Juárez. The rate for Playas de Rosarito is also very high, even higher than that of its northern neighbor Tijuana. Interestingly, its southern neighbor Ensenada has a low rate, about one eighth that Playas de Rosarito.

The drug war death rate for Tepic, Nayarit is over twice the national average. The rates are also relatively high for Cuernavaca and Nuevo Laredo. Actually, the rate for Nuevo Laredo is less than most of the smaller municipalities surrounding it. There is considerable variation among three adjoining municipalities near Lake Chapala: Ixtlahuacan (43.8), Jocotepec (28.5) and Chapala (18.4). All three have rates many times higher than the nearby city of Guadalajara (9.7).

I wonder how much these drug war death rates are affecting or will affect the choices that foreigners make concerning where to live or where to vacation in Mexico?

Previous posts in this mini-series:

Related posts about the geography of drug trafficking and drug cartels in Mexico:

Geo-Mexico: the geography and dynamics of modern Mexico discusses drug trafficking in several chapters. A text box on page 148 looks at trends in the drug trafficking business and efforts to control it. Buy your copy today to have a handy reference guide to all major aspects of Mexico’s geography!

Which communities in Mexico have the highest rates of drug war deaths?

 Updates to Geo-Mexico  Comments Off on Which communities in Mexico have the highest rates of drug war deaths?
Feb 052011
 

Guadalupe, in the state of Chihuahua, with 139 deaths among a population of only 6,458, has the highest drug war death rate in Mexico: 2,152 drug deaths per 100,000 population. Mier (Tamaulipas) and General Treviño (Nuevo León) are not far behind. Most of the municipalities in the attached table (link below) have rather small populations; 15 of the municipalities had fewer than 6,500 inhabitants in 2010.

A previous post noted that among big cities, Ciudad Juárez had the highest rate of drug war deaths by far, over twice the rate for the runner-up Culiacán in Sinaloa. However, Ciudad Juárez ranks only 10th when smaller municipalities are included in the analysis. The table lists the 20 municipalities with the highest rates of drug war related deaths (from December 2006 through December 2010) per 100,000 population. Drug war deaths include deaths of drug cartel members, law enforcement personnel, and innocent by-standers.

All 20 municipalities listed in the table are in one of four border states: Chihuahua, Sonora, Nuevo León and Tamaulipas. In fact, half of the 20 municipalities are in the state of Chihuahua. Five form a cluster around Ciudad Juárez on the border and four are just south of Chihuahua City. The three in Tamaulipas and three in Nuevo León are bunched together between Nuevo Laredo and Reynosa within 60 kilometers of the border. Three of the four in Sonora are not far from the highway joining the state capital Hermosillo with Nogales on the US border.

Previous posts in this mini-series:

Related posts about the geography of drug trafficking and drug cartels in Mexico:

Geo-Mexico: the geography and dynamics of modern Mexico discusses drug trafficking in several chapters. A text box on page 148 looks at trends in the drug trafficking business and efforts to control it. Buy your copy today to have a handy reference guide to all major aspects of Mexico’s geography!

Trends in income distribution in Mexico: are the poor getting poorer?

 Excerpts from Geo-Mexico, Updates to Geo-Mexico  Comments Off on Trends in income distribution in Mexico: are the poor getting poorer?
Feb 032011
 

Many proponents of the North American Free Trade Agreement (NAFTA) which came into effect in 1994 argued that it would stimulate Mexico’s economic development, leading to an increase in employment, and (in due course) higher wages. This would have a beneficial effect for the entire workforce but the effect would be most pronounced among the poorest 20%. It would help reduce the differential between their incomes and those of the middle income earners.

Opponents of NAFTA argued that free trade would have the opposite effect and would lead to a widening gap between the haves and the have-nots.

Which argument is right? Has the gap widened or narrowed?

Research addressing this question reveals the complexity of the issue. Complicating the situation is the economic instability which followed the passage of NAFTA as well as the significant urban–rural and regional inequality that persists in Mexico. Available data suggest that inequality increased during the 1980s and again slightly between 1996 and 1998 but inequality then declined until 2002. This decline appears to have continued. A chart published last year in The Economist (11 September 2010) shows a decline in Mexico’s Gini coefficient (ie a decline in inequality) of almost 1% between 2000 and 2006.

Researchers conclude that the giant gap between rich and poor will not decline naturally as the economy grows, but will require specific policy actions.

The overall impact from the global economic downturn which started in 2008 is not yet clear but past experience suggests that the gap tends to decline during economic hard times. Some economists argue that a trend of a widening gap between rich and poor was already evident in the years prior to NAFTA. If so, this suggests that globalization and Mexico’s support for free trade are not the only factors responsible for the apparently growing disparities of wealth in the country.

Even if the disparities are widening, it does not necessarily mean that the poor are getting poorer. It is perfectly possible that their real incomes (and standards of living) could increase, by say 10%, while those at the top increase by 15%. Both groups would therefore be getting richer, even though the gap between them widened. On the other hand, it is possible that both could be getting poorer, with the gap increasing or declining. Clearly, income data are difficult to analyze and we should be very cautious to avoid making any overly-simplistic statement about the poor getting poorer.

Is drug war violence concentrated in Mexico’s largest cities?

 Updates to Geo-Mexico  Comments Off on Is drug war violence concentrated in Mexico’s largest cities?
Feb 012011
 

It is commonly believed that crime and murder rates are highest in the largest cities. Is this the case for Mexican drug war deaths? Recently available data (from Mexican government) on drug war deaths indicate that this generalization is definitely NOT TRUE for Mexico’s largest cities. Drug war deaths include deaths of drug cartel members, law enforcement personnel, and innocent by-standers.

True, the largest numbers of deaths were recorded in some of the larger cities: Ciudad Juárez (6,637 deaths), Culiacán in the state of Sinaloa (1,890), Tijuana (1,667), Chihuahua City (1,415), and Acapulco (661). On the other hand, the number of deaths per 100,000 population was four to five times higher in some small municipalities in the states of Chihuahua, Sonora, Tamaulipas, and Nuevo León. A future post will take a more in-depth look at the drug war death rates in these smaller communities.

In this post, we consider only those Mexican municipalities whose 2010 population exceeded 700,000. The table below indicates drug war death rates per 100,000 population since December 2006 for the 22 Mexican municipalities with 2010 populations over 700,000. It is no surprise that the rate for Ciudad Juárez (484.7) is the highest, about 16 times the national average of 30.8. The city accounted for about 30% of the country’s drug war deaths during the four year period. In general, the cities with the highest rates are in the northern or western areas with concentrated drug cartel activity. However, Saltillo in the northern state of Coahuila has one of the lowest rates.

Only six of the largest 22 municipalities in the table have death rates above the national average. Monterrey is just below the average, Guadalajara is less than a third the average and Mexico City is less than a quarter. Two Mexico City suburbs, Nezahualcoyotl and Ecatepec in the State of Mexico, have rates nearly twice that of the capital, but are still less than half the national average. Zapopan, a suburb of Guadalajara has a rate 36% higher than Guadalajara.

Puebla, the center of the fourth largest metropolitan area in the country has an extremely low rate, less than 3% of the national average. Querétaro and Mérida also have very low rates.

Our next post in this mini-series will look at the smaller municipalities which tend to have the highest drug war death rates of all.

Previous posts in this mini-series:

Related posts about the geography of drug trafficking and drug cartels in Mexico:

Other relevant link

Geo-Mexico: the geography and dynamics of modern Mexico discusses drug trafficking in several chapters. A text box on page 148 looks at drug trafficking business and efforts to control it. Buy your copy today to have a handy reference guide to all major aspects of Mexico’s geography!

The rates of drug war deaths vary enormously in Mexico’s states

 Updates to Geo-Mexico  Comments Off on The rates of drug war deaths vary enormously in Mexico’s states
Jan 292011
 

Despite what some media reports might suggest, not all parts of Mexico are plagued with serious drug war violence. A previous post – Deaths from war on drugs have increased rapidly since 2006 – discussed which states accounted for the most drug war deaths during the last four years and noted that these states were mostly in northern and western Mexico. The data on drug war deaths include deaths of drug cartel members, law enforcement personnel, and innocent by-standers.

A more accurate way to compare states is to incorporate population to determine the rates of drug war deaths. The table above, and the map below, were compiled using the recently released data on deaths and the preliminary results of the 2010 census. There are some obvious methodological issues associated with combining drug war death figures for a four-year period with a population “snap shot” taken in mid-2010, but we believe these issues are minor and will not have any significant effect on the broad patterns of drug war deaths that the analysis reveals.

Drug war death rates, by state, December 2006-December 2010

The national average rate is 30.81 deaths per 100,000 population. It is not surprising that the State of Chihuahua, which led the country with 10,135 deaths, had the highest rate, almost 300 deaths per 100,000 population. The rate for Chihuahua is almost ten times the rate for the country as a whole. The rates for the other leading drug war states are significantly smaller, but way above the national average.

The four most populous states, Mexico, Federal District, Veracruz and Jalisco, are centrally located and have death rates ranging from half the national average for Jalisco down to about a fifth for Veracruz. Interestingly, for these four states the rates decline from west to east. This pattern does hold when less populous intervening states are included. Two of these, Querétaro and Puebla have about the lowest rates in the country, about one-fifteenth the national average.  Yucatán also has a very low rate. The drug war death rates for Tlaxcala, Puebla and Yucatán are less than one half of one percent of the rate in Chihuahua. Clearly, some parts of the country are far more affected by drug wars than others.

Previous post in this mini-series:

Related posts about the geography of drug trafficking and drug cartels in Mexico:

Other relevant link

Geo-Mexico: the geography and dynamics of modern Mexico discusses drug trafficking in several chapters. A text box on page 148 looks at the drug trafficking business and efforts to control it. Buy your copy today to have a handy reference guide to all major aspects of Mexico’s geography!

Deaths from war on drugs have increased rapidly since 2006

 Updates to Geo-Mexico  Comments Off on Deaths from war on drugs have increased rapidly since 2006
Jan 262011
 

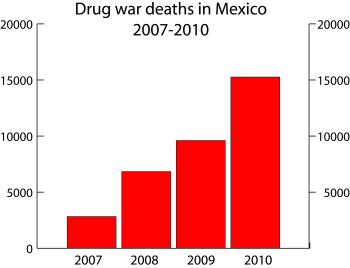
The Mexican Government recently released data on all the deaths in Mexico linked to drug wars for the period December 2006, when the drug wars started, through December 2010. The data include deaths of drug cartel members, law enforcement personnel, and innocent by-standers.  According to the data, 34,612 were killed in Mexico during this four year span, with 2010 being by far the most violent year with 15,273 deaths, 44% of the four year total. The 2010 total was 59% higher than 2009.

The graph below shows how rapidly the number of deaths resulting from the war on drugs has escalated. The crucial question now is, “Will drug war deaths continue to accelerate rapidly in 2011?”

Drug war deaths, 2007-2010

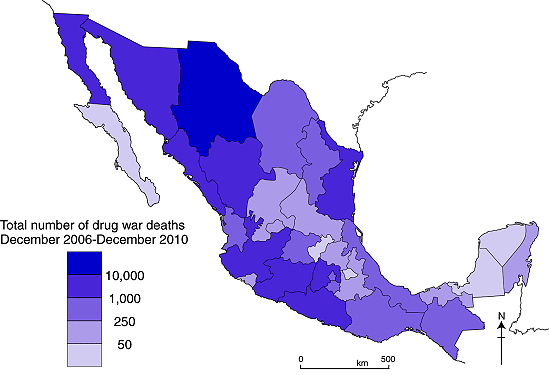
Not surprisingly, Chihuahua, led all other states with 10,135 deaths during the four year period, almost 30% of the total. In 2010 alone 4,427 were killed in Chihuahua, up 32% from 2009. This is a large one year acceleration in violence, but only about half the national increase of 59%. Most of the deaths in Chihuahua were in Ciudad Juarez, with 6,637, and Chihuahua City with 1,415. A later post in this mini-series will investigate drug war deaths in Mexico’s major cities. The map below shows the total number of deaths state-by-state for the period December 2006-December 2010.

Map of total drug war deaths 2007-2010
Map of total drug war deaths, December 2006-December 2010

As can be seen from the map, other states with very large numbers of deaths were Sinaloa (4,387 deaths, up 71% in 2010), Guerrero (2,736, up 29%), and Baja California (2,019 – 1,667 in Tijuana). Next came Durango (1,892 deaths), Michoacán (1,751, down 12%), State of Mexico (1,538), Tamaulipas (1,475), and Sonora, (1,258).

Tamaulipas burst onto the drug war scene in 2010 with 1,209 deaths in 2010 compared to “only” 90 in 2009, an increase of 1243%. The state with the greatest increase was San Luis Potosí which went from 8 deaths in 2009 to 135 in 2010, an increase of 1588%. The figure for 2010 alone was 72% of the four year total. Other states experiencing extremely rapid increases were Nayarit (919%) and Baja California Sur (900%), and Nuevo León (454%).

States with over 1,000 drug war deaths are all located in northern or western Mexico except for the centrally located State of Mexico, and perhaps Guerrero which might be considered a southern state.

At the other end of the spectrum, the states recording the fewest deaths during the four year period were Tlaxcala (13 deaths), Baja California Sur (19), Yucatán (26), Campeche (31) and Querétaro (37). While these were the least affected by drug war violence, the number of deaths in these states was still significant. During 2009 and 2010, Yucatán had only three deaths while Tlaxcala had ten and Baja California Sur had 11.

Related posts about the geography of drug trafficking and drug cartels in Mexico:

Geo-Mexico: the geography and dynamics of modern Mexico discusses drug trafficking in several chapters.  A text box on page 148 looks at drug trafficking business and efforts to control it.  Buy your copy today to have a handy reference guide to all major aspects of Mexico’s geography!

Population change in the Guadalajara Metropolitan Area

 Updates to Geo-Mexico  Comments Off on Population change in the Guadalajara Metropolitan Area
Jan 252011
 

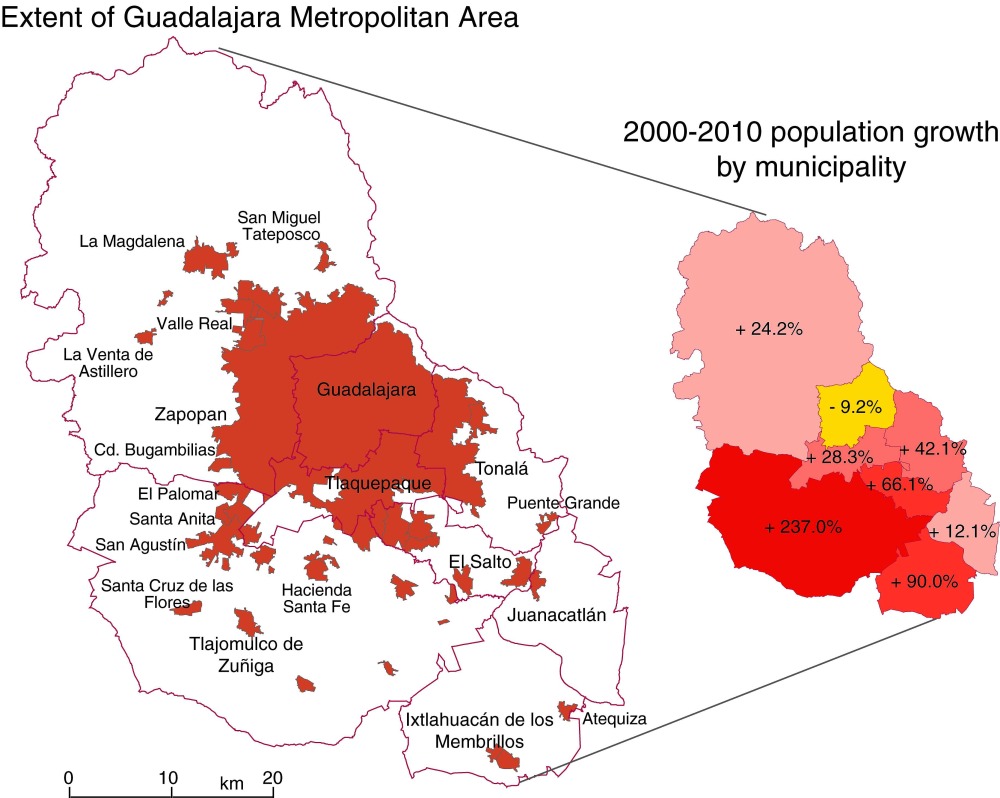
The preliminary results of Mexico’s 2010 population census reveal that the population residing in the Guadalajara Metropolitan Area (GMA) increased from 3.7 million in 2000 to 4.4 million in 2010. The census results also show clearly that the GMA is continuing to experience the effects of suburbanization and counter-urbanization.

Suburbanization is the gradual spread of the urban area into the surrounding rural areas. The built-up area of Guadalajara is spreading mainly to the south and west. The north-eastern part of the city is unable to spread beyond its existing extent because it is hemmed in by the precipitous canyon of the River Santiago, often referred to as La Barranca de los Oblatos (Oblates‘ Canyon).

Counter-urbanization is the movement of city dwellers into smaller settlements in the surrounding countryside. With time, some of these smaller settlements are eventually engulfed by the spreading city. The precise boundaries of large metropolitan areas such as the GMA are therefore subject to almost constant change. The map below shows the population change for Guadalajara and its surrounding municipalities for the period 2000-2010.

Guadalajara Metropolitan Area
Population change in the Guadalajara Metropolitan Area, 2000-2010. Click to enlarge.

Note, first, that the population of Guadalajara proper (the municipality of that name) has actually declined significantly since 2000, from 1,647,720 to 1,494,134.

The city is not bounded by the municipal boundary, but spreads into several adjoining municipalities (see map), all of which have experienced population growth between 2000 and 2010. The municipality of Tlaquepaque was already “built up”, even prior to 2000, and its population has risen only slowly since that date. The slowest rate of growth (excluding the “negative growth” of Guadalajara) is in Zapopan; this is a complete change from 30 years ago when Zapopan was growing very rapidly as Guadalajara expanded westwards.

In the 1980s and 1990s, Guadalajara also spread into Tonalá and El Salto. El Salto, relatively close to Guadalajara’s international airport, and close to the main Guadalajara-Mexico City highway, is the heart of a major industrial corridor.  Its main focus in recent years has been on high-tech firms; the region is often referred to as “Mexico’s Silicon Valley”. Firms with manufacturing and/or assembly plants in or close to El Salto include Hewlett-Packard, IBM, General Electric, Intel, Hitachi, Siemens, Flextronics and Solectron. The El Salto area has seen moderate growth over the last ten years.

By far the most dramatic rates of growth for 2000-2010 occurred in Ixtlahuacán de los Membrillos. and in Tlajomulco de Zuñiga, which more than tripled its population in just ten years, from 123,220 to 416,552. Tlajomulco is a very old settlement indeed, with considerable historical importance. The spread of Guadalajara’s suburbs into the northern part of Tlajomulco has been astonishingly rapid, and represents a classic case of the process of suburbanization. Meanwhile, the population of the long-established settlement of Tlajomulco (further south in the eponymous municipality) has also risen rapidly as some urban dwellers choose, in the process of counter-urbanization, to live slightly outside the main urban sprawl of Guadalajara. The counter-urban movement is strongest in the settlements relatively close to the city, but now extends at least 50 km to the south, to the villages on the northern shore of Lake Chapala.

What will 2010-2020 bring? There are few signs that the building boom along the southern edge of Guadalajara Metropolitan Area is going to come to a halt any time soon. The state of Jalisco plans to construct an “outer ring road” south of the city. The planned route passes very close to the settlement of Tlajomulco. It is surely only a question of time before Tlajomulco, and various other small towns and villages, are swallowed up by the continuing expansion of Mexico’s second largest city.

Mexico’s major metropolitan areas and cities, 2010

 Updates to Geo-Mexico  Comments Off on Mexico’s major metropolitan areas and cities, 2010
Dec 092010
 

The table shows the population figures for Mexico’s 14 largest metropolitan areas, according to the preliminary results of the 2010 census. Mexico currently has 11 metropolitan areas with a population in excess of one million inhabitants. Three other cities have over 900,000 inhabitants, and look set to join the million-plus club within the next few years. A further seven cities—Saltillo, Chihuahua, Acapulco, Morelia, Cuernavaca,Tampico and Veracruz—have populations between 800,000 and 900,000.

1Mexico City (Valley of Mexico)20,137,152
2Guadalajara4,434,252
3Monterrey4,080,329
4Puebla-Tlaxcala2,668,347
5Toluca1,846,602
6Tijuana1,751,302
7León1,609,717
8Cd. Juárez1,328,017
9Torreón-Gómez Palacio (La Laguna)1, 215,993
10Querétaro1,097,028
11San Luis Potosí1,040,822
12Mérida970,495
13Mexicali936,145
14Aguascalientes932,298

Chapters 21 and 22 of Geo-Mexico: the geography and dynamics of modern Mexico analyze Mexico’s 500-year transition to an urban society and the internal geography of Mexico’s cities. Chapter 23 looks at urban issues, problems and trends. To preview more parts of the book, click here and use amazon.com’s “Look Inside” feature; buy your copy today!

Map of population change in Mexico, 2000-2010

 Updates to Geo-Mexico  Comments Off on Map of population change in Mexico, 2000-2010
Dec 072010
 

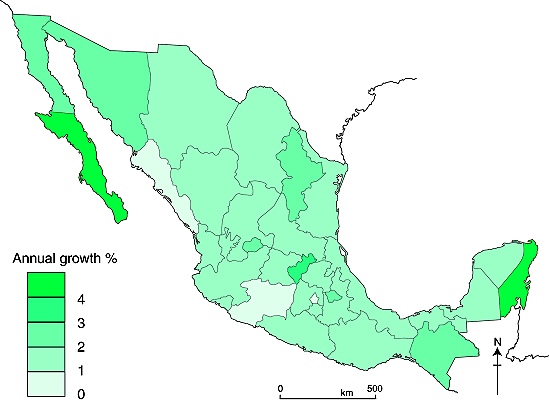
The publication of the preliminary results from this year’s population census has allowed us to update our map of Mexico’s recent population change (Figure 8.3 of Geo-Mexico: the geography and dynamics of modern Mexico). We are delighted to bring you what may be the first map to be published anywhere in the world of Mexico’s population change over the past decade:

Annual % population change in Mexico, 2000-2010

Annual % population change in Mexico, 2000-2010. Cartography: Tony Burton, all rights reserved.

The pattern on this map for 2000-2010 shows that population change over this period has been broadly similar to that for the period 1970-2005 (Figure 8.3 of Geo-Mexico: the geography and dynamics of modern Mexico). Mexico’s total population has grown by an average of 1.52%/yr over the past decade.

Things to note:

The fastest growth rates are in Baja California Sur and Quintana Roo, both states where tourism continues to develop rapidly and attract more migrants.

The slowest rates are in the Federal District (Mexico D.F.), Michoacán and Sinaloa, all of which have rates of less than 1%/yr. Michoacán’s low rate of increase is an anomaly, given the state’s high birth rate, and must be due to out-migration.

In central Mexico, the state of Querétaro stands out as being the most dynamic state in population terms, registering a growth of more than 3%/yr over the last decade.

Discussion Question: How does this map compare to the map of GDP/person?

Several chapters of Geo-Mexico: the geography and dynamics of modern Mexico discuss population issues, including population growth, distribution and density. Buy your copy today to have a handy reference guide to all major aspects of Mexico’s geography!

Nov 292010
 

According to the Environment Ministry, Mexico generates 94,800 tons of garbage a day, which equates to 34.6 million tons a year. Of this total, 53% is organic and 28% recyclable (paper and cardboard 14% of total garbage, glass 6%, plastics 4%, metals 3% and textiles 1%). The remaining 19% of total waste is comprised of non-recyclable construction waste, leather, rubber and miscellaneous other items.

Authorities claim that 87% of all wastes are now collected but, unfortunately, only about 60% ends up in authorized landfills.

Previous posts about garbage”

Mexico’s environmental trends and issues are examined in chapter 30 of Geo-Mexico: the geography and dynamics of modern Mexico. Ask your library to buy a copy of this handy reference guide to all aspects of Mexico’s geography today! Better yet, purchase your own copy…

How many Mexicans are there? The preliminary figures from Mexico’s 2010 national population census

 Updates to Geo-Mexico  Comments Off on How many Mexicans are there? The preliminary figures from Mexico’s 2010 national population census
Nov 262010
 

The National Statistics Institute (INEGI) has released the preliminary figures from Mexico’s 2010 national population census. INEGI claims that its 190,000 census workers were able to visit 98.4% of all homes in the country. The lowest response rates were 91.3% and 91.5% respectively in the troubled northern border states of Tamaulipas and Chihuahua.

Update: 2020 – Total population is about 126 million.

The highlights of the preliminary results

The preliminary results of the 2010 census reveal some interesting changes.

First, Mexico’s total population in 2010 is  112,322,757. This is almost 4 million higher than INEGI’s pre-census estimates. The population total means that Mexico remains the world’s 11th most populous country.

Mexico has now become a markedly urban society. Whereas a hundred years ago, in 1910, 71.3% of the then population of 15.2 millions lived in rural areas (defined as municipalities with fewer than 2,500 inhabitants), in 2010, 62.6% of all Mexicans live in one of the country’s 56 largest metropolitan areas (as defined by INEGI). The largest single metropolitan area is the Mexico City Metropolitan Area (which extends into the State of Mexico) with a population of 20.1 million.

The density of population has changed over the last century as well. In 1910, the overall density of population was 8 persons/square kilometer. In 2010, the density of population was 57 persons/square kilometer (with Mexico D.F. having the highest value in Mexico of 5,937 inhabitants/square kilometer!).

Emigration in search of work, and a declining maternal mortality rate have completely changed Mexico’s male/female ratio. Whereas in 1910, there were 102.7 males for every 100 females, in 2010 there are  95.5 males for every 100 females.

As more figures are released in coming months, we will offer further insights into the changing geography of Mexico.

In the meantime, for a comprehensive summary of Mexico’s geography, including several chapters about Mexico’s population, ask Santa Claus, a friend or family member to give you a copy of Geo-Mexico: the geography and dynamics of modern Mexico. What better seasonal gift could there possibly be?

How important are remittances to Mexico’s economy?

 Updates to Geo-Mexico  Comments Off on How important are remittances to Mexico’s economy?
Nov 202010
 

There are millions of Mexican workers in the USA who send a sizable portion of their wages back to their families in Mexico. On a per person basis, Mexico receives more worker remittances than any other major country in the world.

States receiving the most remittances (highest value)

The ten states receiving the most remittances (by value). All rights reserved.

An estimated 20% of Mexican residents regularly receive some financial support from workers abroad. Such remittances are the mainstay of the economies of many Mexican communities, such as many rural areas in Durango, Zacatecas, Guanajuato, Jalisco and Michoacán. Studies suggest that the funds sent as remittances are mostly spent on housing, food, clothing and durable consumer goods. A growing portion is being invested in education and small businesses. The corollary is that only a small percentage goes towards savings.

In 2008, remittances flowing back to Mexico exceeded $25 billion.The value of remittances fell slightly in 2009, according to World Bank figures, but are forecast to increase again this year. Only India and China, both with far higher populations than Mexico, have larger sums of remittances entering their economies.

According to figures published in The Economist (13-19 November 2010), remittances in Mexico are equivalent to 2.5% of the nation’s GDP. Mexico’s degree of reliance on remittances is greatly exceeded by the comparable figures of 22.4% of GDP for Lebanon, 11.8% for Bangladesh, 11.7% in the Philippines, 7.0% in Vietnam, 6.0% in Pakistan and 3.9% for India. (In China, remittances account for only 1.0% of GDP).

Related posts on this bog:

Migration between Mexico and the USA is the focus of chapter 25 of Geo-Mexico: the geography and dynamics of modern Mexico. Ask your library to buy a copy of this handy reference guide to all aspects of Mexico’s geography today! Better yet, order your own copy…

Job recovery in the USA for foreign-born workers

 Updates to Geo-Mexico  Comments Off on Job recovery in the USA for foreign-born workers
Nov 102010
 

Recent data indicate that between June 2009 and June 2010 foreign-born workers in the USA gained 656,000 jobs while native-born workers lost 1.2 million jobs. Foreign-born Hispanics gained 392,000 new jobs, but their pay declined by 5.8%. The majority of foreign-born Hispanics are from Mexico. Assuming Mexicans obtained a big share of these employment gains, we can expect that immigration from Mexico is increasing from the relatively low numbers observed in 2008 and 2009.

During the deepest part of the recession, between June 2008 and June 2009, jobs held by foreign-born workers in the USA fell by 1.1 million. Looking at the two year period between June 2008 and June 2009, foreign-born workers lost about 400,000 jobs while native-born workers lost 5.7 million jobs. Apparently, employers prefer to hire lower paid, temporary foreign-born (Mexican) workers than native-born workers who are more apt to demand higher pay and benefit packages.

Source

R. Kochhar, C.S. Espinoza, and R. Hinze-Pifer, “After the Great Recession: Foreign Born Gain Jobs; Native Born Lose Jobs”, Pew Hispanic Center, Washington DC, Oct. 29, 2010 (pdf file).

Migration between Mexico and the USA is the focus of chapter 25 of Geo-Mexico: the geography and dynamics of modern Mexico. Ask your library to buy a copy of this handy reference guide to all aspects of Mexico’s geography today! Better yet, order your own copy…

The impact of the economic recession on Mexico-USA migration

 Updates to Geo-Mexico  Comments Off on The impact of the economic recession on Mexico-USA migration
Nov 032010
 

Mexicans have been migrating from Mexico to find better employment for decades. Virtually all of this migration, over 95%, is to the USA. Migration to the USA accelerated rapidly after about 1970. Throughout this period, there has been a strong current of return migration back to Mexico. At present there are about 12 million Mexican-born residents of the USA.

The net flow of migrants peaked at about 550,000 in 2006-07.  That year over one million Mexicans entered the USA and just under 500,000 returned to Mexico. However, the recent economic recession had a strong negative impact on immigration from Mexico.

The net flow 2007-08 was down to about 375,000, with just over 800,000 entering and about 440,000 returning to Mexico. A year later, the net flow was about 200,000, with roughly 635,000 entering and 435,000 returning. Data for 2009-10 are not yet available.

It is interesting to note that in the two year period between 2006-07 and 2008-09 immigration dropped by almost 40%, while return migration declined by less than 10%. Apparently, potential immigrants in Mexico knew that jobs are scarce in the USA and thus they were relatively reluctant to migrate. On the other hand, many Mexicans in the USA appear to be hanging on and making money however possible in an effort to stay in the USA. This is particularly interesting because one might assume that undocumented workers in the USA might be among the first to be laid off.

Source:

J.S. Passel and D. Cohn; “Recession Slows – but Does Not Reverse – Mexican Immigration”, Pew Hispanic Center, Washington DC, July 22, 2009.

Migration between Mexico and the USA is the focus of chapter 25 of Geo-Mexico: the geography and dynamics of modern MexicoAsk your library to buy a copy of this handy reference guide to all aspects of Mexico’s geography today! Better yet, order your own copy…

The debate over GM corn in Mexico

 Updates to Geo-Mexico  Comments Off on The debate over GM corn in Mexico
Oct 192010
 

Until relatively recently, Mexican authorities have staunchly resisted the introduction of GM corn into the country. Significant improvements in Mexico’s wheat and corn yields have been achieved in the past by long-term programs of selective breeding, such as that which was later dubbed the “Green Revolution“.

In 2009, however, Mexico’s Agriculture and Environment Secretariats approved a project financed by transnational seed firm Monsanto involving 30 hectares of  experimental plots in Sonora, Sinaloa and Tamaulipas planted with transgenic corn. Mexico still does not yet permit the commercialization of genetically-modified corn, but Monsanto has indicated publicly that it hopes that current rules will be relaxed as early as 2011. According to Monsanto, the new seed could boost annual corn production in Mexico by between 6 and 7 million tons, roughly the amount lost each year to disease and pests.

The Monsanto project was been widely condemned by environmental groups. A widely-published article earlier this month by journalist Mica Rosenberg offered an overview of how transgenic (GM) corn is clearly on its way into Mexican mainstream agriculture:

The article is disappointingly superficial in many respects, but does provide a useful starting point for discussions about the relative merits of allowing (or not) commercial imports of transgenic corn seed into Mexico.

As we write in Geo-Mexico, Mexican farmers are well aware of the importance of maintaining genetic diversity:

Mexican farmers share concerns about the on-going loss of genetic diversity, especially in native crops. For example, if all corn farmers planted imported hybrid corn seeds, native diversity would quickly be lost. In Tlaxcala, where about 90% of the corn is grown on non-irrigated land and where two-thirds of farmers grow corn only for their own use, local varieties have been selectively bred by farmers not only for their yields but also because of their color, taste, resistance to pests and ability to withstand strong winds or short-term droughts. Such characteristics are not necessarily important to commercial seed producers.

Events in other countries often have unexpected consequences in Mexico. For example, the price of Mexico’s corn imports from the USA has increased sharply as a result of the high subsidies offered in that country for corn-based biofuel and bio-additives. The rising import price of corn led to an increase in the price of tortillas which adversely affected the poorest sectors of Mexican society.

Furthermore, as we wrote in an earlier post, the Mexican government has shown its support for a major project aimed at ensuring that the genetic diversity of corn is preserved for future generations:

Is the introduction of GM corn into Mexico a good idea? Proponents argue that it will lead to higher yields and reduce losses from pests and diseases. In their view, commercial planting of GM corn in Mexico is inevitable and will help Mexico “catch up” with Brazil and Argentina, where GM crops are already being grown. Opponents argue that it will inevitably reduce the genetic diversity of corn, meaning that corn will have less resilience in future to unexpected (and unpredicted) changes (climate, pests, soil conditions, etc). They also argue that GM corn will make corn growers even more dependent on commercial seed producers.

Greenpeace protest against GM corn

Greenpeace protest against GM corn

At least two studies since 2001 have already found transgenic DNA in fields of native Mexican corn. The first, published in Nature in 2001, reported findings from the state of Oaxaca. One oft-expressed fear is that Monsanto’s fierce protection of its GM corn will lead to the company seeking damages from local farmers who are found to have any GM corn mixed into the native corn growing in their fields, even if this is the result of accidental contamination from neighboring fields where GM crops are being legally cultivated.

Mexico’s agriculture is analyzed in chapter 15 of Geo-Mexico: the geography and dynamics of modern Mexico. and concepts of sustainability are explored in chapters 19 and 30.  Buy your copy today, so you have this handy reference guide to all aspects of Mexico’s geography available whenever you need it.

Oct 162010
 

In an earlier post, we looked briefly at Females, males and gender inequality in Mexico.

Gender inequality is unfortunately still alive and well in Mexico. It is often shown through discrimination and human rights violations.

Several women’s empowerment groups aim to change the status quo. Perhaps the most successful to date has been an organization known as Semillas (= seeds). Founded in 1990, Semillas is the shorthand for the NGO Sociedad Mexicana Pro Derechos de la Mujer, A.C. (Mexican Society Pro-Women’s Rights).

In the words of its homepage, Semillas…

“knows that all the different responsibilities and duties that women have as mothers, caretakers, providers, educators, resource generators, politicians, field workers, business owners, social leaders, scholars, artists, etc… make them the fundamental factors of change in their families, communities, and society at large. Semillas is also aware that strengthening Mexican women’s rights builds a more just society, promotes a new culture of equality between women and men, and improves life conditions for generations to come.”

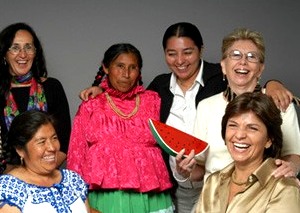
Semillas group of women

Photo credit:Semillas (Sociedad Mexicana Pro Derechos de la Mujer, A.C)

Semillas aims to break the traditional gender inequalities in Mexico through sponsorship of dozens of local initiatives, covering a wide range of development objectives. Since 1990, Semillas have started 237 sustainable development projects, benefiting 650,000 women. Projects are based on the principle of “women helping women”. Semillas funds and supports projects run by women who are already exhibiting leadership qualities in their communities.

For example, one project supports the work of a victim of psychological violence who has spent the last 15 years of her life designing programs to ensure equality of educational opportunity in her home community. This educational equality is not limited to formal schooling, but extends to the sports activities available after-school and at weekends. When our daughter was growing up in Mexico, we learned first-hand in the early 1990s that many smaller, traditional villages in Mexico tend to offer a reasonable variety of sports, such as soccer, only for boys. Rarely is anything equivalent on offer for girls. While the situation is gradually improving (girls’ soccer is becoming one popular option!), there is still a long way to go in many places.

Semillas does not only fund projects concerned with educational equality; other projects focus on health care, female working conditions and legal aid.

The Semillas website has many short articles, images and videos highlighting its work, if you are interested in finding out more about this noteworthy NGO. (It also has a link for donations).

Stop Press! By coincidence, today the Inter Press Service news agency published Four Years On, No Justice for Atenco Women (by Daniela Pastrana). In 2002, Atenco was proposed as the site for a new Mexico City airport, leading to protests by local residents. Eventually, (in April 2008) 11 women brought a case before the Inter-American Commission on Human Rights, involving allegations of torture, sexual violence and illegal deprivation of freedom, all connected to the protest movement. Their case was supported by many NGOs, as well as several winners of the Nobel Peace Prize. Mexico’s Supreme Court ruled earlier this year that the opposition to the new airport was a “legitimate social protest” and ordered the immediate release of those protesters who were still behind bars.

Chapter 29 of Geo-Mexico: the geography and dynamics of modern Mexico is titled “Variations in Quality of Life within Mexico” and discusses many aspects of poverty, including  Gender Inequality. Buy your copy today, or ask your local library to purchase a copy for their collection.

How did the world’s deepest water-filled sinkhole form?

 Updates to Geo-Mexico  Comments Off on How did the world’s deepest water-filled sinkhole form?
Oct 112010
 

In an earlier post, we described the El Zacatón sinkhole, the deepest water-filled sinkhole known at present anywhere on the planet. Such a large sinkhole begs some important questions:

How did such a large sinkhole form?

Most major sinkholes form as a result of the collapse of the ceilings of underground cavities which have been formed by the gradual dissolution of limestone due to percolating acidic rainwater. However, according to Marcus Gary, of the Jackson School of Geosciences at the University of Texas at Austin, who has studied this area since the 1990s, the Zacatón pit is not a conventional sinkhole. He believes that this pit began to form in the Pleistocene period as a result of underground volcanic activity. Volcanism increased the acidity of water deep underground which then gradually ate away at the surrounding limestone in a process known as “hypogenic karstification“. As the underground caverns grew larger, the overlying rock would periodically collapse into them, eventually leaving giant pits extending to the surface above.

Is the sinkhole continuing to get deeper?

Equally interestingly, some of the sinkholes appear to be closing over. All the major sinkholes in Tamaulipas contain lakes and in several cases, they appear to be crusting over with travertine, a form of calcium carbonate which, in the right conditions, can be precipitated out of calcium bicarbonate-rich water. According to Marc Airhart, another researcher at the Jackson School of Geosciences, the process is probably an excruciatingly slow one, but at least one sinkhole (Poza Seca) has closed up entirely, sealing off an underwater lake. This travertine skin may also explain why El Zacatón has floating islands. It seems likely that pioneer species may have colonized small rafts of travertine, beginning the series of ecological processes that resulted in the grassy islands that can be seen there today.

Sources / Further reading:

Mexico’s geology and landforms are analyzed in chapters 2 and 3 of Geo-Mexico: the geography and dynamics of modern Mexico.  Buy your copy of this book today!

Sep 302010
 

Liquefied natural gas (LNG) is natural gas which has been processed to allow for transportation to international markets well beyond the reach of pipelines. The process enables major producers of natural gas such as Australia, Qatar, Indonesia, Malaysia, Brunei, Abu Dhabi and Oman to supply markets almost anywhere in the world.

The stages involved in making and shipping LNG are:

  • 1. Natural gas is extracted from underground deposits.
  • 2. The gas is sent to a processing plant where impurities such as water, oil and carbon dioxide are removed (a process known as  sweetening).
  • 3. The purified gas is cooled to minus 162 degrees C (the temperature of the surface of Saturn). This is accompanied by a dramatic decrease in its volume. The process turns 615 liters of natural gas into a single liter of LNG.
  • 4. The super-cold LNG is kept cold by storage in cryogenic tanks. LNG in this form is not explosive and cannot burn, making it safe to transport.
  • 5. LNG is then transported to markets in special tanks aboard double-hulled tankers. Modern tankers can each transport 50,000 metric tons of LNG.
  • 6. At the market, LNG is put in special tanks where it is allowed to warm up, becoming gaseous again. This gas can then be piped to consumers.

Worldwide, there are currently 17 liquefaction gas terminals preparing LNG for export, and 40 terminals where imported LNG can be reconverted, 35 of them in Japan.

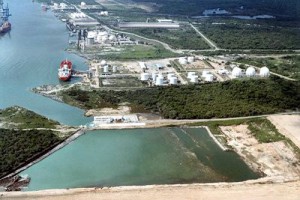
LNG terminal

Altamira LNG terminal. Photo: hydrocarbons-technology.com

Mexico has two existing regasification plants, as well as one currently under construction and several more in the planning stages. Mexico’s first three terminals are in:

  • Altamira, Tamaulipas – this plant opened in 2006 and may be expanded in 2012
  • Ensenada, Baja California – this plant which is 14 miles north of Ensenada opened in 2008
  • Manzanillo, Colima – currently under construction, expected to open in 2011/12

Proposed LNG regasification plants in Mexico are being considered for:

  • Puerto Libertad, Sonora – 60% of the output from this terminal would be piped to the USA, the remainder to cities in northern Mexico
  • Topolobampo, Sinaloa – planned opening date is 2016
  • Offshore of Tamaulipas, in the Gulf of Mexico – this plant would be built 35 nautical miles offshore
  • Lázaro Cárdenas, Michoacán – the proposed LNG terminal would be close to the existing major port
  • Salina Cruz, Oaxaca

LNG means that industries and homes far from Mexico’s own gas fields which are mainly in the north-east of the country can still have access to gas. Supplying them direct from Mexico’s gas fields would require the construction of costly series of pumping stations and pipelines crossing the rugged Western Sierra Madre (Sierra Madre Occidental), where any construction of this kind would be very difficult.

Homicide rates are declining in many Mexican states

 Updates to Geo-Mexico  Comments Off on Homicide rates are declining in many Mexican states
Sep 252010
 

Data from the Mexican National Public Security System (SNSP) indicate that Mexico’s homicide rate has declined by 23% from 37 (homicides per 100,000 population) in 1997 to 29 in 2009. It declined in 20 of Mexico’s 32 states.

The states with the homicide rates below 20 and their change since 1997 are shown below. All of the states listed except two experienced impressive declines since 1997. The two exceptions, Yucatán and Nuevo León, had the lowest homicide rates in the country in 1997. The homicide rates in the majority of these states even declined from 2007 to 2009 when the national homicide rate increased by 20%.

StateHomicide rate per 100,000 population, 2009Change, 1997-2009 (%)
Yucatán11+11
Campeche13–66
Baja California Sur14–59
Veracruz15–39
Zacatecas16–40
Nuevo León16+79
Hidalgo16–39
Federal District16–25
Querétaro17 –57
Colima18–55
Jalisco19–65
México19–63
San Luis Potosí19–11
ALL MEXICO29–23

Most of these states are not heavily affected by Mexico’s drug war violence. While these states have low homicide rates for Mexico, they are not particularly low from an international perspective.  They are about two times the rate in the USA, but about one quarter of those in Colombia.

Believe it or not, homicide rates in Mexico have actually declined since 1997

 Updates to Geo-Mexico  Comments Off on Believe it or not, homicide rates in Mexico have actually declined since 1997
Sep 202010
 

All the recent media attention to drug war violence suggests that homicide rates in Mexico are increasing rapidly. This is undoubtedly true, but only in certain areas. The available data from the Mexican National Public Security System (SNSP) does not uniformly support the contention that homicide rates are on the rise.

SNSP data show that Mexico’s homicide rate has declined by 23% since 1997. It declined for 20 of Mexico’s 32 states.  According to SNSP, the national homicide rate of 37 per 100,000 population declined by 36% to 24 in 2007, before edging up 20% to 29 in 2009, the most recent year for which data available. However, since 2007 the homicide rate has declined in nine states. Clearly, there are enormous differences in homicide rates among Mexico’s states. A future blog will focus on states with low and declining homicide rates.

The increases in some states since 2007 may well be related to drug war violence. The estimated 28,000 drug war deaths reported in the media is significant compared to the 111,000 homicides in Mexico for the four year period 2006–2009.

The states with homicide rates above 40 in 2009 and which have increased since 2006 are shown in the table. Undoubtedly, drug war violence is an important factor in many of these states, particularly Chihuahua, Durango, Sinaloa, Guerrero and Michoacán.

StateHomicide rate per 100,000 population, 2009Increase, 2006–2009 (%)
Durango89865
Chihuahua86177
Sinaloa7540
Guerrero6355
Morelos6046
Michoacán5755
Quintana Roo52124
ALL MEXICO2920

International comparisons are difficult due to differences in definitions and in data collection methods. For example, the fatal shooting of an intruder, death committed in self-defense, or death caused by  a drunk driver may count as a homicide in some countries and not in others. In rough terms, data appear to show that homicide rates in Mexico are about four times those in the USA, but less than half of the rates in Colombia or South Africa.

Is tourism in Mexico expanding?

 Other, Updates to Geo-Mexico  Comments Off on Is tourism in Mexico expanding?
Sep 112010
 

At first sight, this would seem like an easy question to answer but, in fact, it is not exactly clear whether tourism in Mexico in 2010 is increasing, decreasing or holding steady. Flows of tourists are affected not only by any changes in the situation of the destinations (receiving countries) but also by the situation at the point of origin. Most of Mexico’s international visitors come from the USA. This year, many potential tourists have opted to stay at home as a result of the current recession which started in 2008 and worsened in 2009.  On the other hand, the recession may have diverted some tourists to Mexico from more expensive destinations they had originally planned to visit.

Cruise ship

Events within Mexico have also influenced the number of international tourist arrivals. The threat of H1N1 flu in early 2009 kept many international tourists away. Publicity about the violence associated with Mexico’s “drug wars” has accelerated in 2010 and almost certainly diverted some international tourists to other destinations.  On the other hand, some tourists who planned their 2010 summer vacation on the US Gulf Coast may have opted for Mexico after the massive oil spill off Louisiana.  An additional complicating factor is that international tourists only account for about 20% of Mexico’s total tourism revenue. While international tourism gets most of the attention, about 80% of tourism revenues come from national (Mexican) tourists.

Statistical data on tourism can be very difficult to interpret. The World Tourism Organization (WTO) and Mexican tourism agencies use similar international definitions of  a tourist:

  • A tourist as someone who spends at least one night (and less than one year) away from their usual home.

This definition ignores the precise reasons for travel. Hence, international tourism figures generally include travel for all purposes, including visiting family and friends, and business trips, as well as health and religious travel.  All these factors make assessing trends in Mexican tourism an analytical challenge.

In an August 2010 press conference, Mexico’s Secretary of Tourism Gloria Guevara presented data indicating that 818,278 international travelers visited Mexico in the month of June 2010 compared to only 605,435 in June 2009. This increase of 24% seems impressive, but requires closer scrutiny.  International arrivals in January and February 2010 were 5.2% and 5.8% less respectively than the same months in 2009; revenues for those two months were up 21% in peso terms, but actually fell by 7.5% in dollar terms, because of the falling value of the peso. Arrivals in March 2010 were 2.7% higher than March 2009.

Room occupancy rates (the percentage of available hotel rooms actually occupied) in 70 tourist destinations were up 11% for the first six months of 2010 compared to the same period in 2009.  However, 2009 was a very poor year for tourism in Mexico. Only 21.5 million international travelers visited Mexico in 2009, compared to a record 22.6 million in 2008.

Another major complication to the statistics is that they mask important regional differences. Tourism in some areas of Mexico is increasing steadily while it is simultaneously declining in others.  For example, occupancy rates for the first six months of 2010 were up 30% in Morelia and 15% in Huatulco compared to the previous year. However 14 of the 70 cities monitored showed no gain in occupancy over the low numbers posted in 2009. All these percentage figures ignore any changes in hotel capacity over that time. For instance, if an additional 2000 hotel rooms are opened in a resort, the occupancy rate may decrease slightly, even though more tourists actually visited the resort.

For cruise ships, a similar picture emerges. Though cruise ship visitors to Mexico were up in the first six months of 2010, they remain lower than the 2008 numbers for the equivalent period.

So, is tourism expanding, or not? Overall, tourism in 2010 is certainly improving over the 2009 numbers, which is quite encouraging given the extremely negative publicity resulting from drug war violence.  However, it is too early to say if the total number of visitors and revenues in 2010 will surpass the numbers for 2008.  This will depend not only on publicity related to Mexico’s fight against drugs, but also on the speed and extent of economic recovery in the USA. In addition, the collapse of Mexicana airline means that there are currently far fewer flights into Mexico that there were at this time last year.

See also:

Chapter 19 of Geo-Mexico: the geography and dynamics of modern Mexico focuses on Mexican tourism and development.  Buy your copy today to have a handy reference guide to all major aspects of Mexico’s geography!

Sep 072010
 

When complete, this dramatic new highway will have significant economic impact. Drivers using the old road report that it can take from five to nine hours to make the 325 kilometer trip, depending on traffic and one’s willingness to risk passing slow trucks on virtually blind curves. Buses allow 6.5 hours.

When completed, the driving time on the new four lane expressway will be reduced to less than three hours. Durango residents will easily be able to go off to the beach in Mazatlán for the week-end. The driving time from Monterrey or South Texas to Mazatlán will be reduced to less than a day. This could revive Mazatlán as a major tourist destination after a couple of decades of relative stagnation.

The port of Mazatlán

The port of Mazatlán. Photo: Stan Shebs (Wikimedia Commons)

Perhaps the biggest effect of the new highway will be the improved connection between the Pacific Ocean port of Mazatlán and north-central Mexico (population about 12 million) and most of Texas (about 20 million). The impact from increased trade in finished products (especially those which are relatively light and suitable for truck transport) will be significant.

Shrimp from Mazatlán and many, many products destined for northern Mexico/Texas from the Pacific Rim Region (China, South Korea, Taiwan, Japan, Indonesia, Australia, etc.) will be shipped through Mazatlán and trucked from there on the new highway. We expect there will be considerable trucking/shipping in the opposite direction as well. The resulting increased shipping through the port of Mazatlán will stimulate economic growth.  However, to facilitate these shipments, new urban expressways should be built through or around the cities of Durango, Torreón and Saltillo.

We expect the impact on the state of Durango will be less. Most of Durango’s mineral and timber products are rather bulky, not ideally suited to truck transport, and not globally competitive; therefore they will not find their way through Mazatlán to world markets.

Some (including Chris Hawley in USA Today) have argued that the new highway will have an appreciable impact on drug production and trade by improving police access and providing new economic opportunities. We think the impact will be rather slight. The Western Sierra Madre (Sierra Madre Occidental) covers about 200,000 square kilometers and the road affects less than 4% of this area (assuming an area of influence 25 kilometers wide either side of the highway). In our opinion, whatever illegal drugs are currently being cultivated in the Western Sierra Madre will continue to be grown. Yes, some people along the highway will find new employment in roadside commerce, but these jobs will be rather few.

Chapter 3 of Geo-Mexico: the geography and dynamics of modern Mexico discusses how the Sierra Madre Occidental influenced Mexico’s historical development. Chapter 17 analyzes the difficulties of transportation between Mazatlán and Durango. Buy your copy today to have a handy reference guide to all major aspects of Mexico’s geography!

Mexico’s Copper Canyon is one of the world’s most amazing natural wonders

 Excerpts from Geo-Mexico, Updates to Geo-Mexico  Comments Off on Mexico’s Copper Canyon is one of the world’s most amazing natural wonders
Aug 282010
 

The Copper Canyon, one of Mexico’s most amazing natural wonders The rugged ranges of the Western Sierra Madre in the state of Chihuahua conceal several massive canyons, giving rise to incomparable scenery. The Copper Canyon (Cañon del Cobre) region is the collective name given to this branching network of canyons, larger in many respects (see table) than the USA’s Grand Canyon.

How does Mexico’s Copper Canyon compare to the US Grand Canyon?

Urique CanyonsUS Grand Canyon
Total length of rivers (km)540446
Depth (m)1250–18701480
Altitude of rim (m above sea level)2250–25402000–2760
Maximum width (km)415

Strictly speaking, the name Copper Canyon refers only to one small part of the extensive network of canyons which is more properly called by geographers the Urique Canyon system. As the table shows, the Urique Canyons are longer, deeper and narrower than their US rival.

Mexico's Copper Canyon

How was the Copper Canyon formed?

According to a local Tarahumara Indian legend, the canyons were formed when “a giant walked around and the ground cracked.” Geologists believe that a sequence of volcanic rocks varying in age from 30 to 135 million years were slowly uplifted to an average elevation of 2275 m (7500 ft) and then dissected by pre-existing rivers.

These antecedent rivers retained their courses, cutting down over 1400 m into the plateau surface, forming deep canyons and dividing the former continuous plateau into separate giant blocks. Centuries of erosion by the Urique river and its tributaries have resulted in the present-day landscape of structurally-guided plateau remnants, termed mesas, buttes and pinnacles, depending on their size.

Aug 262010
 

The table shows the top 10 exports relating to food and drink.

RankProductAnnual exports (approx., US$ millions)
1Beer1,800
2Tomatoes1,100
3Tequila & Mezcal740
4Bell peppers610
5Avocados600
6Coffee325
7Onions280
8Pork270
9Limes & lemons260
10Watermelon210

The actual value of exports for each product varies widely from year to year. The figures quoted in the table are an average of the last few years for which data are available. They underestimate the importance of strawberries, exports of which have risen sharply since 2004. In the past couple of years, exports of strawberries have exceeded watermelon in value.

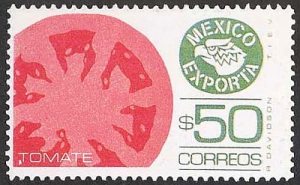
Stamp showing tomato exports

How many countries have featured tomatoes on a stamp?

Small wonder that the “Mexico exports” set of stamps in use from the 1970s to the 1990s featured many agricultural products in its designs, including tomatoes (pictured here), tequila, beer, coffee, honey, strawberries, limes, cotton and citrus fruits. We plan to look more closely at some of these items in future posts.

Agriculture is analyzed in chapter 15 of Geo-Mexico: the geography and dynamics of modern Mexico. Mexico’s exports are examined in chapter 20. Buy your copy today, so you have this handy reference guide to all aspects of Mexico’s geography available whenever you need it.

Aug 182010
 

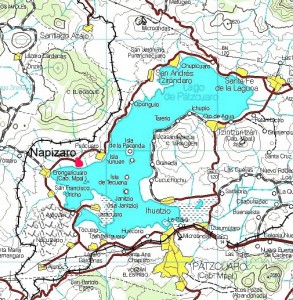
People in the small village of Napizaro near Lake Pátzcuaro in Michoacán are very familiar with North Hollywood, California, which is over 2400 km (1500 miles) away. Almost everyone born in Napizaro now over 20 years old is living, or has lived, in North Hollywood, which is home to at least one member of virtually every family in Napizaro.

Map showing location of Napizaro, Michoacan

Map showing location of Napizaro on Lake Pátzcuaro, Michoacán. Click to enlarge.

Initially, a few migrants from Napizaro found good jobs in North Hollywood. Through letters, phone calls and visits home, they told their friends and relatives in Napizaro and new migrants headed north. Movement between the places increased significantly. The majority of young boys and many young girls look forward to the day when they can travel to North Hollywood and start making real money. Many of the migrants from Napizaro moved their immediate families and settled permanently in North Hollywood.

Remittances sent back from workers in North Hollywood have had a big impact on Napizaro. The village has numerous impressive brick homes, with cars parked in the driveways and satellite TV dishes on the roofs. The newly built bull ring is named “North Hollywood.”

This is another example of a migration channel linking two rather distant places.  There are numerous migration channels between specific towns in Mexico and particular places in the USA.

Another migration channel links Aguililla, Michoacán, and Redwood City, California

For previous posts about remittances, the funds sent home by migrant workers, see:

Migration between Mexico and the USA is the focus of chapter 25 of Geo-Mexico: the geography and dynamics of modern Mexico. Ask your library to buy a copy of this handy reference guide to all aspects of Mexico’s geography today! Better yet, order your own copy…

Migration channels between Mexico and the USA, or how distant towns are linked through migration

 Updates to Geo-Mexico  Comments Off on Migration channels between Mexico and the USA, or how distant towns are linked through migration
Aug 132010
 

The municipality of Aguililla, Michoacán, is closely linked to Redwood City, California, over 2900 kilometers (1800 miles) away. Redwood City has about 37,000 Latino residents, perhaps half of which were originally from Aguililla. There are almost as many Aguilillans in Redwood City as there is in the municipality of Aguililla, which has about 25,000 residents. Aguililla and Redwood City are officially “Sister Cities”.

Coat-of-arms of Aguililla, Michoacán

Coat-of-arms of Aguililla, Michoacán, clearly showing the road out...

How did this linkage form?  Under the Bracero program many workers from Aguililla got temporary visas to work in California’s San Joaquin and Salinas valleys. Since agricultural work was seasonal, the immigrants looked for more permanent employment.

A number found jobs in Redwood City, just south of San Francisco. Word spread to Aguililla relatives and friends in the Bracero program. They headed for Redwood City where they got assistance in finding jobs and homes from earlier Aguilillan migrants. Many returned to their hometown and soon everyone in Aguililla learned about the good jobs and good life in Redwood City.

Before long there was a significant stream of workers leaving Aguililla headed for Redwood City.  Many early migrants became permanent and moved their families. But they retained their ties to Aguililla and made return trips from time to time so their children could learn their roots and see their grandparents. The remittances sent back from workers in Redwood City have been important to the Aguilillan economy for over 60 years.

This is an example of a migration channel which links two rather distant places. There are numerous migration channels between specific towns in Mexico and particular places in the USA.  We look at other examples in other posts.

The principle of distance decay suggests that the strength of links between settlements is usually inversely proportional to the distance between them (places close together, strong links; places further apart, weaker links). Migration channels cause anomalies in this pattern, since they often lead to strong spatial interactions which do not match those expected from distance decay.

For previous posts about remittances, the funds sent home by migrant workers, see:

Migration between Mexico and the USA is the focus of chapter 25 of Geo-Mexico: the geography and dynamics of modern Mexico. Ask your library to buy a copy of this handy reference guide to all aspects of Mexico’s geography today! Better yet, order your own copy…