Marriage declining among Mexican couples

 Updates to Geo-Mexico  Comments Off on Marriage declining among Mexican couples
May 312011
 

Mexican couples still prefer marriage over the alternatives, but not as strongly as in the past. According to the 2010 census, 40.5% Mexicans age 12 and over were married, down from 44.5% in 2000 and 45.8% in 2009. The 11% decline since 1990 does not sound like much, but is significant when the data are investigated more deeply.

Because the data include all Mexicans over age 12, it is not surprising that 35.2% were single in 2010, compared to 37.2% in 2000 and 40.6% in 1990. The 13% drop since 1990 in the percentage for singles is mostly a result of the relative decline in the total number of teenagers, most of whom are unmarried, as a consequence of the decline in fertility over the past few decades.

The most impressive growth was for “free union” couples, those living together but not married. In terms of population, the proportion went from 7.4% in 1990 to 10.3% in 2000 and 14.4% in 2010, almost double the 1990 level. If we compare married couples with those in free union, we get an even clearer picture of the trend. In 1990, 13.9% of all couples lived in a “free union”; this figure increased to 18.8% in 2000 and 26.2% in 2010.

While roughly three of every four couples in Mexico are married, this varies significantly from state to state. It is not surprising that the least Catholic state—Chiapas— has the most couples living in “free union” – 38.8%. Chiapas also is one the most heavily indigenous states. But even in Chiapas, over six in ten couples are married. Other states with high rates of “free union” couples are Baja California (35.5%), Nayarit (34.5%), Baja California Sur (34.4%) and Quintana Roo (34.4%), a state with relatively few Catholics and a substantial indigenous population. The most Catholic state of all—Guanajuato—has the fewest “free union” couples, only 13.4%. Other states with relatively few unmarried couples are Yucatán (14.1%), Zacatecas (15.3%), Nuevo León (15.6%) and Aguascalientes (16.0%).

The census also includes three additional categories which all have increased rather rapidly since 1990. Those widowed went from 3.6% in 1990 to 4.3% in 2000 and 4.4% in 2010. This probably is a function of increasing life expectancy and people living longer on their own after their spouse dies, especially if the death resulted from an accident or violence. Separation, though still rather rare, is becoming more common, increasing from 1.2% in 1990 to 2.6% in 2000 and 3.7% in 2010. Divorce is also quite uncommon but increasing, from 0.7% in 1990 to 1.0% in 2000 and 1.5% in 2010.

Children of Mexico’s indigenous groups are disadvantaged from birth

 Mexico's geography in the Press  Comments Off on Children of Mexico’s indigenous groups are disadvantaged from birth
May 302011
 

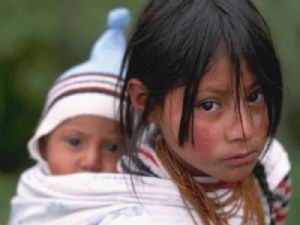
About 12% of Mexico’s population belongs to one or other of the numerous indigenous groups in the country. According to Mexico’s National Human Rights Commission (NHRC), Indian children under 5 years old are the group with the most needs in Mexico. They have a mortality rate that is 60% higher than that of non-Indian children.

Indigenous children in Mexico

Their disadvantages “increase when they belong to communities characterized by poverty, marginalization and discrimination.” Almost one-third of all children under 5 years of age belonging to Mexico’s indigenous population are below average height and weight. Illiteracy for this group is four times higher than the national average, because many of them leave school early to help their families make ends meet.

Related posts:

Chapter 10 of Geo-Mexico: the geography and dynamics of modern Mexico is devoted to Mexico’s indigenous peoples. Many other chapters of Geo-Mexico include significant discussion of the cultural and development issues facing Mexico’s indigenous groups.

Religious diversity is increasing in Mexico

 Updates to Geo-Mexico  Comments Off on Religious diversity is increasing in Mexico
May 282011
 

Mexico is still considered to be a Catholic country, but it is slowly becoming less Catholic. In the 2010 census 82.7% said they were Catholics compared to 88.0% in 2000 and 89.7% in 1990. In a recent report, Sociologist Roberto Blancarte, who specializes in research into religions, claims that for each day of the last decade, more than 1,000 Mexicans left the Catholic Church. He concludes that Catholicism is “destined to be abandoned” in Mexico.

Conversely, the percentage of the population who declared themselves non-Catholic went from 12.0% to 17.3% in 2010, almost a 50% increase.

The percentage of Protestants or Evangelicals increased to 9.7% in 2010 from 5.2% in 2000 and 4.9% in 1990. The proportion following “Other Religions” was 2.5% in 2010, 2.4% in 2000 and 1.5% in 1990. While the percentages in these latter two groups are rather low, Mexicans in non-Catholic religions tend to be far more religiously active than the majority of those who consider themselves Catholics. A total of 4.6% indicated that they had no religion in 2010, compared to 3.5% in 2000 and 3.2% in 1990.

Women tend to be more religious than men and more apt to have specified religions. About 5.5% of males indicated that they had “No Religion” compared to 3.9% for women. Women were a bit more likely to indicate they were Catholics (83.1% versus 82.3%) or Protestants or Evangelicals (10.2% versus 9.2%).

Western Mexico is still the most Catholic area of the country, though other religions are gaining converts. The state with the highest proportion of Catholics is Guanajuato with 93.8% followed closely by Zacatecas with 93.5%. Other states with over 90% Catholics are Querétaro, Jalisco, Michoacán, and Tlaxcala.

The least Catholic states are in Southern Mexico, led by Chiapas where only 57.8% are Catholic. Over 27% in Chiapas are Protestants or Evangelicals and 12% indicated that they had “No Religion.” Other states with under 65% Catholics include Campeche, Quintana Roo and Tabasco. The percentage Catholic in Oaxaca is just over 80% which seems surprisingly high given that Oaxaca is a southern state and has the largest proportion of indigenous-language speakers.

Related posts:

The geography of Mexico’s religions is discussed in chapter 11 of Geo-Mexico: the geography and dynamics of modern Mexico. Ask your library to purchase a copy today!

Two examples of trans-border air pollution on the Mexico-USA border

 Excerpts from Geo-Mexico, Updates to Geo-Mexico  Comments Off on Two examples of trans-border air pollution on the Mexico-USA border
May 262011
 

Poor air quality is known to have significant economic and social impacts, including adverse health risks and a lower quality of life. In this post, we examine two examples of trans-border air pollution. We analyze the causes of poor air quality, and describe the strategies being adopted on either side of the Mexico-USA border to improve air quality.

Does air pollution from maquiladoras in Ciudad Juárez affect people’s health?

The worst air pollution along the USA–Mexico border is in Ciudad Juárez in Chihuahua, located across the Río Grande from the city of El Paso in Texas. It is often claimed that this is because of Mexican authorities’ poor enforcement of environmental laws and the high number of maquiladora firms operating in the city.

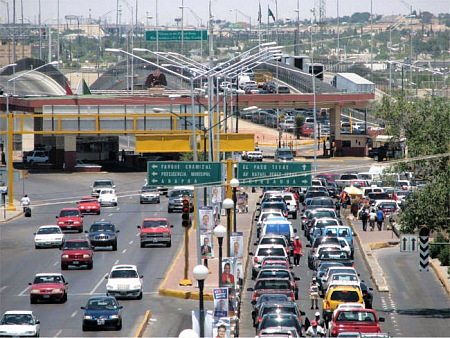
Mexico-USA border traffic in Ciudad Juárez

Mexico-USA border traffic in Ciudad Juárez

Air pollution does adversely affect the health of Ciudad Juárez’s 1.4 million residents, resulting in a higher incidence of respiratory diseases and premature mortality. However, most of the pollutants related to these health issues do not come from the 300 or so maquiladora factories but from dirt roads, vehicles and family-run brick kilns. Industry, including the brick kilns, accounts for only 17% of total sulfur dioxide emissions, and less than 1% of total particulate emissions. Services account for 44% of the sulfur dioxide emissions, and transport a further 38%. Most particulates came from unpaved roads (65% of the total) and from wind-blown soil erosion (31%). Almost all the carbon monoxide (99%) and nitrogen oxide (92%) added to the air came from transportation. (Blackman, A., Batz, M. and Evans, D. 2004 “Maquiladoras, Air Pollution, and Human Health in Ciudad Juárez and El Paso. April 2003, updated July 2004.”)

Socio-economically poor areas are more affected by bad air quality than richer areas, but this is due to the precise location of the small-scale brick kilns, which have no pollution controls, rather than to the locations of maquiladora plants. Most of the city’s 350 brick kilns are in densely populated low-income residential neighborhoods such as Anapra, Division del Norte, Fronteriza Baja and Waterfill.

When the kilns were first built, these areas were on the perimeter of the city, but they have since been enveloped by urban sprawl. The health damages arising from the brick kilns are estimated at almost $50 million a year in Ciudad Juárez and an additional $13.4 million a year in El Paso.

How are the cross-border twin cities of Nogales (Sonora) and Nogales (Arizona) trying to improve their air quality?

Further west, the border cities of Ambos Nogales (Both Nogales) share many of the same air quality issues as Ciudad Juárez. Nogales in Sonora has a population of about 250,000, more than ten times that of its cross-border twin in Arizona. Inevitably (given the size differential) most of the pollution, including dust and vehicle emissions, comes from south of the border. Air quality is also adversely impacted by natural hazards such as wildfires in the region. The air in Nogales, Arizona, regularly fails to meet the US Environmental Protection Agency’s limits for coarse particulate (PM10) pollution.

However, now, according to a recent news report, steps are being taken to ameliorate the air pollution in Ambos Nogales by authorities either side of the border.

On the Mexican side, reliable air quality monitoring systems are being installed, with the financial help of international agencies. The Sonoran state government has started a priority program to pave dirt roads in the vicinity of Nogales, responsible for an estimated 9,000 metric tons of dust each year. In the next phase, tighter controls are needed on factory emissions and on the burning of waste.

On the US side, the Arizona Department of Environmental Quality is trying an innovative approach, using federal funds to pay Mexican truck owners to replace their old, leaky mufflers with state-of-the-art catalytic converters. Each conversion costs about $1600. The program should eventually reduce harmful emissions from the particle-spewing diesel-burning trucks by 30%. The next item on the agenda for the US side should be to reduce the waiting times for all trucks crossing the border, so that emissions are further reduced.

We will look at the success (or failure) of these strategies to ameliorate trans-border air pollution in a future post.

Make your own “Better Life Index”

 Books and resources, Teaching ideas  Comments Off on Make your own “Better Life Index”
May 252011
 

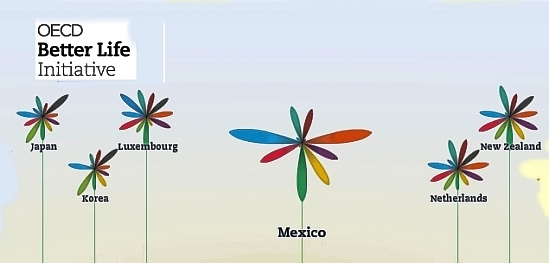
An interactive graph from the OECD (Organisation for Economic Co-operation and Development) now allows you to compile your own “Better Life Index” and compare “well-being” across the 34 member countries of the OECD. From an educational perspective, the graph offers hours of fun and fact-filled learning opportunities.

Better Life Index

The graph allows you to set individual weightings for each of 11 variables considered by the OECD to be important for well-being, and then see how the 34 countries rank on a graph. The graphs can be arranged either by rank or by country name. The 11 variables are:

  • housing
  • income
  • jobs
  • community
  • education
  • environment
  • governance
  • health
  • life satisfaction
  • safety
  • work-life balance

The symbols for each country are a flowers with 11 petals, one for each variable, where the length of the petal represents that country’s score and the width of the petal reflects the weighting you’ve given it.

This would be a great starting point for discussions of what “well-being” really means, and why different people (different countries?) would choose very different weightings for the 11 variables.

Related posts:

Various simple and compound development indices are discussed in chapters 29 and 30 of Geo-Mexico: the geography and dynamics of modern Mexico. Ask your local library to purchase a copy today!

Relying on geography for orientation: some indigenous languages do not have words for “left” or “right”

 Other  Comments Off on Relying on geography for orientation: some indigenous languages do not have words for “left” or “right”
May 242011
 

Mexico’s indigenous groups have long been a rich resource for investigations of all manner of research concerning culture, linguistics and sociology.

In this post, we consider Spatial Reasoning Skills in Tenejapan Mayans, a study relating to geographic reasoning, which relied on the participation of indigenous Tseltal-speaking Maya in Tenejapa (Chiapas), southern Mexico.

According to the inter-census population count in 2005, Tseltal (aka Tzeltal) is spoken by 371,730 individuals over the age of 5, making it Mexico’s fifth most-spoken indigenous language (after Náhautl, Maya or Yucatec Maya, Mixtec and Zapotec). More than 25% of Tseltal speakers are monolingual and do not speak Spanish. They reside in several municipalities of Chiapas, including Ocosingo, Altamirano, Tenejapa, Chanal, Sitalá, Amatenango del Valle, San Cristóbal de las Casas and Oxchuc.

Peggy Li, Linda Abarbanell and Anna Papafragou, the authors of the study, examined the “possible influences of language on thought in the domain of spatial reasoning.”

They distinguished between egocentric orientation and geocentric orientation:

“Language communities differ in their stock of reference frames (coordinate systems to reference locations and directions). English typically uses egocentrically-defined axes (“left-right”). Other languages like Tseltal lack such a system but use geocentrically-defined axes (“north-south”).”

They then compared how a group of Tseltal speakers tackled simple orientation tasks that required egocentric spatial reasoning skills. Their expectation was that Tseltal speakers would be poor at these tasks compared to a control group of Tseltal speakers who also spoke Spanish (which has many egocentric words).

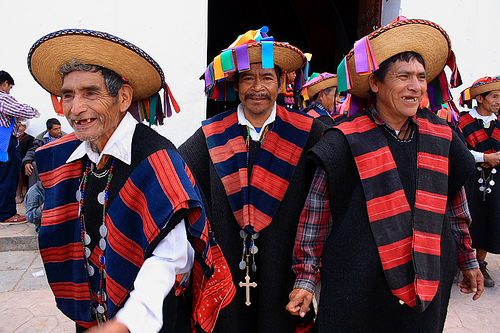
Tzeltal elders
Tzeltal elders – looking right or left? Credit: Enrique Escalona, México D.F.

The expectation was that Tenejapans would find egocentric reasoning much harder than geocentric spatial reasoning since their language has no egocentric vocabulary for anything beyond their own bodies. [Tseltal “does have two “body part words “xin” (left) and “wa’el” (right)”, though they are never used for anything outside the body.] This expectation was based in part on an earlier anecdotal report that “a Tenejapan blindfolded and spun around 20 times in a darkened house was able to point in the agreed [compass] direction while still dizzy and blindfolded”.

To some people’s surprise, the Tseltal speakers were able to solve tasks requiring egocentric skills at a rate far higher than mere chance would suggest, and indeed with a higher success rate than tasks requiring geocentric skills. The researcher concluded that tasks requiring egocentric spatial orientation skills are actually easier than those requiring geocentric spatial orientation, and that the absence of “left/right” in a language does not necessarily translate into any conceptual gap.

If Tseltal speakers don’t use “left and right” to locate objects, how do they describe where things are?

“In place of egocentric coordinates, Tenejapans and other Tseltal speakers utilize a system of terms (“alan” and “ajk’ol”) based on the overall inclination of the terrain (“downhill” and “uphill”) which they inhabit. These geocentrically-defined terms are extended and used even when one is on flat terrain to reference the general directions of uphill and downhill which roughly correspond to the north-south axis. Moreover, they are used in descriptions of small scale arrays such as the arrangement of items on tabletops for which English speakers prefer “left” and “right.” ”

We hope the Tenejapans (each received 50 pesos for participating) did not give all their secrets away at once, but have saved some for the enlightenment of future researchers…

Li, P., Abarbanell, L.,& Papafragou, A. (2005). Spatial reasoning skills in Tenejapan Mayans. Proceedings from the 27th Annual Meeting of the Cognitive Science Society. Hillsdale, NJ: Erlbaum.

Mexico’s population is aging fast

 Updates to Geo-Mexico  Comments Off on Mexico’s population is aging fast
May 232011
 

Mexico’s population has aged significantly in the past two decades. In 2010, the median age was 26 years meaning that there were equal numbers of people above and below age 26. The median age in 2000 was 22 years while that in 1990 was only 19 years. Obviously, the number of older adults is growing much faster than the number of young adults and children. The Federal District has the highest median age by far with 31, followed by Nuevo León, Tamaulipas and Veracruz with 27. At the other end are Chiapas with 22, Guerrero with 23, and Puebla, Guanajuato, Durango and Aguascalientes with 24.

In 2010, about 29.3% of the Mexican population was under age 15 compared to 34.1% in 2000 and 38.6% in 1990. On the other hand, the 2010 census indicates that 6.3% are over age 65, up from 5.0% in 2000 and only 4.2% in 1990. The proportion in this older age group increased 50% in the past two decades. These changes are quite dramatic and represent major demographic change. The trend is expected to continue and have significant implications for education and elder care systems.

The group in the middle, those between ages 15 and 65, has increased from 57.2% in 1990, to 60.9% in 2000 and 64.4% in 2010. This trend of increasing working age population contributes to greater economic growth as does the proportion of women entering the work force :

Of course, the growth in workforce can only contribute to economic growth if there are sufficient employment opportunities.

Mexico’s current age-sex structure is graphically presented in the 2010 population pyramid depicted in an earlier post:

A round-up of news items about Mexicans in the USA

 Mexico's geography in the Press  Comments Off on A round-up of news items about Mexicans in the USA
May 212011
 

This is the first in an occasional series of updates featuring news items relating to the Mexican diaspora, especially that part of it residing in the USA.

1. Mexico is the leading point-of-origin for foreign-born residents of the USA diagnosed with tuberculosis

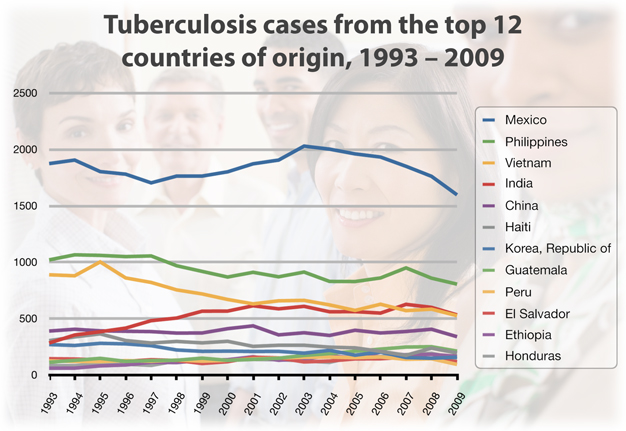
The number of TB cases reported in foreign-born persons in the USA was between 7,000 and 8,000 between 1993 and 2008, but fell slightly in 2009. In 2009, 6,854 cases (59% of the total TB diagnoses in the USA) were reported for foreign-born residents. The leading country of origin for these foreign-born TB cases was Mexico, followed by the Philippines, Vietnam, India amd China (see image).

TB cases in USA

TB cases in the USA by country of origin; click to enlarge

A second graph shows that the TB rate (per 100,000 population) has fallen 77% since 1993 for USA-born persons, a much faster decrease than the 45% decrease over the same time period for foreign-born residents. The US Center for Disease Control (CDC) is reported to be working to improve the screening of immigrants and refugees, especially along the USA-Mexico border.

2. Mexican migrants to the USA experience higher rates of depression and anxiety disorders

In 2007, there were about 12 million Mexican-born people in the USA. Mexicans accounted for 30% of the foreign-born population in the USA, and 25% of the US Hispanic population. A study published in the March 2011 issue of the Archives of General Psychiatry suggests that young adult Mexican migrants in the USA are much more likely to suffer depression and anxiety disorders than family members who remained in Mexico. The disorders experienced included depression, dysthymia, social phobia, panic disorder, post-traumatic stress disorder, and generalized anxiety disorder. The risk was highest for those in the 18-25 age bracket. The researchers conclude that this study offers the first direct evidence that “experiences as a migrant might lead to the onset of clinically significant mental health problems in this population”.

3. Hispanic purchasing power in the USA exceeds $1 trillion a year

According to the US Census Bureau, 2010 data show that Hispanics accounted for more than half of the total population increase in the USA over the past 10 years, a trend which is expected to continue. More than 50 million people in the USA are of Hispanic descent, 1 in 6 of the population. The buying power of Hispanics has increased sharply, from less than 4% of the domestic market in 1980 to more than 9% (more than a trillion dollars) in 2010. People of Mexican descent have an estimated buying power of $616 billion a year, easily the single most important segment of the total Hispanic market.

4. Increased remittances in 2010

Remittances sent home by Mexican migrants working in the USA increased in 2010 by 5.5% to $5 billion. The figure comes from Mexico’s central bank.

5. How much do unauthorized immigrants in the USA pay in taxes?

The answer is billions of dollars a year. Like all residents, unauthorized immigrants pay sales tax. Some, even if they rent, also pay property tax. About half of all unauthorized immigrants also pay income tax. The Institute for Taxation and Economic Policy (ITEP) estimates that the state and local taxes paid in 2010 by households headed by unauthorized immigrants may exceed $11.2 billion. That figure is made up by $1.2 billion in personal income tax, $1.6 billion in property tax and $8.4 billion in sales tax.  This is clearly a very considerable contribution to state and federal revenues.

– – –

Migration between Mexico and the USA is the focus of chapter 25 of Geo-Mexico: the geography and dynamics of modern Mexico. Ask your library to buy a copy of this handy reference guide to all aspects of Mexico’s geography today! Better yet, order your own copy…

Mexico’s Magic Towns program to continue at least until 2012

 Mexico's geography in the Press  Comments Off on Mexico’s Magic Towns program to continue at least until 2012
May 202011
 

We had earlier reported that the federal Tourism Secretariat (Sectur) was about to announce the end of the Magic Towns program. Tourism has since announced that the program will continue at least into next year.  [Thanks to reader Jess for her report that the Tourism Secretariat has since announced that the program is being continued, and that there will be 52 Magic Towns by 2012.] The Magic Towns program, founded a decade ago, offered federal funds to promote tourism in towns and small cities throughout Mexico that were not traditional “sun and sand” tourism resorts or destinations.

The most likely towns to be added to the list are:

  • El Oro (Mexico state)
  • Mineral del Pozo (Guanajuato)
  • Sombrerete (Zacatecas)
  • Catemaco (Veracruz)
  • Calvillo (Aguascalientes)

A further 70 towns are reportedly seeking accreditation. Some of these applicants are now likely to join similar promotional groupings such as “Pueblos con Encanto” (Towns with Charm) and “Pueblos Señoriales” (Noble Towns).

Following their designation, many Magic Towns have found it much easier to attract private investments in restaurants, hotels, guide services and similar tourism-related services.

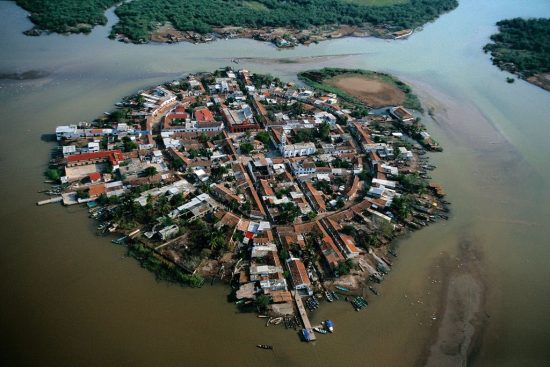
Mexcaltitán

Mexcaltitán, island settlement in Nayarit

One of the very first Magic Towns established—the island community of Mezcaltitán in Nayarit—was stripped of its Magic Town status in 2009 for having failed to keep its streets and building facades clean and for not having limited the activities of informal street vendors.

Mexico’s Magic Towns now include Zacatlán in the Sierra Norte of Puebla

 Other  Comments Off on Mexico’s Magic Towns now include Zacatlán in the Sierra Norte of Puebla
May 192011
 

One of the Mexican Tourism Secretariat’s flagship programs is its “Magic Town” designation. This is a program that was long overdue when it finally began in 2001. Mexico’s Magic Towns (Pueblos Mágicos) range from tiny, almost undiscovered villages on the coast to sizable inland cities. What they all have in common is that they have some truly special cultural, historic or social importance.

Almost every state has at least one Magic Town; there are currently 41 scattered across the Republic,  with a further 70 seeking accreditation.

Towns accepted into the program have access to federal funds for publicity and improvements. For example, some of the towns have already relocated all those ugly wires, that despoil so many Mexican towns, safely underground, well out of sight. In all cases, a local committee oversees the projects, ensuring that local interests are always to the fore.

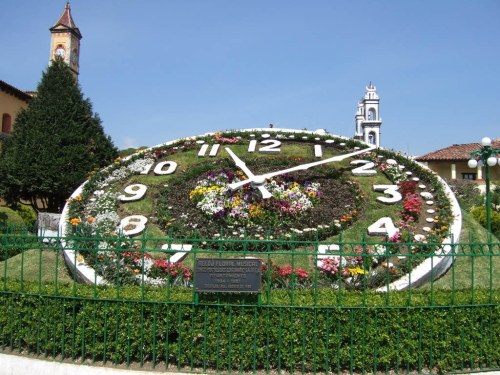
Musical floral clock in Zacatlán

One of the latest additions to the list of “Magic Towns” is Zacatlán in the Sierra Norte of the state of Puebla. This town, often called Zacatlán de las Manzanas (Zacatlán of the Apples) is a regional, commercial center in highland orchard country.The town (altitude: 2000 meters or 6700 feet; 2010 population: 76,296 )  is perched on a ledge overlooking the River Laxaxalpa. It celebrates an annual Apple Fair in early August.

Zacatlán’s attractions for tourism include:

  • close proximity to stunning natural landscape, including the fascinating and photogenic tor-like rock formations known as Piedras Encimadas (Stacked Rocks)
  • history and architecture: Several historic buildings including a Franciscan Friary dating back to the 16th century
  • a manufacturer of ornamental clocks (including Zacatlán’s own unusual musical floral clock)
  • local cuisine which includes tacos de barbacoa, pan relleno de requesón, fruit wines and mole
  • handicrafts, especially earthenware and woolen items

All in all, a worthy addition to the list of Magic Towns!

Many aspects of tourism, including the concepts associated with sustainable tourism, are analyzed in detail in chapter 19 of Geo-Mexico: the geography and dynamics of modern Mexico.

Projecting Mexico’s population: when, if ever, will it stop growing?

 Updates to Geo-Mexico  Comments Off on Projecting Mexico’s population: when, if ever, will it stop growing?
May 172011
 

Between 2000 and 2010, Mexico’s population grew over 15% from 97.362 million to 112.337 million. While this is less than the 20% growth experienced between 1990 and 2000, it is still relatively fast. Will Mexico’s population ever stop growing? To answer such questions, demographers make population projections based on rates of births, deaths and net migration.

The most recent official population projection available from the Mexican Government’s CONAPO (Spanish acronym for National Population Commission) website estimates the Mexican population from 1990 to 2050. It estimates that the population will peak at 130.3 million in 2044 and decline gradually thereafter. This projection is many years old and does not incorporate the data from the 2010 Mexican census nor the impact on immigration of the employment recession in the USA.

In an attempt to get a better handle on Mexico’s future population dynamics until 2050, we conducted a simplified update of the CONAPO projections by using the 2010 census figures, more current net migration figures and adjusted natural population growth rates. Given the uncertain future of job opportunities in the USA for Mexican immigrants, we make the very simple assumption that net immigration from Mexico in the future will remain at 203,000 per year, the most recent figure available. (Pew Hispanic Center, “Mexican Immigrants: How Many Come? How Many Leave?” July 22, 2009, Washington, D.C.) The Pew numbers are limited to net Mexican migration to the USA, but that migration stream represents almost all Mexican migrants.

To obtain the correct 2010 census figure, the CONAPO values for natural population increase need to be upped by about 10%, an increase of only 0.122 percentage points in 2011 (from 1.222% to 1.344%), and progressively less in subsequent years. Using these two adjustments, we estimate that Mexico’s population will peak at 140.5 million in 2047. This is more than ten million more than the original CONAPO projection on 130.3 million.

With higher net emigration, the population peak will be lower and arrive earlier. For example, if net migration is set at 360,000 per year (the average for 2011 through 2050 used in the CONAPO projection, and about 66% of the net migration in 2005 before the recession), the population will peak at 134.5 million in 2043.

Without a doubt, accurate forecasts of net migration are needed for reliable population forecasting. If the CONAPO rate of natural increase is upped by only 5%, (instead of 10%), to 1.283% in 2011, the population will peak at 135.2 million in 2044. The compounding of this change of about one twentieth of one percent results in a change of over five million in Mexico’s eventual peak population.

Until CONAPO, or some other reputable demographic agency, makes a new population projection for Mexico, we can probably safely say only that Mexico’s population will peak at between 135 and 140 million sometime between 2040 and 2050.

Related posts:

More impacts of Mexico’s war against drug cartels

 Mexico's geography in the Press  Comments Off on More impacts of Mexico’s war against drug cartels
May 162011
 

Drug trafficking is one of the North America’s major contemporary issues, with widespread ramifications not only for Mexico, but extending well beyond her national borders. This is the first of an occasional series of updates examining some of the numerous different effects of the war on drug-related violence on Mexican society, the environment and the economy.

How many members of Mexico’s military have lost their lives in the war against the cartels?

In “InSight Map: Counting Federal Casualties in Mexico”, Patrick Corcoran takes a look at the confusing statistics relating to the deaths of members of the military in Mexico. The number claimed by the government (470 federal forces killed since 2000) does not match any of the conflicting numbers released on separate occasions by the Defense Secretariat for the number of military personnel killed in the on-going war against the drug cartels.

Drug war violence has decreased press freedom in Mexico

Freedom House, in its annual report, says that Mexico has experienced one of the world’s most radical declines in press freedom. Mexico’s press is now categorized on the Press Freedom Index as “not free”, alongside press in Cuba, Honduras and Venezuela.

More than 60 journalists have been killed in Mexico in the last decade, including 10 in 2010. Many others have been kidnapped, or intimidated. Several journalists have sought asylum in the USA. Drug cartels have increasingly pressured local press and news stations to broadcast partisan material, regardless of its accuracy.

Earlier this year, several major media groups in Mexico agreed to de‑glorify drug trafficking by refusing to show any grisly photos or menacing messages. The pact has been heavily criticized in some sectors, however, mainly on the grounds that it downplays the gravity of the on-going violence.

New laws enacted to protect all migrants in Mexico

It is not only the USA that has problems coping with undocumented or unauthorized migrants. More than 300,000 immigrants pass through Mexico each year on their way from Central America to the USA. Mexico actively patrols its southern border to limit the number of Central Americans who succeed in reaching the interior of the country.

Now, a new federal law expressly recognizes and protects the human rights of all migrants in Mexico, regardless of their place of origin, nationality, gender, ethnicity, age and immigration status. The new law guarantees access to basic services such as health and education. It comes in the wake of the horrific discovery in northern Mexico in recent months of several mass graves of migrants, mainly originating from Central America. The graves are believed to be linked to people-trafficking operations, known to be a source of revenue for drug cartels.

Drug gangs and the price of limes

One unexpected by-product of Mexico’s on-going drug wars in January 2011 was a steep rise in the price of limes, a quintessential ingredient of Mexican food and drinks. Prices in Mexico City quadrupled to almost four dollars a kilo ($1.80 a pound).

The interesting story behind the sudden increase in lime prices is given by Nacha Cattan in The Christian Science Monitor. An accompanying graphic shows how drug traffickers intervened in the normal supply chain, “extorting farmers, attacking produce trucks, or causing more time‑consuming border inspections”.

Most of the limes sold during winter months come from the semi-tropical orchards around Apatzingán, a town in Michoacán, western Mexico. Local truckers have to pay drug gangs up to 800 pesos ($66) a truckload for safe passage. Thefts of fully-laden trucks rose 50% in some areas last year. Allegedly, the gangs also influence prices by limiting harvesting and restricting the operation of packing plants.

Fortunately for Mexican lime-lovers, the price of limes has since returned to normal, with drugs gangs switching their attention to the much more lucrative trade in avocados.

How long will drug-related violence in Mexico last?

Even the Public Security Secretary, Genaro García, has now stated publicly that Mexico’s war on drug cartels will not be over any time soon. He argues that Mexico’s campaign against the cartels is having success, but that organized crime and violence related to drug production and trafficking are unlikely to fall within the next seven years.

Previous posts about the geography of drug trafficking and drug cartels in Mexico:

Geo-Mexico: the geography and dynamics of modern Mexico discusses drug trafficking in several chapters. A text box on page 148 looks at trends in the drug trafficking business and efforts to control it. Buy your copy today to have a handy reference guide to all major aspects of Mexico’s geography!

Are Mexican females overtaking males in literacy?

 Updates to Geo-Mexico  Comments Off on Are Mexican females overtaking males in literacy?
May 142011
 

For at least the last century, literacy for Mexican males has been significantly higher than that for females. According to the 2010 census 93.7% of Mexican males aged 15 and over were literate compared to only 91.1% of females. Males have higher literacy levels in all 32 Mexican states except for Sinaloa (males – 94.1%, females – 94.7%) and Sonora (males – 96.2% and females – 96.3%). We introduced the spatial aspects of literacy in Mexico in an earlier post:

The greatest gaps between literacy among males and females are in states with relatively low literacy levels (Pearson correlation = 0.89). For example, in Chiapas male literacy is 86.0% while that for females is only 77.5% for a difference of 8.5%. Other states with large gaps are Oaxaca (87.3% – 79.4%, gap of 7.9%), Guerrero (85.4% – 79.8%, gap of 5.6%), and Puebla (91.7% – 86.8%, gap of 4.9%). The data suggest that as literacy levels in states increase, the gap between males and females should decline.

Will the gap between male and female literacy levels decline in the decades ahead? Date from the 2010 census indicates that both illiteracy rates and the gap between males and females are far greater for older Mexicans. For those over age 75, male literacy is 71.2% while that for females is only 62.3% resulting in a gap of 8.9%. The gap is 8.4% for those between 60 and 74 years of age (83.3% versus 74.9%) and 4.4% for the 45 – 59 age group (93.1 versus 88.7%). The gap for those between 30 and 44 years of age is only 1.1% (96.4% versus 95.3%) and for the 15 to 29 age group, males and females are equal at 98.1%.

Does this trend suggest that female literacy will surpass male literacy in the future? The answer to this question appears to be yes. Data from the 2010 census on children between ages six and 15 indicates female literacy (87.32%) is already 1.33% higher than male literacy (85.98%). These levels seem rather low because literacy levels for children below age ten, particularly males, are generally lower. For example, among children age seven, literacy for females is 3.06% higher than that for males (73.91% versus 70.85%). That nearly 30% of seven-year-olds are illiterate suggests a problem; but most of these will become literate by age 15. Among children between age 14 and 15, female literacy is 98.40% compared to 98.09% for males.

The census provides data on the literacy of children for each age between age six and 15 for all 32 Mexican states. Literacy rates for female children are higher than those for males in all 288 observations (9 age groups times 32 states), expect for five (ages 11, 12, 13 & 14 in Chiapas and age 12 in Tlaxcala).

The largest gap between females and males is 4.6% for six-year-olds in Zacatecas (females – 43.51%, males – 38.91%). Other large gaps exist for seven-year-olds in Zacatecas (4.41%), six-year-olds in Querétaro (4.37%), seven-year-olds in Tamaulipas (4.34%), and seven-year-olds in Tabasco (4.33%). These findings are consistent with other evidence indicating that females develop language skills at younger ages than males. The data clearly indicate that female literacy is surpassing male literacy. Perhaps more importantly, both males and females are now approaching universal literacy.

We assume that the literacy gap between female and male children will continue in future decades. After a decade or two, we expect adult literacy rates for females to catch and surpass those for males. On the other hand, this gap will be very small because Mexico is quickly approaching universal literacy. When data become available we will analyze the gap in total years of education between females and males. We expect the situation in Mexico to move slowly towards the pattern in the USA, where females now have more years of education and more university degrees than males.

Literacy rates are, of course, only one of the many aspects of gender inequality in Mexico.

Why did CONAPO underestimate Mexico’s population by almost two million people? Mexico’s changing population dynamics

 Updates to Geo-Mexico  Comments Off on Why did CONAPO underestimate Mexico’s population by almost two million people? Mexico’s changing population dynamics
May 122011
 

Making population projections is risky business. Birth and death rate trends can change unexpectedly. Perhaps more difficult to forecast accurately, in Mexico’s case, are international migration rates. The most recent official population projection available from the Mexican Government’s CONAPO (Spanish acronym for National Population Commission) website estimates that the Mexican population will peak at 130.3 million in 2044, before declining gradually thereafter. However, this projection is many years old, and does not incorporate the data from the 2010 Mexican census, nor the impact on immigration of the employment recession in the USA.

CONAPO projected that Mexico’s total population in 2010 would be only 110,619,340, about 1.7 million fewer than the 2010 census figure of 112,336,538. Their estimate for net migration for 2005 to 2009 was 2,012,904, which is quite close to the more recent Pew Hispanic Center figure of 2,036,000 (“Mexican Immigrants: How Many Come? How Many Leave?” July 22, 2009). The Pew numbers are limited to net Mexican migration to the USA, but that migration stream represents almost all Mexican migrants.

However, the two sources have very different values for individual years. The CONAPO net migration projection gradually increased from 400,000 in 2005 to 405,000 in 2009, peaking at 406,000 in 2011 and gradually declining to 303,000 in 2050. The more current Pew estimates reached 547,000 in 2006-2007, before declining to 374,000 for 2007-2008 and only 203,000 for 2009-2009. Current evidence and continued lack of real job opportunities for Mexicans in the USA suggests that net migration has stayed at about this level for the past few years.

The CONAPO projection forecasts that the Mexican rate of natural population increase would decline gradually from 1.39% per year in 2005 to 0.06% per year in 2050. The average of the values they used for 2005 to 2010 was 1.313% per year. Using the actual 2010 census figure and the Pew migration numbers, we calculate that the actual average rate of natural increase for 2005 to 2010 was 1.443%. This suggests that the actual rates of natural increase were about 10% higher than the values used in the CONAPO projection. Apparently, birth rates in Mexico did not decline as fast as expected by CONAPO, consequently their estimate of Mexico’s 2010 population was significantly less than the census figure.

In a later post, we will attempt to update the existing CONAPO projection using the 2010 census figure, more recent net migration values and adjusted natural increase rates.

More problems for residents of Valle de Chalco on the south-eastern edge of Mexico City

 Mexico's geography in the Press  Comments Off on More problems for residents of Valle de Chalco on the south-eastern edge of Mexico City
May 112011
 

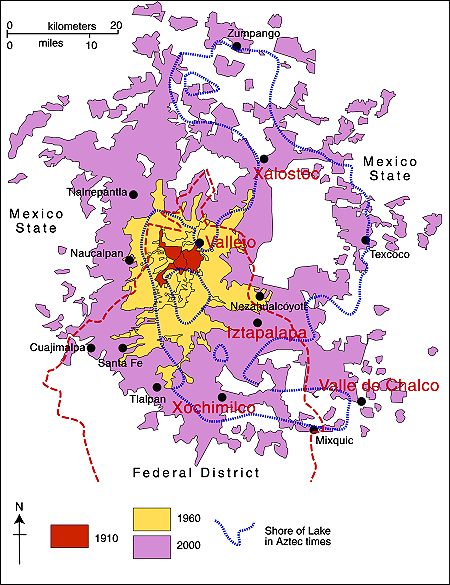
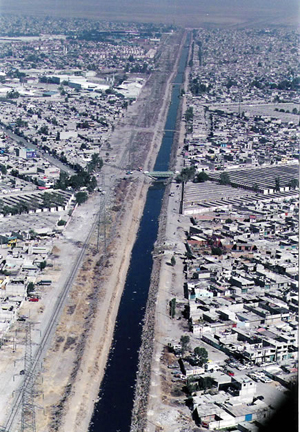
More than 200 homes in the low-income settlement of Valle de Chalco on the south-eastern edge of Mexico City, in the State of México, were flooded by raw sewage last month. The affected homes were in San Isidro and La Providencia, in Valle de Chalco (see map).

Mexico City cracks map
Locations in Valley of Mexico with high incidence of ground cracks. Cartography: Tony Burton; all rights reserved.

At least 500 residents faced a grim clean-up following several days of flooding. The problem was caused by a 30-meter-long crack in a surface sewage canal known as the Canal de la Compañia. The crack allowed 6,000 cubic meters a second of raw sewage to inundate nearby streets and homes. The federal water authority, Conagua, said that it would take three weeks to complete repairs to the canal wall.

Canal de la Compañia, Chimalhuacán

Canal de la Compañia, Chimalhuacán

The canal wall is thought to have been put under too much pressure due to the unfortunate combination of unusually heavy rains and a blockage occasioned by accumulated garbage such as plastic bags. It is possible that continued ground settling –More ground cracks appearing in Mexico City and the Valley of Mexico – also contributed to the problem. José Luis Luege Tamargo, the head of Conagua, placed much of the blame for the most recent flooding on the local municipal authorities of Ixtapaluca for not having ensured that no garbage was dumped anywhere in or near the Canal.

The 260 families and small businesses affected were all given some immediate financial assistance via 20,000-peso payment cards valid at any Soriano supermarket. In addition, authorities have pumped out basements and begun an emergency vaccination campaign.

The Canal de la Comañia’s walls have failed three times in the past decade, with serious flooding each time; the most recent disaster was in February 2010, when 18,000 people were forced to flee the rising wastewater. Conagua has reportedly proposed a more permanent remedy involving the rerouting of 7 km (almost 5 miles) of canal. The project would take two years to complete, with an estimated cost of 300 million pesos ($25 million).

Access to services is worst in the smallest rural localities of Mexico

 Updates to Geo-Mexico  Comments Off on Access to services is worst in the smallest rural localities of Mexico
May 102011
 

Access to services such as schools, public transport or the internet are better in cities than in rural areas (localities in Mexico with fewer than 2,500 inhabitants). However some rural areas have far better access than others. Perhaps not surprisingly, the number of inhabitants of a rural locality is directly related to its access to services.

The 2010 census indicates that 26.0 million Mexicans (about 23.2% of the population) live in rural areas. A total of 9.0 million live in Mexico’s 5,921 large rural communities (those with 1000–2499 inhabitants) compared to 11.3 million living in the 22,852 mid-sized rural localities (250–999 people) and 5.7 million in the 159,820 small rural settlements (fewer than 250 residents). The average population in the last group is only 36 inhabitants indicating that many Mexicans live in very tiny communities.

The percentage of communities with access to a health center or clinic is 74.9% for the large rural areas, 50.7% for the mid-sized, and only 37.9% for the small rural areas. The percentages for access to either a secondary school or telesecundaria (Mexico’s satellite-fed secondary schools, see Geo-Mexico, page 126) also differ with the size of the community: 79.6%, 51.5% and 27.0%, respectively. Though these percentages are far lower than those for larger, urban communities, they have improved very significantly. The census indicates that rural areas are catching up with the rest of Mexico, especially with respect to education, life expectancy and fertility, three very important, inter-related variables.

In turn, this suggests that government programs such as Oportunidades are achieving something positive in some areas beyond poverty reduction.

The network of roads providing access to rural villages has improved significantly. 81.2% of the smallest localities now are connected by road, compared to 96.7% for the mid-sized and 98.3% for the large rural areas. However, these data indicate that almost 31,000 rural Mexican communities are still not accessible by road. Only 63.5% of the small rural villages are served by public transport, compared to 74.6% of the mid-sixed and 89.3% of the large rural localities. A total of almost 107,000 rural communities do not have any public transport and are consequently quite isolated. This isolation is a very serious constraint to their economic opportunities and quality of life. The people who live in communities without access to a paved road are among Mexico’s poorest; fully 88% are classified as “very marginalized” (see Geo-Mexico, page 184).

Internet access is only beginning to penetrate into rural areas. Only 3% of the smallest rural villages have public access to the internet (via school, cybercafé, etc.). About four times as many (11%) of mid-sized rural localities have public internet access. Almost half (45.6%) of the large rural communities have public internet access compared to 74.3% of larger communities between 2500 and 4999 inhabitants. Current trends suggest that by 2020, virtually all Mexicans will have some type of internet access, perhaps by cell phone.

Fertility decline not as fast as expected, but faster in some areas of Mexico than others

 Updates to Geo-Mexico  Comments Off on Fertility decline not as fast as expected, but faster in some areas of Mexico than others
May 092011
 

Data from the 2010 census indicate that the fertility rate did not decline as fast in the last decade as previously expected. On the other hand, the actual reduction was significant and consistent with Mexico’s demographic transition which will lead it to zero natural population growth by mid-century. See our 15 May 2010 post: Mexico’s demographic transition and flirtation with overpopulation.

At mid-decade Mexico’s National Population Council (CONAPO) projected that the total fertility rate would decline to an average of 2.1 children per women for the 2010 census. The new census data indicate that the fertility rate for 2009 was actually 2.4 compared to 2.9 in 1999. This decline is still significant but not quite as rapid as previously expected.

Fertility rates vary greatly for different areas of the country. Like many other socio-economic variables, fertility is closely related to community size. It declines systematically with increasing community size. Rural areas (localities of less than 2,500 population) had the highest rate of 2.9 in 2009, equal to the national level in 1999. If this ten year lag relationship continues, we might expect the fertility rate in rural areas in 2019 to be equal to the 2009 national rate of 2.4. The fertility rate in rural areas declined the fastest in the past decade, a full 24% from their 3.8 rate in 1999.

Towns between 2,500 and 15,000 dropped 16% from 3.1 to 2.6. Small cities between 15,000 and 100,000 declined by 14% from 2.8 to 2.4, the national average. For cities of over 100,000 the 2009 rate was 2.1 (the theoretical replacement level), compared to 2.4 in 1999.

The Federal District has the lowest fertility rate by far, for example women between age 35 and 40 have had an average of 1.8 children compared to the national average of 2.5. Using this measure, other states with low fertility levels include Nuevo León with 2.3, followed by Baja California Sur, Colima, State of Mexico, Morelos, Quintana Roo and Yucatán with 2.4. The highest fertility rates are in Chiapas and Guerrero where women between age 35 and 40 have had 3.2 children on average, followed by Oaxaca with 2.9.

The demographic transition model and its application to Mexico is described in depth in chapter nine of “Geo-Mexico; the geography and dynamics of modern Mexico”.

The on-going transformation of Mexico City

 Mexico's geography in the Press  Comments Off on The on-going transformation of Mexico City
May 082011
 

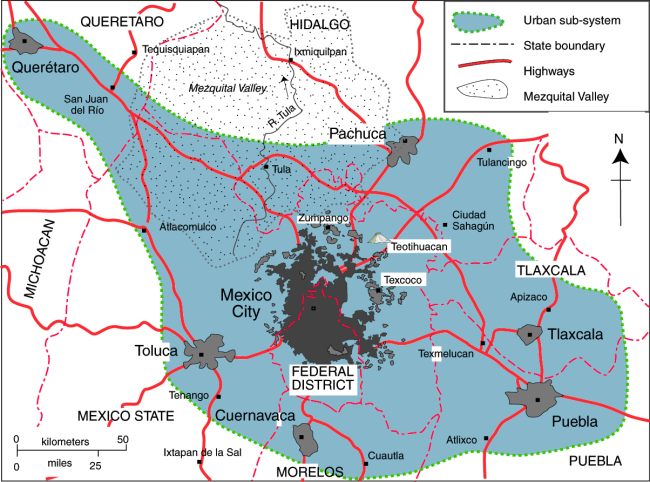
A feature article in thestar.com (link below) summarizes some of the reasons behind our long-held view that Mexico City has started, and is still undergoing, a noteworthy transformation. Change is happening not only in the urban fabric but in many aspects of the daily lives of “capitalinos“, the most polite of the various  terms used in Mexico for residents of Mexico City.

Map of Mexico City urban system

Map of Mexico City urban system. Click to enlarge. All rights reserved.

We will continue to offer occasional updates on the transformation taking place in Mexico City in future posts. Previous posts on this blog have examined many different aspects of Mexico City’s on-going transformation:

Mexico’s cities and towns are analyzed in chapters 21, 22 and 23 of Geo-Mexico: the geography and dynamics of modern Mexico. Buy your copy today!!

Our top 10 list of “googled” phrases which led to Geo-Mexico.com

 Other  Comments Off on Our top 10 list of “googled” phrases which led to Geo-Mexico.com
May 072011
 

Our trusty server stats include these “top ten” search phrases. Each of them (when entered into a certain famous leading search engine) magically brought one or more viewers to Geo-Mexico.com:

  • 10- parangaricutiro tongue twister – our post Geographic tongue-twister relating to a volcano explains this tricky-to-pronounce search
  • 9- what kind of aztec indian would you have been if u lived in El Salto mexico – perhaps an Aztec Indian?? Or, given the qualifier of “El Salto”, possibly a leaping Aztec Indian? [salto = jump or waterfall]
  • 8- what are the five countries in Mexico – We acknowledge that Mexico has suffered national identity crises various times in its tumultuous history, but fortunately never quite to this extent!
  • 7- are canada and Mexico equally linguistically diverse -Even counting the languages spoken by the various “First Nations” groups (as Canadians call their native peoples), Mexico wins this one easily. Some 60+ languages (not dialects) are spoken in Mexico
  • 6- what kind of cars do mexican cartels drive – hmm…hopefully, NOT the car you were driving just before they stopped you at a fake roadblock and took your set of wheels! [Unfortunately, this tactic has been used by drug cartels all too frequently in the past couple of years.]
  • 5- non churches in the 1600s – this intriguing concept needs narrowing down slightly before we can venture a more detailed response
  • 4- mexican cartel 1911 – possibly this was meant to be 2011 not 1911. However, Pancho Villa would indeed have been a powerful cartel leader, given half the chance; his cross-border excursions would have been very useful in that line of work, though his preferred method (horseback) was nowhere near as imaginative as the tunnels, catapults, aircraft and mini-subs used by cartels in 2011
  • 3- geographical routes from mexico to US – beyond the obvious road, railway and airline routes, we think “Geo-Mexico, the geography and dynamics of modern Mexico” has this well covered, since our chapters are clearly linked to the four major traditions of geography in the USA, and the five themes identified by the Association of American Geographers and the National Council for Geographic Education in 1984 for the teaching of geography – click the link to buy your copy today!
  • 2- names of all the volcanoes in mexico – definitely a challenging request. Assuming all categories—active, dormant and extinct—are included, the number must certainly run well into the hundreds
  • 1- spanish speaking states in mexico map – The answer to this, or the parallel question of “How many English-speaking states are there in the USA?”, might not be as obvious as it appears. However, to clear up any possible confusion, click HERE for our map of Spanish-speaking states in Mexico, and HERE for a fascinating, interactive map showing the distribution of Spanish-speakers (and other languages) in the USA. Zoom in for detailed views of individual states.

Our previous “Top Ten” list:

The Battle of Puebla is re-enacted each year on Cinco de Mayo (May 5), but in Mexico City

 Other  Comments Off on The Battle of Puebla is re-enacted each year on Cinco de Mayo (May 5), but in Mexico City
May 052011
 

The Mexican holiday of Cinco de Mayo (5 May) commemorates the Battle of Puebla, fought on May 5, 1862. Puebla is a major city about 100km east of Mexico City, on the historically important route to the port of Veracruz.

In 2012, to mark the 150th Anniversary of the Battle of Puebla, a major re-enactment of the Battle was held in Puebla, attended by the President and many cabinet members and officials. A commemorative bi-metallic 10-peso coin was also issued to commemorate this anniversary.

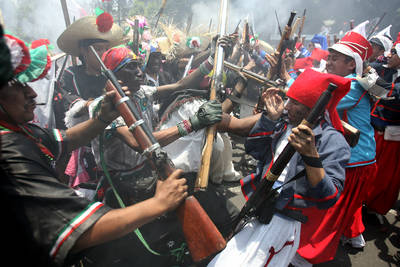
Since the 1930s, a re-enactment of the Battle of Puebla has been held each year at Peñón de los Baños, a rocky outcrop close to Mexico City’s international airport. Of geographical and geological interest, the rocky outcrop of Peñón de los Baños was formerly an island in the middle of Lake Texcoco. The prominent landmark was visited by Alexander von Humboldt when he toured parts of Mexico in 1803-4. Among other things, Humboldt analyzed the chemical composition of its thermal springs, thought to have curative and medicinal properties.

The re-enactment of the Battle of Puebla at Peñón de los Baños attracts tourists, history buffs, and Mexico City residents looking for an unusual experience.

Re-enactment of Battle of Puebla.

Re-enactment of Battle of Puebla. Photo credit: Jose Carlo González (La Jornada)

In an earlier post, we noted that the Cinco de Mayo holiday is less celebrated in Mexico these days than in the USA:

Celebrations of 5 May in the USA date back to the third quarter of the nineteenth century (only a few years after the Battle in 1862), though they gained prominence only after the 1950s and 60s when major Mexican beer makers associated their brands with Cinco de Mayo celebrations north of the border.

Mexican beer may be one of the country’s most important exports but, as the annual re-enactment in Peñón de los Baños shows,  the commemorations of Cinco de Mayo still held on Mexican soil are far more authentic.

Mexico’s population keeps growing, but at a slower pace

 Updates to Geo-Mexico  Comments Off on Mexico’s population keeps growing, but at a slower pace
May 052011
 

The 2010 census indicates that since 1960 Mexico’s population has more than tripled to 112.3 million. However, the growth rate between 2000 and 2010 (1.4% per year) is less than half the 3.4% rate of increase experienced in the 1960s. If Mexico’s population had continued to grow at 3.4% since 1960, it would have been over 186 million by now!

Population growth has slowed because the fertility rate has declined dramatically. The total number of children born per women dropped from about 8 in 1960 to 2.9 in 1999 and 2.4 in 2009. It is expected to reach the replacement level of 2.1 by 2010. The fertility rate dropped in the last ten years for women in all age groups. It dropped an impressive 54% for women aged 45 to 49 and 28% for women aged 40 to 45. However, women in these age groups have relatively few babies. Fertility in the prime childbearing age groups; 20 to 24, 25 to 29 and 30 to 35; decreased by 15%, 18% and 15% respectively. The smallest drop was 12% for females ages 15 to 19, suggesting that the incidence of teen pregnancies may remain an issue.

Increased female education is closely linked with fertility reduction. The 2010 census indicates that women with university education had an average of 1.1 children, whereas those who completed secondary school had 1.6 children. Those completing only primary school had 3.3 children, while women with no formal  education had 3.5 children. Because these women may have additional children in the future, these numbers are not directly comparable to the total fertility rates referred to earlier.

With female education levels rising and total fertility rates declining, worries about “overpopulation” in Mexico do not seem warranted at this time. As we have stressed elsewhere, the really significant characteristic of Mexico’s population is no longer how rapidly total numbers are growing, but how rapidly the average age is rising as the population ages. An earlier post here includes a link to a pdf file showing Mexico’s predicted population pyramid for 2050, which shows just how fast Mexico’s population will age if present trends continue. The changing age distribution will require substantial shifts in public services over the next 20-30 years.

Related posts include:

Several chapters of Geo-Mexico: the geography and dynamics of modern Mexico discuss additional insights into Mexico’s population dynamics and trends, and their implications for future development. Buy your copy today!

May 032011
 

Somewhat surprisingly, the number of Mexicans speaking indigenous languages has increased significantly in the past 20 years. In 2010 there were 6.7 million indigenous speakers over age five compared to 6.0 million in 2000 and 5.3 million in 1990.

There are two factors contributing to this finding:

  • First, indigenous speakers are teaching their children to speak their indigenous language.
  • Second, indigenous speakers have higher than average birth rates.

The number of indigenous speakers that cannot speak Spanish decreased slightly from 1.0 million in 2000 to 981,000 in 2010.

The most widely spoken indigenous languages are:

  • Nahuatl, with 1,587,884 million speakers, followed by
  • Maya (796,405),
  • Mixteca (494,454),
  • Tzeltal (474,298).
  • Zapotec (460,683), and
  • Tzotzil (429,168).

[Note: language names used here include all minor variants of the particular language]

About 62% of all indigenous language speakers live in rural areas, communities with under 2,500 inhabitants. Nearly 20% live in small towns between 2,500 and 15,000, while about 7% in larger towns, and 11% live in cities of over 100,000 population. Indigenous speaking areas tent to have low levels of development. Over 73% of the population In Mexico’s 125 least developed municipalities speak an indigenous language.

States with the most indigenous speakers tend to be in the south. In Oaxaca, almost 34% of the population over age three speak an indigenous language followed by Yucatán (30%), Chiapas (27%), Quintana Roo (16%) and Guerrero and Hidalgo (15%). States with the fewest indigenous speakers are Aguascalientes and Coahuila (0.2%), Guanajuato 90.53%) and Zacatecas (0.4%).

A total of 15.7 million Mexicans over age three consider themselves indigenous. Surprisingly, 9.1 million of these cannot speak any indigenous language. There are 400,000 Mexicans who can speak an indigenous language, but do not consider themselves indigenous.

Related posts:

Chapter 10 of Geo-Mexico: the geography and dynamics of modern Mexico is devoted to Mexico’s indigenous peoples. Many other chapters of Geo-Mexico include significant discussion of the cultural and development issues facing Mexico’s indigenous groups.

Cultural adaptation: the Cinco de Mayo holiday is far more widely celebrated in the USA than in Mexico

 Other  Comments Off on Cultural adaptation: the Cinco de Mayo holiday is far more widely celebrated in the USA than in Mexico
May 022011
 

The Mexican holiday of Cinco de Mayo (5 May) commemorates the Battle of Puebla, fought on May 5, 1862. The battle marks Mexico’s best-known military success since its independence from Spain in 1821.

Today, in a curious example of cultural adaptation, the resulting holiday is celebrated far more widely in the USA than in Mexico.

The background to the Battle of Puebla

The nineteenth century in Mexico was a time of repeated interventions by foreign powers, including France, Spain, Britain and the USA, all of which hatched or carried out plans to invade.

US stamp for Cinco de MayoThe first French invasion, in 1838, the so‑called Pastry War, lasted only a few days. A decade later, US troops entered Mexico City, and Mexico was forced to cede Texas, New Mexico and (Upper) California, an area of 2 million square kilometers, about half of all Mexican territory, in exchange for 15 million pesos.

A new constitution in 1857 provoked an internal conflict, known as the Reform War (1858‑60), between the liberals led by Benito Juárez, who supported the new constitution, and the conservatives. The War decimated the country’s labor force, reduced economic development and cost a small fortune. Both sides had serious financial problems. At one point in this war, the liberals reached an agreement with the USA to be paid four million pesos in exchange for which the USA would receive the “right of traffic” across the Isthmus of Tehuantepec “in perpetuity”. Fortunately, this treaty was never ratified by the US Senate.

The financial crisis deepened, eventually leading Mexico to suspend all payments on its foreign debt for two years. The vote was approved by the Mexican Congress by a single vote. The foreign powers involved were furious; in 1861, Britain, France and Spain decided on joint action to seize the port of Veracruz on Mexico’s Gulf coast and force Mexico’s government to pay. The UK and Spain quickly agreed terms and withdrew their military forces, but the French decided to stay.

The French are confident of victory

France’s emperor, Napoleon III (Louis Napoleon Bonaparte) had grand ambitions and envisaged a Mexican monarchy. To this end, he decided to place Austrian archduke Maximilian von Habsburg as his puppet on the Mexican throne. The French Army moved inland from Veracruz and occupied the city of Orizaba. The French commander was supremely confident that his forces could crush any opposition. (Following their defeat at Waterloo in 1815, no-one had beaten the French in almost fifty years.) The Commander, Charles Ferdinand Latrille, the Count of Lorencez, confidently boasted that, “We are so superior to the Mexicans in race, organization, morality and devoted sentiments that I beg your Excellency [the Minster of War] to inform the Emperor that as the head of 6,000 soldiers I am already master of Mexico.”  (Quoted in “Betterment for Whom? The Reform Period: 1855‑1875” by Paul Vanderwood, chapter 12 of The Oxford History of Mexico (edited by Michael C. Meyer and William H Beezley, O.U.P. 2000).

Mexican resistance

Marching towards Mexico City, the French needed to secure Puebla, which was defended by 4,000 or so ill‑equipped Mexican soldiers. Ironically, given the eventual outcome, many of the defenders were armed with antiquated weapons that had already beaten the French at Waterloo, before being purchased in 1825 by Mexico’s ambassador to London at a knock-down price! The Mexican forces, the Ejército de Oriente (Army of the East) were commanded by General Ignacio Zaragoza, a Texas‑born Mexican. Zaragoza dug his forces into defensive positions centered on the twin forts of Loreto and Guadalupe.

The events of 5/05

On the 5 May 1862, Zaragoza ordered his commanders to repel the invaders at all costs. Mexicans received unexpected help from the weather. After launching a brief artillery bombardment, the French discovered that the ground had become so muddy from heavy unseasonable downpours that maneuvering their heavy weapons was next to impossible.
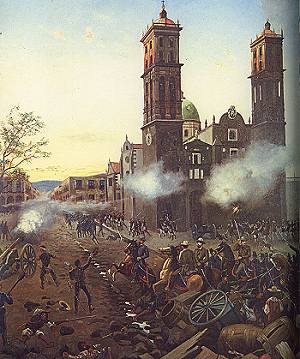
Painting of Battle of Puebla

Bullets rained down on them from the Mexican troops that occupied the higher ground near the forts. At noon, the French commander ordered his troops to charge the center of the Mexican lines. But the lines held strong, and musket fire began to take its toll. Successive French attacks were rebuffed. The Mexican forces then counter‑attacked, spurred on by well-organized cavalry, led by Porfirio Díaz who would subsequently become President of Mexico.

As the afternoon wore on, and the smoke began to clear, it became apparent that the defenders of Puebla had successfully repelled the European invaders. The French troops fled back to Orizaba before retreating back to the coast to regroup. A crack European army had been soundly defeated by a motley collection of machete‑wielding peasants from the war‑torn republic of Mexico….

A few days later, on 9 May, President Benito Juárez declared that the Cinco de Mayo would henceforth be a national holiday.

Aftermath: the French return with reinforcements

Back in Paris, Napoleon was enraged. He ordered massive reinforcements and sent a 27,000-strong force of French military might to Mexico. This strengthened French army (under Marshal Elie Forey) took Mexico City in 1863, forcing Benito Juárez and his supporters to flee. Juárez established himself in Paso del Norte (now El Paso) on the US border, from where he continued to orchestrate resistance to the French presence. Supported by the conservatives, Maximilian finally ascended to the throne in May 1864. By this time, in the USA, the Unionists had taken Vicksburg, and the US government was considering its position. In May 1865, General Philip Sheridan led 50,000 US soldiers to ensure that French troops did not cross the Mexico‑USA border. Diplomatic pressure for a French withdrawal intensified and Napoleon III finally agreed to remove his troops in February 1866.

After the French had departed, President Juárez reestablished Republican government in Mexico, and put Maximilian on trial, ending an extraordinary period in Mexican history.

The significance of 5/05

With the passing of time, the Cinco de Mayo has assumed added significance because it marks the last time that any overseas power was the aggressor on North American soil.

In Mexico, the Cinco de Mayo is still celebrated with lengthy parades in the state and city of Puebla, and in neighboring states like Veracruz. There is at least one street named Cinco de Mayo in almost every town and city throughout the country.

In the USA, the Cinco de Mayo has been transformed into a much more popular cultural event, and one where many of the revelers think it commemorates Mexican Independence, not a battle. (Mexico’s Independence celebrations are in mid-September each year).

Many communities in the USA, especially the Hispanic communities, use Cinco de Mayo as the perfect excuse to celebrate everything Mexican, from drinks, music and dancing, to food, crafts and customs. The Cinco de Mayo has become not just another day in the calendar, but a very significant commercial event, one now celebrated with much greater fervor north of the border than south of the border.

Where to go to see more — Texas

General Ignacio Zaragoza died on September 8, 1862, only a few months after the Battle of Puebla. In 1960, the General Zaragoza State Historic Site was established in his birthplace, near Goliad, Texas, to commemorate his famous victory. In Zaragoza’s time, the town was known as La Bahía del Espíritu Santo.

Where to go to see more — Puebla

The Guadalupe and Loreto forts are in parkland, about 2 km north‑east of Puebla city center. The Fuerte de Guadalupe is ruined. The Fuerte de Loreto became state property in 1930. It is now a museum, the Museum of No Intervention (Museo de la No Intervención), complete with toy soldiers. The park has an equestrian statue of General Zaragoza and is the setting for the Centro Civico 5 de Mayo, with its modern museums, including the Regional Museum (history and anthropology), the Natural History Museum and the Planetarium (IMAX screen).